

Abstract
Objective
Socioeconomic status (SES) has been associated with smoking among adolescents, but it is not known which attributes of SES are responsible for the added risk, or whether these associations are consistent in ethnically diverse samples.
Methods
This study investigated the associations between SES variables and smoking behavior among an ethnically diverse sample of 1847 8th-grade adolescents in Southern California in 2002. Several aspects of SES were examined: an objective composite measure of family and neighborhood SES, the adolescent’s spending money, and the adolescent’s perception of SES (family’s ability to afford basic necessities, wealth relative to others, and wealth relative to last year).
Results
After controlling for demographic characteristics, smoking behavior of parents and friends, and parental monitoring, low scores on the objective SES index and large amounts of pocket money were associated with an increased risk of smoking.The subjective measures of perceived SES were not associated with smoking.
Conclusions
Results indicate that increased smoking prevention efforts are needed in low-SES areas, and that limiting adolescents’ pocket money may be an effective strategy for preventing smoking.
Keywords: smoking, adolescence, socioeconomic status
Most studies of adolescent smoking have focused on psychological and social risk and protective factors rather than on economic factors (Tyas & Pederson, 1998). No single definition of socioeconomic status (SES) is universally accepted (Oakes & Rossi, 2003), but various SES measures have been linked to health outcomes and behaviors (Berkman & Kawachi, 2000). SES measures can be grouped into two categories (Adler, Epel, Castellazzo, & Ickovics, 2000). Objective measures of SES assess individuals’ material and social capital such as income, occupational category, education, and control over resources (Oakes & Rossi, 2003). Subjective measures include individuals’ perceptions about their position on the SES hierarchy relative to others, including relative deprivation (Runciman, 1966; Stewart, 2005), ladder-based measures (Singh-Manoux, Adler, & Marmot, 2003), and subjective prestige (Featherman & Hauser, 1976). Although subjective measures have not been used extensively in health research, researchers (Hodge, 1981; Rossi & Berk, 1987) argue that they reflect societal norms and are significant predictors of health (Goodman, Adler, Daniels, Morrison, Slap, & Dolan, 2003; Singh-Manoux, Marmot, & Adler, 2005).
SES factors are relevant to smoking etiology because they influence adolescents’ neighborhood and peer environments, availability of cigarettes, and psychological well-being (Stewart, 2005). Two general hypotheses appear plausible: (1) Higher wealth leads to greater access to cigarettes and higher smoking prevalence; or (2) Lower wealth leads to feelings of relative deprivation and marginalization and higher smoking prevalence.
Family / neighborhood SES and adolescent smoking
Studies of U.S. adolescents (Chen, Matthews, & Boyce, 2002; Goodman & Huang, 2002; Lowry, Kann, Collins, & Kolbe, 1996; Seltzer & Oechsli, 1985; Scarinci, Robinson, Alfano, Zbikowski, & Klesges, 2002; Wardle, Jarvis, Steggles, Sutton, Williamson, Farrimond, Cartwright, & Simon, 2003) have shown inverse correlations between family/neighborhood SES and adolescent smoking. This association may be mediated by friends’ smoking (Maddahian, Newcomb, & Bentler, 1986), parental smoking (Soteriades & DiFranza, 2003), cigarette availability (Maddahian et al., 1986), and depression (Goodman & Huang, 2002).
Spending money and smoking
Adolescents with more personal spending money are more likely to smoke (Stanton, Oei, & Silva, 2002; Scragg, Laugesen, & Robinson, 2002). It appears obvious that adolescents with more spending money would be more able to obtain cigarettes; however, most adolescents obtain their cigarettes from social sources rather than retail sources, typically without paying (White, Gilpin, Emery, & Pierce, 2005).
Lack of research on ethnically diverse samples
Most studies reviewed above were conducted among White and/or African American adolescents. Because the ethnic diversity of the U.S. is increasing, it is important to understand the predictors of smoking among other groups including Hispanics and Asians. Ethnic minority status and SES are typically interrelated. A failure to examine both as risk factors for smoking could cause researchers to attribute excess risk to ethnicity when it should be attributed to SES. Analyses of diverse samples are needed to disentangle ethnic and cultural influences from socioeconomic influences. This study extends the results of previous research by examining SES and smoking in an ethnically diverse sample.
Method
Data were obtained from the 8th-grade (2002) survey of a longitudinal study of Los Angeles adolescents (Johnson, Unger, Ritt-Olson, Palmer, Cen, Gallaher, & Chou, 2005). Surveys were conducted in 6th, 7th, and 8th grades, but only the 8th grade survey contained the economic measures. Therefore, this is a cross-sectional analysis of the 8th grade sample. Because the study’s goal was to oversample Hispanics and Asian-Americans, schools were eligible to participate if their student population was at least 25% Hispanic and/or Asian-American. 36 public and private school districts were invited to participate; 26 agreed. The 26 districts contained 150 middle schools; 68 agreed to participate. Of those, 33 met the inclusion criteria. 9 participated in pilot research and the remaining 24 participated in this study. The median income in the schools’ catchment areas was $44,590, as compared $47,493 throughout California in 2000 (U.S. Census Bureau, 2001).
Consent forms were sent home to the parents/guardians of all 6th-grade students. Of the 4,427 students invited, 3,326 (75%) provided active parental consent. Compared with students whose parents did not respond to the request for consent, the students who provided parental consent were more likely to be female, non-African-American, never-smokers, and had higher grades in school (Unger, Gallaher, Palmer, Baezconde-Garbanati, Trinidad, Cen, & Johnson, 2004). The sample was not intended to be representative of a specific geographic area because it was an oversample of Hispanics and Asians. However, we did expect the sample of participants to be representative of the schools from which they were recruited. The ethnic distribution of this sample was approximately representative of the student populations of the 24 schools (50% Hispanic, 22% Asian / Pacific Islander, and 28% other in this sample vs. 51% Hispanic, 26% Asian / Pacific Islander, and 23% other in the schools’ enrollment statistics; Greatschools.net, 2003).
Of the students with parental consent, 212 (6%) were absent from school on the day of data collection or chose not to participate. 3114 students completed the baseline survey. Of those, 2438 (78%) participated in the follow-up survey in 8th grade. Of those, 1847 (76%) provided complete data.
The analytic sample (n=1847) differed slightly from those lost to attrition. Those lost to attrition were more likely to be male (51.6% vs. 44.3%, Χ2=16.08, p<.0001), older (mean age=11.4 years [SD=0.5] vs. 11.3 years [SD=0.5], t=3.15, p<.005), have tried smoking in 6th grade (12.1% vs. 6.5%, Χ2=29.87, p<.0001), and live in ZIP Codes with median household income<$30,000/year (50.1% vs. 26.9%, Χ2=173.55, p<.0001). Nevertheless, the analytic sample still contained sufficient variability for these analyses.
Objective SES measures
SES measures were selected based on literature reviews and the investigators’ judgments about which indicators of SES could be reported by adolescents. Some commonly-used measures (e.g., parents’ income or occupational titles) were not included because our previous research indicated that many adolescents left these questions blank.
Parents’ education
Students were asked whether each parent had finished high school and/or college. This measure was used because our previous pilot data indicated that many middle school students knew whether their parents had gone to college, but they were not able to identify the type of college degrees their parents had earned. Each parent’s education was coded as 0 if the parent had not finished high school, 1 if the parent had finished high school but not college, and 2 if the parent was a college graduate. The two parents’ scores were averaged to create the parents’ education score. If there was only one parent, that parent’s score was used.
Rooms per person in home
The ratio of the number of rooms to people in the respondent’s residence has been used as an estimate of SES; it is typically correlated with overcrowding and poverty indices (Myers, Baer, & Choi, 1996) and can be reported by adolescents.
Median household income in ZIP Code
The median household income of each student’s ZIP Code was obtained from 2000 U.S. Census data. We are aware that Census tracts may have provided more precise estimates (Krieger, Chen, Waterman, Soobader, Subramanian, & Carson, 2003), but the IRB did not allow us to ask the students’ precise addresses.
Spending money was assessed with the question: “How much money do you get each week to spend any way you want?”, rated on a 7-point scale from “None” to “more than 50 dollars.”
Subjective SES measures
Family’s ability to afford basic necessities was assessed with a 3-item scale (Cronbach’s alpha=.63): “In the past year, was your family able to afford furniture or household equipment that needed to be replaced?”; “In the past year, was your family able to afford to buy the kind of food you should have?”; and “In the past year, was your family able to afford the kind of medical care you should have?” Response options were “yes” and “no.” The “yes” responses were summed.
Perceived wealth relative to others was assessed with a 2-item scale (Cronbach’s alpha=.59): “Would you say that your family’s income is higher, lower, or about the same as that of most of your friends?”; “Would you say that your family’s income is higher, lower, or about the same as that of most of your neighbors?” Response options were, “higher,” “lower,” and “about the same.” The scale score was the mean of the two items.
Perceived wealth relative to last year was assessed with the question, “Compared with last year, would you say your family’s income is....” “Higher now than last year,” “Lower than last year,” or “About the same as last year.”
Smoking behavior was assessed with the question, “Have you ever tried cigarette smoking, even a few puffs?” (yes/no) This lifetime smoking measure was used instead of more advanced levels of smoking because the prevalence of smoking in this sample was very low (only 3% of the respondents had smoked in the past month). Therefore, this is an analysis of early experimentation with smoking, not progression to more advanced levels of nicotine dependence.
The following covariates were included because they were significantly associated with smoking and SES and therefore could be confounders: Parents’ smoking - “Think about the 2 adults you spend the most time with: How many of them smoke?”; Friends’ smoking - “How many of your friends smoke cigarettes at least once a month?”; Parental monitoring - a 5-item scale described in detail elsewhere (Shakib, Mouttapa, Johnson, Ritt-Olson, Trinidad, Gallaher, & Unger, 2003). Demographic covariates included age, gender, and ethnicity (Asian, Hispanic, White, Other).
Statistical analysis
Logistic regression was used to analyze the association between SES and lifetime smoking. Because students were nested within schools, data were analyzed with multilevel logistic regression models using the SAS GLIMMIX procedure. To examine ethnic differences in the associations between SES and smoking, interaction terms representing each SES variable X ethnicity were included.
The complex data structure (ZIP codes partially, but not completely, nested within schools) creates an analytic challenge. We calculated intraclass correlation coefficients (ICCs) for smoking at the ZIP code and school levels. The school level ICC (.063) was considerably larger than the ZIP code level ICC (.026), indicating that ZIP codes are more heterogeneous in adolescent smoking than schools are. Therefore, we used school as the clustering variable, because most of the intraclass correlation occurs there.
Results
Table 1 shows the students’ demographic characteristics and smoking behavior. Most lived in ZIP Codes where the 2000 median household income was below $50,000 per year (69%). Most (82%) had never tried smoking.
Table 1.
Demographic characteristics of respondents, Los Angeles, California, 2002
| N | % | ||||
|---|---|---|---|---|---|
| Age (years) | |||||
| 11-12 | 50 | 3% | |||
| 13 | 1595 | 86% | |||
| 14 | 195 | 11% | |||
| 15-16 | 7 | 0% | |||
| Gender | |||||
| Female | 1030 | 56% | |||
| Male | 817 | 44% | |||
| Race/Ethnicity | |||||
| Hispanic | 915 | 50% | |||
| Asian | 406 | 22% | |||
| Other | 406 | 22% | |||
| White | 120 | 6% | |||
| Median annual household income in ZIP Code | |||||
| < $30,000 | 500 | 27% | |||
| $30,000 - $39,999 | 550 | 30% | |||
| $40,000 - $49,999 | 214 | 12% | |||
| $50,000 - $59,999 | 336 | 18% | |||
| $60,000 + | 247 | 13% | |||
| Lifetime smoking | |||||
| Yes | 337 | 18% | |||
| No | 1510 | 82% | |||
| Past-month smoking | |||||
| Yes | 65 | 3% | |||
| No | 1782 | 97% | |||
Table 2 shows the intercorrelations among the SES measures. Because the three objective SES measures (ZIP Code median household income, parents’ education, and rooms per person) were intercorrelated, they were combined to form a single SES scale. The scale score was calculated by standardizing each variable to a mean of 0 and a standard deviation of 1 and then taking the mean of the three items (Cronbach’s alpha = .69). The other SES measures (spending money, perceived ability to afford basic necessities, perceived wealth relative to others, and perceived wealth relative to last year) were not correlated strongly with the objective SES measures or with one another. They were retained as separate predictor variables.
Table 2.
Correlation matrix of economic measures, Los Angeles, California, 2002
| ZIP Code median income | Rooms per person | Parents’ education | Spending money | Able to afford basic necessities | Perceived wealth relative to others | Perceived wealth relative to last year | |
|---|---|---|---|---|---|---|---|
| ZIP Code median income | 1 | ||||||
| Rooms per person | .44* | 1 | |||||
| Parents’ education | .47* | .36* | 1 | ||||
| Spending money | -.13* | -.01 | -.07* | 1 | |||
| Able to afford basic necessities | .03 | .02 | .04 | .07* | 1 | ||
| Perceived wealth relative to others | .03 | .11* | .11* | .22* | .13* | 1 | |
| Perceived wealth relative to last year | .00 | .00 | .05* | .11* | .11* | .24* | 1 |
p<.05
Table 3 shows the results of the logistic regression analysis predicting lifetime smoking. The objective SES scale was inversely associated with smoking (OR=0.83, 95% CI=0.70, 0.98); smoking prevalence was lower among those with higher SES. Spending money was positively associated with smoking (OR=1.21, 95% CI=1.06, 1.38); smoking prevalence was higher among those with larger amounts of spending money. The perceived SES measures were not associated with smoking.
Table 3.
Logistic regression predicting lifetime smoking, Los Angeles, California, 2002
| Variable | Odds Ratio | 95% Confidence Interval | |
|---|---|---|---|
| Age | 1.72* | (1.25, 2.37) | |
| Female (vs. male) | 0.94 | (0.72, 1.23) | |
| Asian (vs. White) | 0.76 | (0.37, 1.54) | |
| Hispanic (vs. White) | 1.50 | (0.76, 2.99) | |
| Other ethnicity (vs. White) | 1.28 | (0.65, 2.53) | |
| Friends’ smoking1 | 1.72* | (1.52, 1.93) | |
| Parents’ smoking1 | 1.22* | (1.09, 1.38) | |
| Parental monitoring1 | 0.68* | (0.60, 0.78) | |
| SES scale1 | 0.83* | (0.70, 0.98) | |
| Spending money1 | 1.21* | (1.06, 1.38) | |
| Perceived ability to afford basic necessities1 | 0.93 | (0.82, 1.05) | |
| Perceived wealth relative to others1 | 0.92 | (0.79, 1.06) | |
| Perceived wealth relative to last year1 | 1.12 | (0.98, 1.28) | |
p<.05
Note. All variables were entered simultaneously into the model, so each odds ratio is controlled for the other variables in the model.
Scale score is standardized to a mean of 0 and a standard deviation of 1. Therefore, the odds ratio represents the odds associated with a 1 standard deviation difference in the score.
SES X ethnicity interaction terms were examined in the logistic regression models to determine whether the associations varied across ethnic groups. None were significant, so they were not retained in the final model.
Figure 1 illustrates the significant associations. Smoking prevalence increased with spending money, from 14% among those with no spending money to 36% among those who received $30 or more per week. The prevalence of smoking was 21-23% among those in the lowest 3 quintiles of SES, but it decreased to 10% among the highest quintile.
Figure 1.
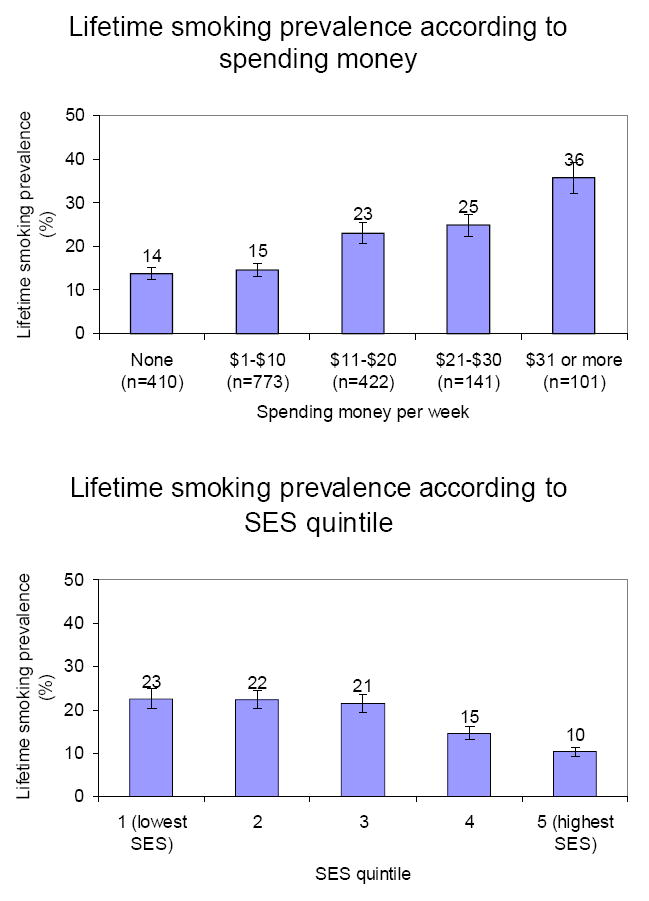
Lifetime smoking prevalence according to spending money and SES, Los Angeles, California, 2002
Note. Error bars represent standard errors.
Discussion
This study examined two hypotheses about SES and smoking among adolescents: (1) Higher wealth leads to greater access to cigarettes and higher smoking prevalence; or (2) Lower wealth leads to feelings of relative deprivation and marginalization and higher smoking prevalence. Support was found for both hypotheses, depending on the measure of SES used. Consistent with Hypothesis 1, smoking was more prevalent among those with more spending money. Consistent with Hypothesis 2, smoking was more prevalent among those with lower objectively-measured SES. These findings in an ethnically diverse sample are consistent with findings in less diverse samples (Chen et al., 2002; Goodman & Huang, 2002; Lowry et al., 1996; Scragg et al., 2002; Seltzer & Oechsli, 1985; Scarinci et al., 2002; Stanton et al., 2002; Wardle et al., 2003). They indicate that the association between SES and smoking exists among Hispanic and Asian-American adolescents, in addition to African-American and White adolescents. The associations did not differ across ethnic groups, providing additional support for their generalizability.
Contrary to expectations, the adolescents’ perceptions of their families’ SES were not associated with their smoking behavior. The correlations between the objective SES measures and the adolescents’ perceptions of their relative SES were low. Los Angeles is comprised of a diverse array of neighborhoods that vary greatly in SES. Adolescents in relatively economically deprived areas may not perceive themselves as deprived, because their friends and neighbors are equally deprived. Nevertheless, adolescents in low-SES areas are exposed to a greater concentration of cigarette retailers and storefront cigarette advertising (Novak, Reardon, Raudenbush, & Buka, 2006; Laws, Whitman, Bowser, & Krech, 2002) which may influence their smoking risk regardless of whether they are aware of their economic deprivation.
The measures of perceived SES may have lacked reliability or validity. Because we were not able to find brief survey measures of relative deprivation appropriate for adolescents, we wrote these measures specifically for this survey. Although they have good face validity and adequate internal consistency reliability, additional research is needed to determine whether they have good construct validity and test-retest reliability.
Limitations
Because SES was not the primary focus of the study, detailed SES measures were only included on the 8th grade survey, so only a cross-sectional analysis of the 8th grade survey was possible. Future studies should assess SES at baseline and follow students prospectively. These results may not generalize to the students who were lost to attrition.
It is difficult to obtain reliable objective SES data from adolescents. The adolescents’ self-reported rooms per person, parents’ educational achievement, and ZIP Codes were used to create an SES index, which may have contained random error. Random error would attenuate associations between the index and smoking, so the results reported here are conservative. The composite measures had low Cronbach’s alphas. Psychometric research is needed to validate measures suitable for adolescents.
Low family/ neighborhood SES and large amounts of pocket money are risk factors for smoking among culturally diverse adolescents. Smoking prevention programs for low-SES adolescents could be a useful strategy to prevent tobacco-related diseases.
Acknowledgments
This research was supported by the University of Southern California Transdisciplinary Tobacco Use Research Center (TTURC), funded by the National Institutes of Health (grant #1 P50 CA84735-01) and the California Tobacco-Related Disease Research Program (TRDRP; grant # 7PT-7004). The authors thank Gaylene Gunning, Steven Cen, and the TTURC/IRP project staff for assistance with data collection and data management.
Footnotes
Publisher's Disclaimer: This is a PDF file of an unedited manuscript that has been accepted for publication. As a service to our customers we are providing this early version of the manuscript. The manuscript will undergo copyediting, typesetting, and review of the resulting proof before it is published in its final citable form. Please note that during the production process errors may be discovered which could affect the content, and all legal disclaimers that apply to the journal pertain.
References
- Adler NE, Epel ES, Castellazzo G, Ickovics JR. Relationship of subjective and objective social status with psychological and physiological functioning: preliminary data in healthy white women . Health Psychology. 2000;19:586–592. doi: 10.1037//0278-6133.19.6.586. [DOI] [PubMed] [Google Scholar]
- Arillo-Santillan E, Lazcano-Ponce E, Hernandez-Avila M, Fernandez E, Allen B, Valdes R, Samet J. Associations between individual and contextual factors and smoking in 13 293 Mexican students. American Journal of Preventive Medicine. 2005;28:41–51. doi: 10.1016/j.amepre.2004.09.002. [DOI] [PubMed] [Google Scholar]
- Austin SB, Rich M. Consumerism: its impact on the health of adolescents. Adolescent Medicine. 2001;12:389–409. [PubMed] [Google Scholar]
- Berkman LF, Kawachi I. Social epidemiology. New York: Oxford; 2000. [Google Scholar]
- Chen E, Matthews KA, Boyce WT. Socioeconomic differences in children’s health: how and why do these relationships change with age? Psychological Bulletin. 2002;128:295–329. doi: 10.1037/0033-2909.128.2.295. [DOI] [PubMed] [Google Scholar]
- Featherman DL, Hauser RM. Prestige or socioeconomic status scales in the study of occupational achievement? Sociological Methods and Research. 1976;4:403–422. [Google Scholar]
- Goodman E, Adler NE, Daniels SR, Morrison JA, Slap GB, Dolan LM. Impact of objective and subjective social status on obesity in a biracial cohort of adolescents. Obesity Research. 2003;11:1018–1026. doi: 10.1038/oby.2003.140. [DOI] [PubMed] [Google Scholar]
- Hodge RW. The measurement of occupational status. Social Science Research. 1981;10:396–415. [Google Scholar]
- Johnson CA, Unger JB, Ritt-Olson A, Palmer PH, Cen SY, Gallaher P, Chou CP. Smoking prevention for ethnically diverse adolescents: 2-year outcomes of a multicultural, school-based smoking prevention curriculum in Southern California. Preventive Medicine. 2005;40:842–852. doi: 10.1016/j.ypmed.2004.09.032. [DOI] [PubMed] [Google Scholar]
- Kim S, Symons M, Popkin BM. Contrasting socioeconomic profiles related to healthier lifestyles in China and the United States. American Journal of Epidemiology. 2004;159:184–191. doi: 10.1093/aje/kwh006. [DOI] [PubMed] [Google Scholar]
- Krieger N, Chen JT, Waterman PD, Soobader MJ, Subramanian SV, Carson R. Choosing area based socioeconomic measures to monitor social inequalities in low birth weight and childhood lead poisoning: The Public Health Disparities Geocoding Project (US) Journal of Epidemiology and Community Health. 2003;57:186–199. doi: 10.1136/jech.57.3.186. [DOI] [PMC free article] [PubMed] [Google Scholar]
- Langille DB, Curtis L, Hughes J, Murphy GT. Association of socio-economic factors with health risk behaviours among high school students in rural Nova Scotia. Canadian Journal of Public Health. 2003;94:442–447. doi: 10.1007/BF03405082. [DOI] [PMC free article] [PubMed] [Google Scholar]
- Laws MB, Whitman J, Bowser DM, Krech L. Tobacco availability and point of sale marketing in demographically contrasting districts of Massachusetts. Tobacco Control. 2002;11 (Suppl 2):71–73. doi: 10.1136/tc.11.suppl_2.ii71. [DOI] [PMC free article] [PubMed] [Google Scholar]
- Lowry R, Kann L, Collins JL, Kolbe LJ. The effect of socioeconomic status on chronic disease risk behaviors among US adolescents. JAMA. 1996;276:792–797. [PubMed] [Google Scholar]
- Maddahian E, Newcomb MD, Bentler PM. Adolescents’ substance use: impact of ethnicity, income, and availability. Advances in Alcohol and Substance Abuse. 1986;5:63–78. doi: 10.1300/J251v05n03_05. [DOI] [PubMed] [Google Scholar]
- Novak SP, Reardon SF, Raudenbush SW, Buka SL. Retail tobacco outlet density and youth cigarette smoking: a propensity-modeling approach. American Journal of Public Health. 2006;96:670–676. doi: 10.2105/AJPH.2004.061622. [DOI] [PMC free article] [PubMed] [Google Scholar]
- Oakes JM, Rossi PH. The measurement of SES in health research: Current practice and steps toward a new approach. Social Science & Medicine. 2003;56:769–784. doi: 10.1016/s0277-9536(02)00073-4. [DOI] [PubMed] [Google Scholar]
- Rossi PH, Berk RA. Varieties of normative consensus. American Sociological Review. 1987;50:333–347. [Google Scholar]
- Runciman WG. Relative deprivation and social justice: A study of attitudes to social inequality in twentieth-century England . Berkeley, CA: University of California Press; 1966. [Google Scholar]
- Scarinci IC, Robinson LA, Alfano CM, Zbikowski SM, Klesges RC. The relationship between socioeconomic status, ethnicity, and cigarette smoking in urban adolescents. Preventive Medicine. 2002;34:171–178. doi: 10.1006/pmed.2001.0967. [DOI] [PubMed] [Google Scholar]
- Scragg R, Laugesen M, Robinson E. Cigarette smoking, pocket money and socioeconomic status: results from a national survey of 4th form students in 2000. New Zealand Medical Journal. 2002;115:108. [PubMed] [Google Scholar]
- Seltzer CC, Oechsli FW. Psychosocial characteristics of adolescent smokers before they started smoking: evidence of self-selection. A prospective study . Journal of Chronic Disease. 1985;38:17–26. doi: 10.1016/0021-9681(85)90004-9. [DOI] [PubMed] [Google Scholar]
- Shakib S, Mouttapa M, Johnson CA, Ritt-Olson A, Trinidad DR, Gallaher PE, Unger JB. Ethnic variation in parenting characteristics and adolescent smoking. Journal of Adolescent Health. 2003;33:88–97. doi: 10.1016/s1054-139x(03)00140-x. [DOI] [PubMed] [Google Scholar]
- Singh-Manoux A, Adler NE, Marmot MG. Subjective social status: Its determinants and its association with measures of ill-health in the Whitehall II study. Social Science & Medicine. 2003;56:1321–1333. doi: 10.1016/s0277-9536(02)00131-4. [DOI] [PubMed] [Google Scholar]
- Singh-Manoux A, Marmot MG, Adler NE. Does subjective social status predict health and change in health status better than objective status? Psychosomatic Medicine. 2005;67:855–861. doi: 10.1097/01.psy.0000188434.52941.a0. [DOI] [PubMed] [Google Scholar]
- Soteriades ES, DiFranza JR. Parent’s socioeconomic status, adolescents’ disposable income, and adolescents’ smoking status in Massachusetts. American Journal of Public Health. 2003;93:1155–1160. doi: 10.2105/ajph.93.7.1155. [DOI] [PMC free article] [PubMed] [Google Scholar]
- Stanton WR, Oei TP, Silva PA. Sociodemographic characteristics of adolescent smokers. International Journal of the Addictions. 1994;29:913–925. doi: 10.3109/10826089409047917. [DOI] [PubMed] [Google Scholar]
- Stewart QT. Reinvigorating relative deprivation: A new measure for a classic concept. Social Science Research. 2005;35:779–802. [Google Scholar]
- Sun P, Unger JB, Palmer PH, Gallaher P, Chou CP, Baezconde-Garbanati L, Sussman S, Johnson CA. Internet accessibility and usage among urban adolescents in Southern California: implications for web-based health research. Cyberpsychology and Behavior. 2005;8:441–453. doi: 10.1089/cpb.2005.8.441. [DOI] [PubMed] [Google Scholar]
- Tyas SL, Pederson LL. Psychosocial factors related to adolescent smoking: a critical review of the literature. Tobacco Control. 1998;7:409–420. doi: 10.1136/tc.7.4.409. [DOI] [PMC free article] [PubMed] [Google Scholar]
- Unger JB, Cruz T, Shakib S, Mock J, Shields A, Baezconde-Garbanati L, Palmer P, Cruz JD, Edsall E, Gritz ER, Glynn T, Johnson CA. Exploring the cultural context of tobacco use: a transdisciplinary framework. Nicotine & Tobacco Research. 2003;5:S101–S117. doi: 10.1080/14622200310001625546. [DOI] [PubMed] [Google Scholar]
- Unger JB, Gallaher P, Palmer PH, Baezconde-Garbanati L, Trinidad DR, Cen S, Johnson CA. Characteristics of adolescents who provide neither parental consent nor refusal for participation in school-based survey research. Evaluation Review. 2004;28:52–63. doi: 10.1177/0193841X03254421. [DOI] [PubMed] [Google Scholar]
- Wardle J, Jarvis MJ, Steggles N, Sutton S, Williamson S, Farrimond H, Cartwright M, Simon AE. Socioeconomic disparities in cancer-risk behaviors in adolescence: baseline results from the Health and Behaviour in Teenagers Study (HABITS) Preventive Medicine. 2003;36:721–730. doi: 10.1016/s0091-7435(03)00047-1. [DOI] [PubMed] [Google Scholar]
- White MM, Gilpin EA, Emery SL, Pierce JP. Facilitating adolescent smoking: who provides the cigarettes? American Journal of Health Promotion. 2005;19:355–360. doi: 10.4278/0890-1171-19.5.355. [DOI] [PubMed] [Google Scholar]
- Wilson N, Syme SL, Boyce WT, Battistich VA, Selvin S. Adolescent alcohol, tobacco, and marijuana use: the influence of neighborhood disorder and hope. American Journal of Health Promotion. 2005;20:11–19. doi: 10.4278/0890-1171-20.1.11. [DOI] [PubMed] [Google Scholar]