Abstract
Interferon-gamma (IFN-γ) ELISpot and intracellular cytokine staining (ICS) assays are routinely employed in clinical HIV vaccine trials to identify antigen-specific T cells in cryopreserved peripheral blood mononuclear cells (PBMC). Several parameters involved in blood collection, processing and shipping may influence immunological function of the resulting cells, including anticoagulant type, time from venipuncture to PBMC isolation/cryopreservation, method of PBMC isolation and procedure for sample shipping. We examined these parameters in single and multiple site studies, and found the length of time from venipuncture to cryopreservation is the most important parameter affecting performance of T cells in immunological assays. Comparing blood processed at 24 hours after venipuncture with that processed within eight hours, we observed on average a modest reduction in PBMC viability (∼8% decrease), a greater loss in cell recovery (∼32%), and between 36-56% loss in IFN-γ T cell frequencies by ELISpot assay. We also describe three cold shipping methods that maintain immunological function in appropriately cryopreserved PBMC. These data indicate that cryopreservation of PBMC should occur within eight hours of venipuncture for optimal performance. This narrow window for specimen processing has important implications in selecting and monitoring clinical sites with laboratory capacity to perform these procedures in future clinical trials.
1. Introduction
Historically, protection from disease has been the major determinant of vaccine efficacy, and this is usually attributed to a strong humoral response that neutralizes the invading pathogen or harmful pathogen product (Hilleman, 2000). Due to difficulties raising broadly neutralizing antibodies against HIV, most candidate HIV vaccines in current clinical trials are designed to elicit HIV-specific T cell immunity. As such, characterization of the range of effector functions in vaccine-induced T cells has assumed increasing significance. T cell immunity involved in viral control is presumed to occur either through direct lysis of infected cells or secretion of antiviral cytokines and chemokines (Yasutomi et al., 1993; Koup et al., 1994; Matano et al., 1998; Jin et al., 1999; Schmitz et al., 1999). Thus, major efforts have been undertaken to standardize assays, primarily IFN-γ ELISpot and ICS by flow cytometry, which can accurately quantify vaccine-induced T cell responses. This information enables characterization of immunogenicity, prioritization of promising vaccine candidates for advancement to larger scale trials, and assessment of correlates of immune protection.
As HIV-1 vaccine evaluation moves forward into multicenter, large-scale phase IIB and III trials throughout the world, it becomes nearly impossible to perform anti-viral T cell assays on freshly isolated PBMC. Centralized laboratory facilities have largely replaced multiple small site laboratories as the complexities of the immunological assays have grown and in response to regulatory requirements that mandate use of validated assays. Further, assessments of immune correlates of HIV protection by vaccination entail case-control study designs, necessitating the use of cryopreserved PBMC for retrospective analyses. Thus, it is essential that cryopreserved PBMC retain functional capacity in order to successfully evaluate candidate vaccine immunogenicity and efficacy.
A small number of published studies have examined the impact of sample collection and processing on performance in cellular immune functional assays. Most of the early efforts compared phenotype preservation by flow cytometry using different anticoagulants (Nicholson et al., 1984; Nicholson and Green, 1993; Shalekoff et al., 1998). Findings indicated decreased preservation of T and B cell subsets when whole blood collected in ethylene diamine tetra acetic acid (EDTA) was stored for 24 hours (Nicholson et al., 1984; Nicholson and Green, 1993), and decreased expression of activation markers after storage in EDTA or sodium heparin (Shalekoff et al., 1998). A smaller number of publications examined the effect of anticoagulants on the performance of T cells in immunological assays, primarily using the lymphoproliferative assay (LPA) to measure functional competency. These studies showed a gradual and complete loss of proliferation in blood stored in EDTA from 0 to 24 hours (Weinberg et al., 1998; Kumar and Satchidanandam, 2000). Measurement of antigen-specific T cell activity by LPA and cytolytic chromium release assays (Weinberg et al., 1998) has typically required freshly isolated PBMC for optimal detection of responses. Shipment and storage of peripheral blood, as well as the type of anticoagulant used in these studies, profoundly affected performance in these assays (Betensky et al., 2000; Sun et al., 2003).
Intracellular cytokine staining (ICS) by flow cytometry and the IFN-γ ELISpot assay (McCutcheon et al., 1997; Scheibenbogen et al., 2000; Kumar et al., 2001; Self et al., 2001; Hudgens et al., 2004, Trigona, 2003) can quantify ex vivo virus-specific memory T cells from cryopreserved PBMC (Russell et al., 2003; Maecker et al., 2005). Considerable progress has been made in improving and validating these assays for use in clinical vaccine trials (Russell et al., 2003). No data exist for addressing parameters from venipuncture to isolation/cryopreservation for PBMC recovery/viability and performance in ICS or IFN-γ ELISpot. The requirements for sample preparation and cryopreservation, particularly the optimal time for isolation, necessarily have a profound impact on how clinical sites implement future trials aimed at ascertaining induction of memory T cell responses. For this purpose, we studied the effects of different anticoagulants, processing times, processing methods, shipping methods and cryopreservation media on recovery, viability and T cell function in immunological assays in PBMC from HIV-uninfected healthy individuals. We demonstrate that the single most important parameter affecting PBMC performance in the immunoassays is the length of time from venipuncture to cryopreservation.
2. Materials and Methods
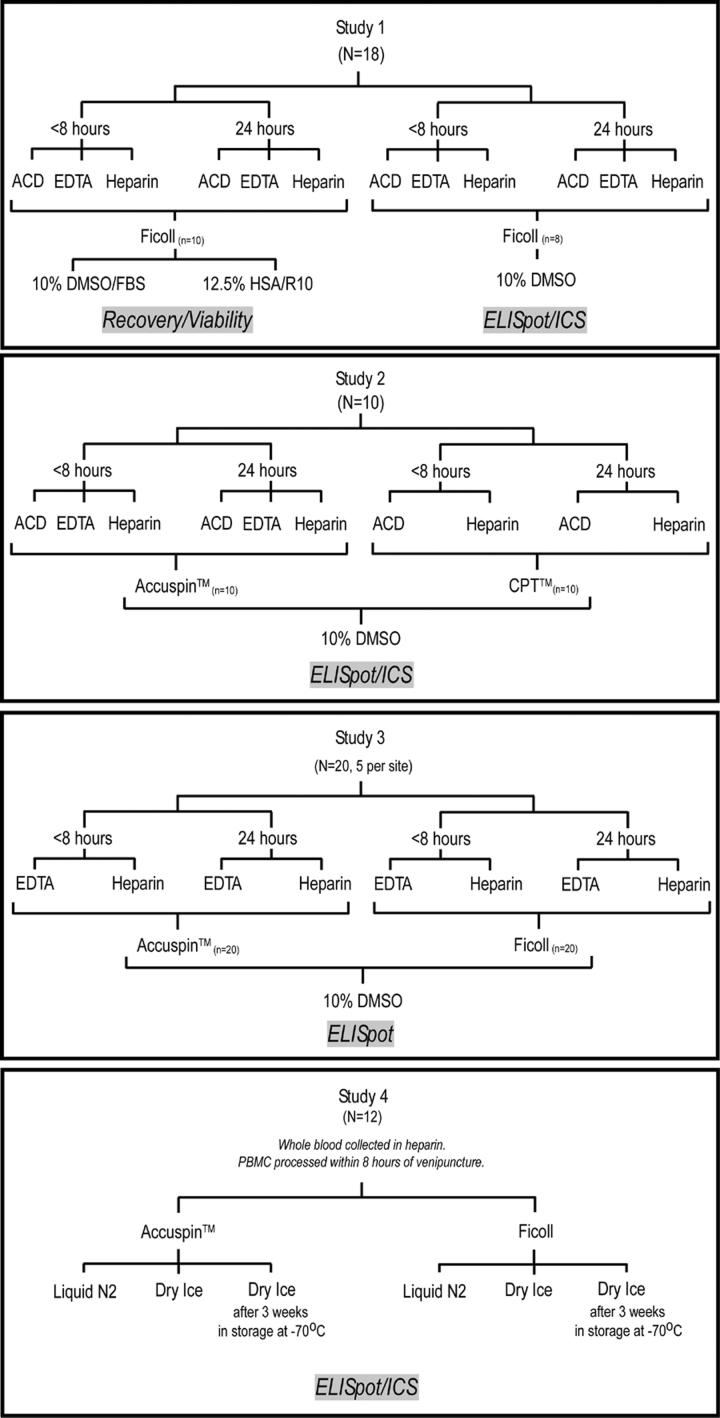
2.1 Study Designs (See Figure 1)
Figure 1.
Overview of the four study designs examining the effect of different anticoagulants, PBMC processing methods, processing times and shipping methods on cell recovery, viability, and function in immunological assays.
Study 1: Determination of optimal cryopreservation medium and time from venipuncture to blood processing
In the first set of studies, blood from 18 individuals was collected into three different anticoagulants: acid citrate dextrose (ACD), EDTA, and sodium heparin. Half of the blood was processed within eight hours of venipuncture, and half was sent via overnight (O/N) courier (Federal Express) to the Fred Hutchinson Cancer Research Center (FHCRC) laboratory for PBMC isolation and cryopreservation (designated 24 hours, which was the approximate time from venipuncture to cryopreservation). All PBMC were isolated using Ficoll density centrifugation, according to standard procedures (Bach and Brashler, 1970; Boyum, 1976). In addition to examining different processing times and anticoagulants, ten of these samples were used to examine the effect of different cryopreservation media on cell recovery and viability among the three anticoagulants. For this group (n=10), isolated PBMC were frozen in either FBS containing 10% DMSO (10%DMSO/FBS) or in RPMI containing 10% DMSO and 12.5% human serum albumin (12.5% HSA/R10), and assessed for viability and recovery only. For the remaining eight individuals, PBMC were cryopreserved using 10% DMSO/FBS; and functional activity was examined by ELISpot and ICS. After 24 hours at −70° C, all PBMC were stored in liquid nitrogen vapor for less than one month (15-21 days) until thawing for use in functional immunoassays.
Study 2: Determination of optimal blood processing methods
In the second study, blood from ten individuals was collected into one of three anticoagulants, but processed using Accuspin™ tubes (Sigma, St. Louis, MO) or cell preparation tubes ((CPT™, Becton Dickinson (BD), San Jose, CA)) following manufacturer guidelines, and cryopreserved in 10%DMSO/FBS. For both isolation methods (Accuspin™ or CPT™), half of the whole blood was sent via O/N courier (Federal Express) to the FHCRC laboratory for isolation and cryopreservation within 24 hours; the other half was processed within eight hours of venipuncture and cryopreserved on-site. After 24 hours at −70°C, PBMC were stored in liquid nitrogen vapor for 3-7 days until thawing for use in functional immunoassays.
Study 3: Specimen processing at four clinical sites and shipment to a central immunology laboratory
In a third study, whole blood from 20 volunteers was collected into EDTA or sodium heparin venipuncture tubes from four HIV Vaccine Trials Network (HVTN) HIV Clinical Trials units (HVTU) across the United States (FHCRC Seattle, WA; University of Rochester, Rochester, NY; University of Alabama, Birmingham, AL; and St. Louis University, St. Louis, MO). The blood samples were processed and cryopreserved at two different time points (within eight hours or at 24 hours) post-venipuncture, in some cases after being shipped overnight via Federal Express courier. Blood was collected into either EDTA or sodium heparin vacutainer tubes and, then processed using either Accuspin or Ficoll methods. Half of the samples were processed within eight hours at the HVTU site. Another quarter of the whole blood was processed using Accuspin™ tubes, and shipped overnight in the Accuspin™tube with media on cold packs to a central specimen repository for cryopreservation the following day. The final quarter of whole blood collected in EDTA and sodium heparin, was sent unprocessed in venipuncture tubes overnight to a central specimen repository where PBMC were isolated using the standard Ficoll density centrifugation techniques employed by the HVTN (Kumar et al., 2000; Hudgens et al., 2004).
Study 4: Effect of different shipping methods on viability and performance in immunological assays
A fourth study was conducted to compare different methods of shipping PBMC after being isolated and cryopreserved at −70°C for 24 hours. For this study, whole blood from 12 individuals with a range of known viral-specific responses to CMV, influenza and EBV, was collected into ACD or sodium heparin venipuncture tubes. The blood was processed using either Accuspin™ tubes or Ficoll within eight hours of venipuncture. The PBMC were frozen in 10%DMSO/FBS and placed at −70°C for 24 hours prior to being prepared for one of three shipping methods, all by Federal Express courier: 1) a portion of vials was transferred to the vapor phase of liquid nitrogen (LN) in a shipping tank after 24 hours at −70°C and shipped overnight to a repository where samples were placed into a LN storage tank; 2) another portion was placed on dry ice following 24 hours at −70°C, and shipped overnight to a repository where these samples were placed into LN (Dry Ice –DI); and 3) the final portion was left at −70°C for three weeks, then shipped overnight on dry ice to a repository where the samples were immediately placed into a LN storage tank (−70 3 WK).
Study Participants
All study participants provided written informed consent at the appropriate HIV Vaccine Trial Unit (HVTU) (Fred Hutchinson Cancer Research Center (FHCRC), University of Rochester, University of Alabama, and St. Louis University). The studies were reviewed and approved by the appropriate Institutional Review Boards.
2.2 PBMC processing methods
Three different PBMC processing methods were utilized for isolation of PBMC: Ficoll density centrifugation, Accuspin™, or CPT™ tubes. For Ficoll isolation, whole blood diluted 1:1 with Hank's Balanced Salt Solution (HBSS; Gibco BRL, Invitrogen Technologies, Carlsbad, CA) was overlaid onto Ficoll separation media (obtained from FHCRC Cell Processing shared resource center) and centrifuged at 2000 RPM (900 g) for 15 minutes with no brake. The PBMC at the plasma interface were collected and washed with HBSS two times by centrifugation at 1500 rpm (500 g) for 15 minutes at room temperature (RT). The cells were counted using a Guava cell counter (Guava Technologies, Hayward, CA); and then cryopreserved at a concentration of approximately 1−2 × 10⁷ cells/ml, depending on the study (Study 1 & 2: 1.5−2.0 ×10⁷, Study 3 & 4 1.0×10⁷ cells/ml). All PBMC regardless of processing tubes, processing time, or shipping method were immediately placed at −70°C for 24 hours after PBMC isolation, then transferred to LN, dry ice, or left at −70°C for 3 weeks depending on the study. The unprocessed venipuncture tubes were shipped overnight at ambient temperature, and whole blood was processed the following day, as described above.
When the Accuspin™ tubes were utilized, whole blood diluted 1:1 with HBSS was placed into 50 ml Accuspin™ tubes and centrifuged at 2000 RPM (900 g) for 15 minutes with no brake at RT. The PBMC at the plasma interface were collected and washed with HBSS two times by centrifugation at 1500 rpm (500 g) for 15 minutes at RT. The cells were counted using a Guava cell counter and then cryopreserved in 10% DMSO/FBS at a concentration of approximately 1−2× 10⁷ cells/ml as described above. For the 24 hour time point, unprocessed venipuncture tubes were shipped overnight at ambient temperature and whole blood was processed the following day using Accuspin™ tubes as described in the previous section.
For CPT™ tubes, whole blood was collected directly into the venipuncture tubes, which were centrifuged at 2600 RPM (1800 g) for 20 minutes, as described by the manufacturer (BD). The PBMC at the plasma interface were collected and washed with HBSS two times by centrifugation at 1500 rpm (500 g) for 15 minutes at RT. The cells were counted using a Guava cell counter, and then cryopreserved in 10% DMSO/FBS at a concentration of approximately 1.5−2.0 × 10⁷ cells/ml. The tubes were centrifuged as outlined above, resuspended in the CPT™ tube (in plasma), and then shipped overnight at ambient temperature to FHCRC for cryopreservation in 10% DMSO/FBS the following day.
2.3 Peptides
PBMC from all HIV-seronegative immunocompetent volunteers were assessed for responses to a pool of thirty-two 8-10-mer peptides (Anaspec Inc, San Jose, CA) representing immunodominant CD8+ T cell epitopes within cytomegalovirus (CMV), Epstein-Barr virus and influenza, designated the CEF pool. This peptide pool, expanded from the original CEF pool previously described by Currier et al (Currier et al., 2002), is recognized by T cells of approximately 70% of the U.S. population. In addition, PBMC were assessed for T cell responses recognizing CMV 15-mer peptides overlapping by 11 amino acids and spanning the entire pp65 protein (kindly provided by the National Institutes of Health, Bethesda, MD). The CMV-only peptides were combined into a single pool of 138 peptides.
2.4 IFNγ ELISpot Assay
The IFN-γ ELISpot kit (BD) was used according to the manufacturer's directions. PBMC were thawed in R10 [RPMI 1640 supplemented with 10% FBS, 2 mM L-glutamine, 25 mM HEPES (N-2-hydroxyethylpiperazine-N'-2-ethanesulfonic acid) buffer, 50 μg/ml streptomycin, 50 U/ml penicillin containing 50U/ml benzonase (Novagen, Madison, WI)], and then washed and rested overnight in R10 at 37°C, 5% CO2 before assay. PBMC were plated at 2 × 10⁵ cells/well. Peptides were added to the wells at a final concentration of 1 μg/ml for overnight stimulation. Wells containing media alone served as negative controls, and those containing 1 μg/ml phytohemagglutinin (PHA)-P (Murex, distributed by Remel, Lenexa, KS) served as positive controls. Negative controls were tested in six replicate wells, whereas peptide antigens and PHA were tested in triplicate wells. Spots were counted using a CTL Analyzer and software version 2.8 (CTL Analyzers LLC, Cleveland, OH). Positive responses were defined as experimental wells that on average had twice the number of spot forming cells (SFC) than the control wells, with at least 50 SFC/106 PBMC in the experimental wells. Responders to CEF or CMV peptide were defined as strong (> 1,000 SFC per 1 × 10⁶ cells), intermediate (200-1,000 SFC per 1 × 10⁶ cells), and weak (<200 SFC per 1 × 10⁶ cells) as described (Beattie et al., 2004).
2.5 Intracellular cytokine staining (ICS) assay for IFN-γ
Cryopreserved PBMC were thawed, washed and rested overnight as outlined for the ELISpot assay. The IFN-γ Cytokine Flow Cytometry kit (BDIS) was used following the manufacturer's guidelines. PBMC were incubated for six hours with either Staphylococcal enterotoxin B (SEB; 1 μg/ml, Sigma) as a positive control, CEF or CMV pooled peptides (1 μg/ml each peptide/sample) as viral antigens, or no peptide as a negative control, in the presence of Brefeldin A. Cells were treated with EDTA and FACslyse before freezing at −70°C. Frozen, stimulated cells were thawed and stained simultaneously with anti-CD3-APC, anti-CD8-PerCP, anti-IFN-γ-FITC (intracellular) and anti-CD69-PE, using the manufacturer's guidelines, before fixation with 1% paraformaldehyde in PBS. Although the focus of our study was on CD8+ T cell responses, the CD3+ CD8-responses were evaluated in some studies to estimate the CD4+ T cell response. Data acquisition was performed on a FACsCalibur flow cytometer (BD), collecting 100,000-200,000 lymphocyte-gated events per sample, and data was analyzed with Flowjo® software (Tree Star Inc., Ashland, OR). Responses were designated positive when the percentage of bright IFN-γ/CD69-staining T cells was twice that of the negative control.
2.6 Statistical methods
Non-parametric Wilcoxon signed-rank test was used in each of the studies to compare the recovery, viability and in vitro immune function within a processing method (Ficoll, Accuspin™, CPT™), among the anticoagulants used (ACD, EDTA, Heparin) and between the two time points (eight vs. 24 hours) of PBMC processing and cryopreservation. Where appropriate (within a study), comparisons were made among processing methods with respect to anticoagulant, processing time and shipping methods for recovery, viability, and performance in immune assays (studies #2-4). The authors did not make statistical comparisons among the different studies, although to facilitate explanation of findings some of the data is displayed together (e.g., Figure 3 and 4). The Statistical Analysis Software (SAS; Cary, North Carolina) Version 8.2 was utilized for all analyses.
Figure 3.
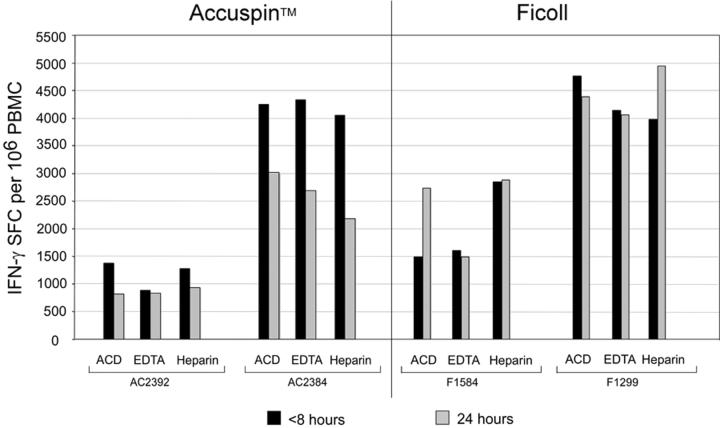
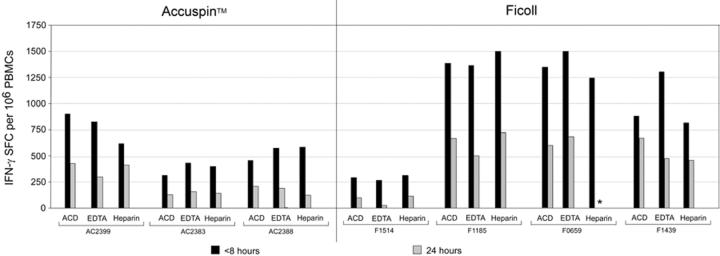
CMV-specific T cell responses detected by IFN-γ ELISpot in 11 representative donors, stratified by high (A) and low to intermediate (B) IFN-γ SFC frequencies. Blood was taken with one of three anticoagulants (ACD, EDTA, Heparin), and PBMC were isolated by Ficoll centrifugation or with Accuspin tubes. Cryopreservation of PBMC occurred within 8 or 24 hours of venipuncture, as indicated. Data shown are background subtracted. *Sample not available.
Figure 4.
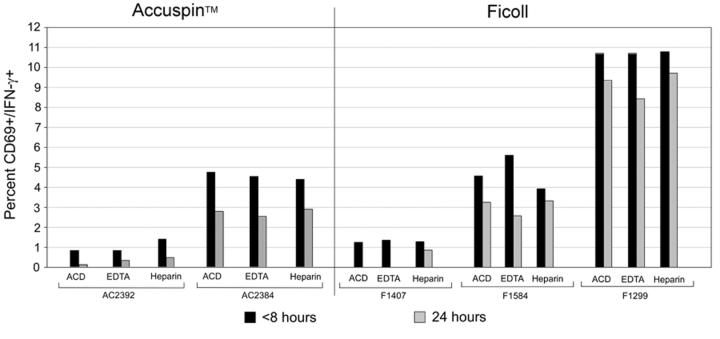
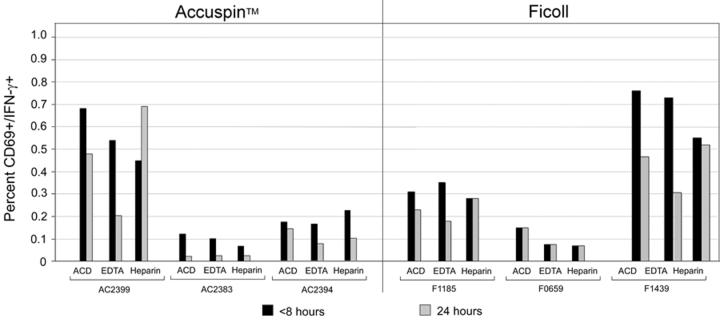
Functional activity of PBMC isolated at different time points, in different anticoagulants and by different isolation methods as measured by intracellular cytokine staining (ICS). A) Responses from individuals with strong, and B) weak and intermediate responses to CMV peptide are graphed according to isolation method. Data are gated on CD3+ CD8+ lymphocytes.
3. Results
3.1 Freezing media, anticoagulant and PBMC isolation method do not have an impact on cell recovery/viability
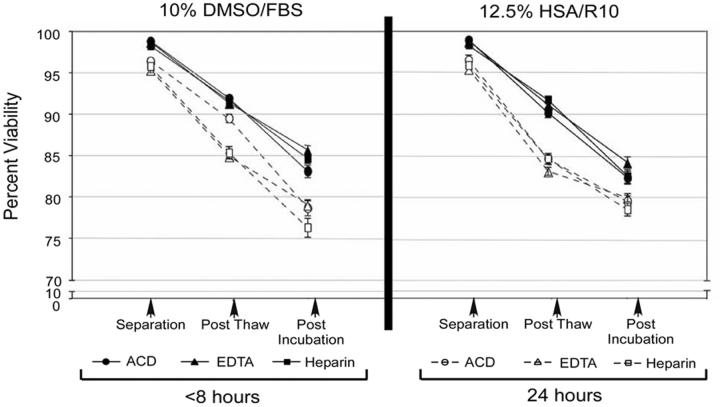
The composition of cryopreservation media can vary among different laboratories. We first examined in Study #1 (Figure 1) the influence of two commonly used cryopreservants: 10% DMSO in FBS and 10% DMSO/12.5% human serum albumin in RPMI, on PBMC recovery and viability after cryopreservation. Whole blood was drawn from ten donors into ACD, EDTA, or heparin; and PBMC were isolated within either eight or 24 hours of venipuncture. The percent viability and recovery were assessed after PBMC thawing and overnight incubation at 37°C. The two types of freezing media performed similarly in these studies (Figure 2), and overall had no significant effect on viability or recovery, regardless of the anticoagulant used for blood collection (Figure 2).
Figure 2.
Comparison of different cryopreservation media on percent viability of PBMC. Blood was anticoagulated with either ACD, EDTA, or Heparin. PBMC were isolated within 8 or 24 hours using Ficoll density centrifugation, and then cryopreserved in either 10% DMSO/FBS (left panel) or 10%DMSO/12.5% HSA in RPMI (right panel). Percent viability of PBMC in different cryopreservation media was calculated using the Guava counter immediately after fresh isolation, after thawing cryopreserved PBMC, and after overnight incubation at 37°C of thawed PBMC. Filled shapes represent PBMC isolated within 8 hours, open shapes indicate PBMC isolated within 24 hours. Symbols denote type of blood anticoagulant: ● ACD; ▲ EDTA; ■Heparin. Error bars represent the standard error of the mean for the percent viability.
We next examined the effect of early (within eight hours) vs. delayed (24 hours) PBMC isolation and cryopreservation on cell viability and recovery after thawing (Table 1, Figure 2). This investigation was conducted on PBMC from 18 donors (Study 1 and 2, Figure 1). When PBMC were cryopreserved within eight hours, the median viability was 94% or greater, regardless of type of anticoagulant or method of PBMC isolation. By contrast, viability was reduced significantly (median ranges, 85.7-91.8%) when processing was delayed to 24 hours, with the exception of PBMC that derived from blood with heparin anticoagulant and isolated with Ficoll (Table 1). A decrease in PBMC recovery occurred in blood shipped overnight as opposed to samples processed within eight hours, but this trend was not consistently significant (Table 1). Within a time point (eight hours or 24 hours), the anticoagulant used had no significant effect on PBMC recovery and viability (Table 1). Moreover, no significant differences in viability and recovery were noted comparing three methods for PBMC isolation: traditional Ficoll-hypaque centrifugation, Accuspin™ tubes, and CPT™tubes. These data suggest that time from venipuncture to PBMC cryopreservation, rather than type of cryopreservation media or anticoagulant, is the most important factor in optimizing PBMC recovery and viability.
Table 1.
Effect of anticoagulant and processing methods on percent viability and recovery of cryopreserved PBMC.
| 8 vs. 24 hours PBMC cryopreservation time Median (P-value) |
|||
|---|---|---|---|
| ACD | EDTA | Heparin | |
| VIABILITY (%)1 | |||
| Ficoll (n=8) | 96.7 vs. 91.6 (P=0.008) 2 |
96.2 vs. 86.6 (P=0.008) |
96.0 vs. 91.8 (P=0.2) |
| Accuspin tubes (n=10) | 94.1 vs. 86.4 (P=0.002) |
94.5 vs. 84.6 (P=0.002) |
93.6 vs. 87.5 (P=0.002) |
| CPT tubes | 94.5 vs. 89.3 (P=0.02) |
ND3 | 94.7 vs. 85.7 (P=0.002) |
| PBMC RECOVERY (106 per ml) | |||
| Ficoll | 12.8 vs. 9.2 (P=0.6)2 |
14.0 vs. 8.9 (P=0.4) |
12.4 vs. 8.0 (P=0.5) |
| Accuspin tubes | 9.4 vs. 6.3 (P=0.06) |
11.1 vs. 6.2 (P=0.049) |
9.7 vs. 7.1 (P=0.006) |
| CPT tubes | 8.2 vs. 7.1 (P=0.6) |
ND | 9.0 vs. 7.2 (P=0.6) |
Comparison of PBMC cryopreserved within 8 vs. 24 hours. Shown are values from blood collected into different anticoagulants (ACD, EDTA, Heparin) and processed by different PBMC isolation methods (Ficoll, Accuspin™ tubes, CPT™ tubes). Measurements were taken after thawing and overnight incubation.
P values obtained using the Wilcoxon signed rank test.
ND, not done.
3.2 Frequencies of IFN-γ-secreting T cells are reduced in PBMC isolated after overnight shipment than when immediately processed
We next examined the functional activity of PBMC from blood obtained with different anticoagulants, isolated by different methods and at different time points from venipuncture (Figures 3 and 4). PBMC were stimulated ex vivo with or without CEF peptides and CMV pp65 overlapping 15-mers, and the frequency of IFN-γ-secreting cells was measured by ELISpot. Levels of non-specific IFN-γ secretion in the absence of peptides were consistently low (<50 SFC/106PBMC) (data not shown). With a few exceptions, delayed PBMC processing and cryopreservation caused significant reductions in IFN-γ SFC frequencies particularly in low responders (<1,000 SFC/106 PBMC) (Table 3). When we stratified responses by high (Figure 3A), intermediate and low (Figure 3B) frequencies, we observed reductions in antigen-specific T cell responses in nearly all donors with low or intermediate SFC responses (Figure 3B). Importantly, the impact of delayed cryopreservation was obvious regardless of type of anticoagulant (Table 2), and in some cases exceeded a two-fold reduction in SFC frequencies. Of note, the reductions were not always significant when Heparin was used (Table 2), while specimens collected into EDTA tended to have the largest percent decrease in response. In summary, T cell function assessed by antigen-specific IFN-γ secretion was not significantly different when various anticoagulants or isolation techniques were employed. However, significantly higher responses were obtained when PBMC were processed and cryopreserved within eight hours compared to 24 hours.
Table 3.
Comparison of different shipping methods on percent recovery and viability of cryopreserved PBMC.
| Measurement | Shipping Methods1 |
Median % (P-value) | |
|---|---|---|---|
| Accuspin™ | Ficoll | ||
| % PBMC Recovery |
LN vs. DI | 88.3 vs. 84.9 (P=0.03) |
92.3 vs. 87.5 (P=0.01) |
| LN vs. −70°C 3WK | 88.3 vs. 88.8 (P=0.2) |
92.3 vs. 80.0 (P=0.009) |
|
| DI vs. −70°C 3WK | 84.9 vs. 88.8 (P=0.1) |
87.5 vs. 80.0 (P=0.1) |
|
| % PBMC Viability |
LN vs DI | 93.3 vs. 92.0 (P=0.02) |
93.8 vs. 91.4 (P=0.01) |
| LN vs. −70 °C 3WK | 93.3 vs. 90.2 (P=0.08) |
93.8 vs. 90.6 (P=0.001) |
|
| DI vs. −70 °C 3WK | 92.0 vs. 90.2 (P=0.3) |
91.4 vs. 90.6 (P=0.01) |
|
Shipped on liquid nitrogen after 24 hour at −70°C (LN); shipped on dry Ice after 24 hours at −70°C (DI); shipped on dry ice after 3 weeks of storage at −70°C (70°C 3 Wk). Sodium heparin was used to anticoagulate the blood. Measurements were taken after thawing and overnight incubation of PBMC at 37°C. P value was calculated using Wilcoxon Sign rank test.
Table 2.
Effect of anticoagulant and processing methods on T cell function measured in the IFN-γ ELISpot assay.
| PBMC isolation method | 8 vs. 24 hour cryopreservation time Median SFC per 106 PBMC (P-value) |
|||
|---|---|---|---|---|
| ACD | EDTA | Heparin | ||
| Ficoll | CEF | 1015 vs. 613.5 (P=0.02)2 |
1069 vs.401 (P=0.008) |
1240 vs. 893.5 (P=0.84) |
| CMV | 1114 vs. 633.5 (P=0.008) |
1335 vs. 486 (P=0.008) |
1034 vs. 691.5 (P=0.3) |
|
| Accuspin | CEF | 140 vs. 71.5 (P=0.002) |
147.5 vs. 56 (P=0.004) |
186 vs. 108.5 (P=0.1) |
| CMV | 337.5 vs. 119 (P=0.006) |
368.5 vs. 159 (P=0.002) |
361.5 vs. 137.5 (P=0.006) |
|
| CPT | CEF | 330 vs. 121.5 (P=0.1) |
ND3 | 196.5 vs. 97.5 (P=0.002) |
| CMV | 433.5 vs. 227.5 (P=0.1) |
ND | 320 vs. 156.5 (P=0.1) |
|
Data from Study 1 (n=8 donors) and Study 2 (n=10 donors).
Statistics representing the median and ranges comparing the different anticoagulants within a single PBMC processing method. Values in parentheses represent the p values obtained using the Wilcoxon signed rank test. Ficoll has higher values due in part to selection for high responders to the CEF and CMV peptide pools for that study.
ND, not done.
We also evaluated these parameters on the detection of IFN-γ-secreting cells by ICS using flow cytometry (Figure 4). Similar to our observations with the IFN-γ ELISpot assay, a decrease in the percent IFN-γ positive cells was noted by ICS when PBMC were processed at 24 hours compared with those isolated at eight hours (Figure 4). For PBMC isolated using the Accuspin™ tubes, CEF- and CMV-specific responses decreased after blood was shipped overnight for all anticoagulants, compared to those processed on-site within eight hours (ACD, p= 0.0547; EDTA, p=0.0273; and Heparin, p= 0.0078). However, when the CPT™ tubes were used, these differences did not reach statistical significance (data not shown) for any of the comparisons between processing at eight vs. 24 hours. Of note, reductions were noted in the majority of donors who were high (Figure 4A), intermediate or low responders (Figure 4B). The CD4+ T cell populations were evaluated by gating on CD3+CD8- population. In this analysis the CD3+ CD8-(CD4+) responses were markedly lost when PBMC were processed after overnight shipment compared with being processed within eight hours in six of seven volunteers examined (data not shown).
3.3 Comparison of specimen collection and processing methods at four clinical sites
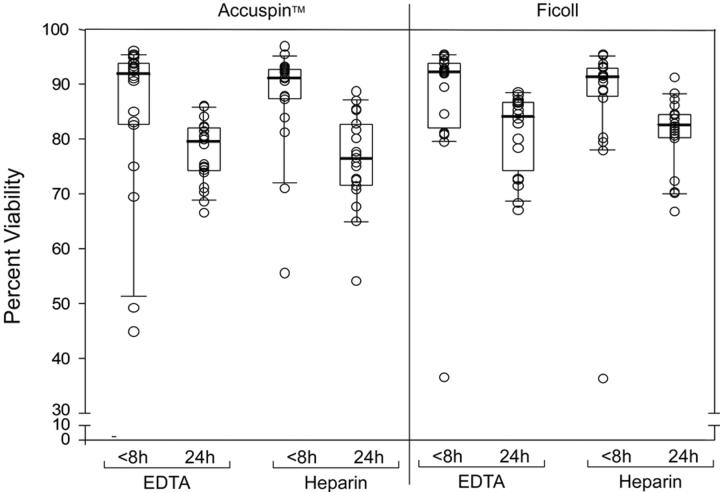
We next assessed the specimen collection and processing parameters in conjunction with four clinical HIV vaccine units, which simulates activities within a clinical trial (Study 3, Figure 1). We evaluated recovery, viability and function of PBMC processed at the clinic laboratory in comparison with PBMC obtained from blood shipped overnight to a central repository for blood processing. Five donors were selected at each of the four sites for the study, and the experimental studies were performed in a single laboratory (FHCRC). Similar to the previous observations, PBMC cryopreserved within 24 hours showed a significant decrease in recovery (data not shown) and viability (Figure 5), compared to those isolated within eight hours. Unfortunately, 11 of the 20 donors lacked CMV-specific responses regardless of method of specimen collection and processing. Low donor responses, coupled with poor viability in two donors' PBMC from a single site, precluded statistical analysis of potential differences in T cell function. Of note, no explanation for the poor specimen quality from these two donors was found. .
Figure 5.
Comparison of % PBMC viability from donors at four sites processed either with Accuspin tubes (left panel) or Ficoll centrifugation (right panel). Box plots represent quartiles, dark bar represent the median, and whiskers represent 95% and 5% values for the group. Responses are shown with use of different anticoagulants (EDTA or heparin) and within 8 and 24 hours of cryopreservation.
3.4 Methods to ship cryopreserved PBMC to a central specimen repository
Our data above indicate that to optimize cell recovery, viability and function, PBMC should be processed and cryopreserved within eight hours of venipuncture. This poses major logistical and fiscal considerations in shipping samples in the appropriate timeframe from venipuncture to a central immunology laboratory qualified to perform such assays. Therefore, a final study was designed to determine acceptable methods of shipping cryopreserved PBMC that retain their viability and immunological function. In this study, whole blood was collected from 12 donors into ACD or Heparin anticoagulants: PBMC were isolated, using either Ficoll or Accuspin™ processing methods within eight hours of venipuncture, and then placed at −70° C for at least 24 hours regardless of shipping method. Samples were then shipped by one of three different methods: 1) on liquid nitrogen vapor (LN), 2) on dry ice (DI), or 3) on dry ice after storage at −70°C for three weeks (−70°C 3 WK).
The three shipping methods resulted in differences in PBMC viability and recovery, but generally no significant differences in T cell function were seen (Tables 3 and 4, Figure 6). Overall, there was a high median percentage of PBMC recovery (≥80%) and viability (90-93%) regardless of shipping method employed. This was the case with the use of either Accuspin™ or Ficoll isolation methods and ACD or Heparin anticoagulants (Table 4 and data not shown). While statistically significant differences were noted in some comparisons (Table 3), the differences were small; and, in general, it is unlikely that these differences were biologically meaningful.
Table 4.
Comparison of different shipping methods on antigen-specific IFN-γ-secreting T cell responses.
| Shipping Methods1 | Median SFC per 106 PBMC (P-value)2 | |
|---|---|---|
| CEF | CMV | |
| LN vs DI | 470 vs. 310 (P=1.0) |
540 vs. 665 (P=0.3) |
| LN vs. −70 °C 3WK | 470 vs. 260 (P=0.2) |
540 vs. 640 (P=1.0) |
| DI vs. −70 °C 3WK | 310 vs. 260 (P=0.8) |
665 vs. 640 (P=0.6) |
PBMC were isolated from sodium heparin anticoagulated blood using Accuspin™ tubes. They were shipped on liquid nitrogen after 24 hours at − 70°C (LN), or shipped on dry Ice after 24 hours at −70°C (DI), or shipped on dry ice after storage for 3 weeks at −70°C (−70 °C 3 Wk).
IFN-γ-secreting T cells were detected by ELISpot assay. Statistics represent the median ELISpot response from PBMC collected into Heparin, processed using Accuspin™ tubes, with different shipping methods compared. P values were calculated using the Wilcoxon signed rank test.
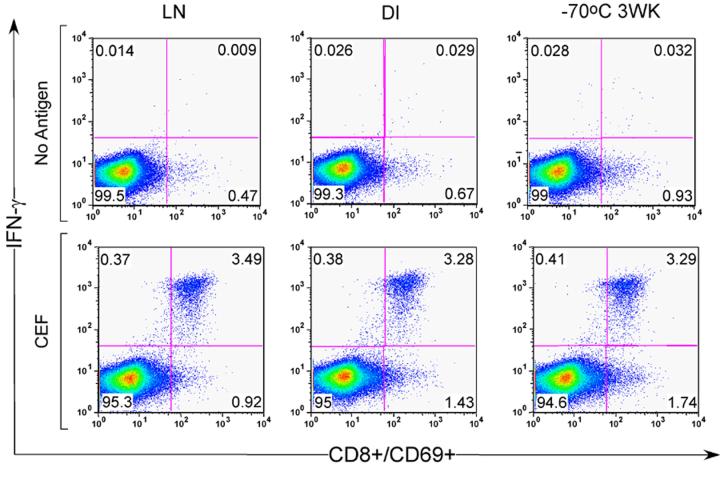
Figure 6.
Representative dot plots of ICS data from cryopreserved PBMC shipped using 3 different methods: shipped on liquid nitrogen after 24 hr at −70°C (LN), shipped on dry ice after 24 hr at −70°C (DI) or shipped on dry ice after 3 weeks at −70°C (−70 3 WK). Top row shows data from un-stimulated cultures. Bottom row shows data from PBMC stimulated with CEF peptide for 8 hr. Data are gated on CD3+ CD8+ lymphocytes. Examination of CD3+CD8- population as a surrogate for CD4+ cells demonstrated no difference in IFN-γ production between the three freezing methods (data not shown).
Next, we examined the effect of shipping method on IFN-γ secreting T cell responses following CEF and CMV peptide stimulation using the ELISpot and ICS assays. The background SFC frequencies were overall very low, and no differences were observed in comparing the median levels by shipping method (data not shown). Cryopreserved PBMC shipped using LN, DI or −70 3WK methods appeared to perform equally well in the ELISpot assay (Table 4), despite the relative differences in cell recovery and viability described above (Table 3). Notably, the LN method yielded the highest median IFN-γ response frequencies with the CEF stimulation, but the lowest frequencies with the CMV stimulation (Table 4). The positive and negative response designations were concordant across the three shipping methods.
The methods of shipping had little impact on the percentage of IFN-γ-producing T cells detected by ICS (Figure 6, representative example). Examining T cell responses to CEF, CMV and SEB and normalizing responses to those PBMC that were taken from −70°C and placed directly into LN after 24 hours, no apparent differences were noted in the % CD3+CD8+ and CD3+ CD8-CD69+ IFN-γ+ gated cells (data not shown) among the different shipping methods. In nine positive CEF responders, PBMC retained on average > 85% of the response observed with the specimens stored in LN. This was true for all the shipping methods, regardless of whether the blood was collected into ACD or Heparin, with the exception of responses from two donor specimens. Thus, the different shipping methods had little impact on the immunological responses observed in endpoint assays routinely used in HIV vaccine trials to assess T cell responses.
4. Discussion
Our findings consistently demonstrate that optimal recovery, viability and function of cryopreserved PBMC for determining antigen-specific immunity using state-of-the-art assays require isolation and cryopreservation within eight hours of venipuncture. Of note, we arbitrarily chose eight hours as our earliest time point for blood processing and PBMC cryopreservation since this is a time interval that can be feasibly implemented in the clinical field setting. However, we recognize that superior PBMC recovery, viability and function may be achieved if the time interval is shorter than eight hours. Nevertheless, our data show that overnight shipping of blood for next day PBMC processing and cryopreservation can significantly impair PBMC function, with loss of up to twofold response frequencies of IFN-γ-secreting PBMC in the ELISpot assay. Such a reduction in the observed antigen-specific T cell response can have a profound impact in the clinical vaccine trials setting, especially since the frequency of vaccine-induced T cell responses is generally less than what is observed during natural infection (Nanan et al., 2000; Russell et al., 2003; Beattie et al., 2004).
Transit time and temperature changes that occur when shipping samples by courier can contribute to the decrease in cell viability and recovery. Specimen quality can conceivably vary by shipping courier. Of note, differences among couriers and factors associated with shipping were not specifically examined in these studies.
When cryopreserved within eight hours of venipuncture, PBMC recovery, viability and function were not significantly affected by the type of blood anticoagulant and method of PBMC isolation employed. This should permit use of anticoagulants that are less problematic in some molecular assays than others (ACD vs. Heparin). However, if EDTA is used as anticoagulant, PBMC must be processed quickly since cells from blood collected in EDTA in particular performed poorly after overnight shipment. The method of PBMC isolation (Ficoll, Accuspin™ tube, CPT™ tube) did not seem to have a large impact on the recovery, viability or functionality of the cells. No significant differences were seen in recovery, viability or performance in the ELISpot or ICS assays in direct comparisons of Accuspin™ vs. CPT tubes or Accuspin™ vs. Ficoll. The data collected did not allow for the direct comparison of Ficoll vs. CPT™. In addition, either of the two cryopreservants used here, 10% DMSO in FBS and 12.5% human serum albumin in R10, can be employed with similar cell recovery and viability.
Several recent works demonstrate that different responses observed in ELISpot and ICS assays are affected by a variety of assay parameters (Russell et al., 2003; Beattie et al., 2004; Betts et al., 2004). Betts reported that antigen concentration could affect the outcome of ICS assays and measurements of cellular cytotoxicity (Betts et al., 2004). Similar to trends observed here, Beattie et al., found that samples from weak and intermediate responders were affected differently by assay parameters. The weak and intermediate responders tended to have higher frequencies in ELISpot assays when an optimal epitope peptide was utilized in the assay. However, we note that 15% of the responses detected by their assay were from 15 mers that did not contain previously identified epitopes, and therefore would have been missed by the optimal epitopes (Beattie et al., 2004). Use of the CEF and CMV pp65 peptide pools here permitted investigation of both CD8+ T cell responses to optimal epitopes (CEF) as well as CD8+ and CD4+ T cell responses to defined and heretofore undefined epitopes (CMV pp65).
Immediate blood processing and PBMC cryopreservation requires cold storage of PBMC until transfer to a central laboratory or repository. The three shipping methods tested here were ones that were suitable in the international vaccine clinical sites. Our findings indicate that any of the three methods is adequate for maintaining T cell function measured by IFN-γ secretion in ELISpot and ICS assays. Although not formally tested in this study, we noted in smaller studies that unless the thawing step is underway, shifting PBMC to higher temperatures once they are stored in LN should be avoided. This includes transferring cells from -180°C to -70°C, or slow handling of vials as they are transferred from one container to the next.
In conclusion, our data suggest that the length of time from venipuncture to cryopreservation is the single most important parameter influencing performance of T cells in cellular immune assays. We recommend that PBMC for use in cellular functional immunoassays be isolated and cryopreserved as soon as possible within eight hours of draw for optimal performance. Clinical trial sites must either be proficient at PBMC isolation and cryopreservation, or be close to contract laboratories that can perform these procedures. Every attempt should be made to limit the loss in CD8+ T cell responses of candidate vaccines, while maintaining a high throughput assay. Therefore, rigorous quality assurance (QA) / quality control (QC) in all laboratories involved in PBMC isolation and cryopreservation is crucial to uniform processing of specimens.
Acknowledgements
We thank Jon Hallstrom, Cassandra Beckham, Judy Gordan, Justin Penn and Ruth Baydo for technical support, Mark Deers for data management, Phyllis Stegall for technical editing, Jon Newman for assistance in shipping for all studies, and the site investigators (Drs. Geoff Gorse, Michael Keefer and Paul Goepfert) for implementation of Study 3.
Footnotes
Publisher's Disclaimer: This is a PDF file of an unedited manuscript that has been accepted for publication. As a service to our customers we are providing this early version of the manuscript. The manuscript will undergo copyediting, typesetting, and review of the resulting proof before it is published in its final citable form. Please note that during the production process errors may be discovered which could affect the content, and all legal disclaimers that apply to the journal pertain.
References
- Bach MK, Brashler JR. Isolation of subpopulations of lymphocytic cells by the use of isotonically balanced solutions of Ficoll. I. Development of methods and demonstration of the existence of a large but finite number of subpopulations. Exp Cell Res. 1970;61:387–96. doi: 10.1016/0014-4827(70)90462-3. [DOI] [PubMed] [Google Scholar]
- Beattie T, Kaul R, Rostron T, Dong T, Easterbrook P, Jaoko W, Kimani J, Plummer F, McMichael A, Rowland-Jones S. Screening for HIV-specific T-cell responses using overlapping 15-mer peptide pools or optimized epitopes. Aids. 2004;18:1595–8. doi: 10.1097/01.aids.0000131362.82951.b2. [DOI] [PubMed] [Google Scholar]
- Betensky RA, Connick E, Devers J, Landay AL, Nokta M, Plaeger S, Rosenblatt H, Schmitz JL, Valentine F, Wara D, Weinberg A, Lederman HM. Shipment impairs lymphocyte proliferative responses to microbial antigens. Clin Diagn Lab Immunol. 2000;7:759–63. doi: 10.1128/cdli.7.5.759-763.2000. [DOI] [PMC free article] [PubMed] [Google Scholar]
- Betts MR, Price DA, Brenchley JM, Lore K, Guenaga FJ, Smed-Sorensen A, Ambrozak DR, Migueles SA, Connors M, Roederer M, Douek DC, Koup RA. The functional profile of primary human antiviral CD8+ T cell effector activity is dictated by cognate peptide concentration. J Immunol. 2004;172:6407–17. doi: 10.4049/jimmunol.172.10.6407. [DOI] [PubMed] [Google Scholar]
- Boyum A. Isolation of lymphocytes, granulocytes and macrophages. Scand J Immunol. 1976;(Suppl 5):9–15. [PubMed] [Google Scholar]
- Currier JR, Kuta EG, Turk E, Earhart LB, Loomis-Price L, Janetzki S, Ferrari G, Birx DL, Cox JH. A panel of MHC class I restricted viral peptides for use as a quality control for vaccine trial ELISPOT assays. J Immunol Methods. 2002;260:157–72. doi: 10.1016/s0022-1759(01)00535-x. [DOI] [PubMed] [Google Scholar]
- Hilleman MR. Vaccines in historic evolution and perspective: a narrative of vaccine discoveries. Vaccine. 2000;18:1436–47. doi: 10.1016/s0264-410x(99)00434-x. [DOI] [PubMed] [Google Scholar]
- Hudgens MG, Self SG, Chiu YL, Russell ND, Horton H, McElrath MJ. Statistical considerations for the design and analysis of the ELISpot assay in HIV-1 vaccine trials. J Immunol Methods. 2004;288:19–34. doi: 10.1016/j.jim.2004.01.018. [DOI] [PubMed] [Google Scholar]
- Jin X, Bauer DE, Tuttleton SE, Lewin S, Gettie A, Blanchard J, Irwin CE, Safrit JT, Mittler J, Weinberger L, Kostrikis LG, Zhang L, Perelson AS, Ho DD. Dramatic rise in plasma viremia after CD8(+) T cell depletion in simian immunodeficiency virus-infected macaques. J Exp Med. 1999;189:991–8. doi: 10.1084/jem.189.6.991. [DOI] [PMC free article] [PubMed] [Google Scholar]
- Koup RA, Safrit JT, Cao Y, Andrews CA, McLeod G, Borkowsky W, Farthing C, Ho DD. Temporal association of cellular immune responses with the initial control of viremia in primary human immunodeficiency virus type 1 syndrome. J Virol. 1994;68:4650–5. doi: 10.1128/jvi.68.7.4650-4655.1994. [DOI] [PMC free article] [PubMed] [Google Scholar]
- Kumar A, Weiss W, Tine JA, Hoffman SL, Rogers WO. ELISPOT assay for detection of peptide specific interferon-gamma secreting cells in rhesus macaques. J Immunol Methods. 2001;247:49–60. doi: 10.1016/s0022-1759(00)00310-0. [DOI] [PubMed] [Google Scholar]
- Kumar P, Satchidanandam V. Ethyleneglycol-bis-(beta-aminoethylether)tetraacetate as a blood anticoagulant: preservation of antigen-presenting cell function and antigen-specific proliferative response of peripheral blood mononuclear cells from stored blood. Clin Diagn Lab Immunol. 2000;7:578–83. doi: 10.1128/cdli.7.4.578-583.2000. [DOI] [PMC free article] [PubMed] [Google Scholar]
- Maecker HT, Rinfret A, D'Souza P, Darden J, Roig E, Landry C, Hayes P, Birungi J, Anzala O, Garcia M, Harari A, Frank I, Baydo R, Baker M, Holbrook J, Ottinger J, Lamoreaux L, Epling CL, Sinclair E, Suni MA, Punt K, Calarota S, El-Bahi S, Alter G, Maila H, Kuta E, Cox J, Gray C, Altfeld M, Nougarede N, Boyer J, Tussey L, Tobery T, Bredt B, Roederer M, Koup R, Maino VC, Weinhold K, Pantaleo G, Gilmour J, Horton H, Sekaly RP. Standardization of cytokine flow cytometry assays. BMC Immunol. 2005;6:13. doi: 10.1186/1471-2172-6-13. [DOI] [PMC free article] [PubMed] [Google Scholar]
- Matano T, Shibata R, Siemon C, Connors M, Lane HC, Martin MA. Administration of an anti-CD8 monoclonal antibody interferes with the clearance of chimeric simian/human immunodeficiency virus during primary infections of rhesus macaques. J Virol. 1998;72:164–9. doi: 10.1128/jvi.72.1.164-169.1998. [DOI] [PMC free article] [PubMed] [Google Scholar]
- McCutcheon M, Wehner N, Wensky A, Kushner M, Doan S, Hsiao L, Calabresi P, Ha T, Tran TV, Tate KM, Winkelhake J, Spack EG. A sensitive ELISPOT assay to detect low-frequency human T lymphocytes. J Immunol Methods. 1997;210:149–66. doi: 10.1016/s0022-1759(97)00182-8. [DOI] [PubMed] [Google Scholar]
- Nanan R, Rauch A, Kampgen E, Niewiesk S, Kreth HW. A novel sensitive approach for frequency analysis of measles virus-specific memory T-lymphocytes in healthy adults with a childhood history of natural measles. J Gen Virol. 2000;81:1313–9. doi: 10.1099/0022-1317-81-5-1313. [DOI] [PubMed] [Google Scholar]
- Nicholson JK, Green TA. Selection of anticoagulants for lymphocyte immunophenotyping. Effect of specimen age on results. J Immunol Methods. 1993;165:31–5. doi: 10.1016/0022-1759(93)90103-e. [DOI] [PubMed] [Google Scholar]
- Nicholson JK, Jones BM, Cross GD, McDougal JS. Comparison of T and B cell analyses on fresh and aged blood. J Immunol Methods. 1984;73:29–40. doi: 10.1016/0022-1759(84)90028-0. [DOI] [PubMed] [Google Scholar]
- Russell ND, Hudgens MG, Ha R, Havenar-Daughton C, McElrath MJ. Moving to human immunodeficiency virus type 1 vaccine efficacy trials: defining T cell responses as potential correlates of immunity. J Infect Dis. 2003;187:226–42. doi: 10.1086/367702. [DOI] [PubMed] [Google Scholar]
- Scheibenbogen C, Romero P, Rivoltini L, Herr W, Schmittel A, Cerottini JC, Woelfel T, Eggermont AM, Keilholz U. Quantitation of antigen-reactive T cells in peripheral blood by IFNgamma-ELISPOT assay and chromium-release assay: a four-centre comparative trial. J Immunol Methods. 2000;244:81–9. doi: 10.1016/s0022-1759(00)00257-x. [DOI] [PubMed] [Google Scholar]
- Schmitz JE, Kuroda MJ, Santra S, Sasseville VG, Simon MA, Lifton MA, Racz P, Tenner-Racz K, Dalesandro M, Scallon BJ, Ghrayeb J, Forman MA, Montefiori DC, Rieber EP, Letvin NL, Reimann KA. Control of viremia in simian immunodeficiency virus infection by CD8+ lymphocytes. Science. 1999;283:857–60. doi: 10.1126/science.283.5403.857. [DOI] [PubMed] [Google Scholar]
- Self SG, Hudgens MG, Chiu YL, Rossini AJ. Statistical methods for evaluating ELISpot assays in HIV vaccine trials (Abstract) AIDS Vaccine 2001. 2001 [Google Scholar]
- Shalekoff S, Page-Shipp L, Tiemessen CT. Effects of anticoagulants and temperature on expression of activation markers CD11b and HLA-DR on human leukocytes. Clin Diagn Lab Immunol. 1998;5:695–702. doi: 10.1128/cdli.5.5.695-702.1998. [DOI] [PMC free article] [PubMed] [Google Scholar]
- Sun Y, Iglesias E, Samri A, Kamkamidze G, Decoville T, Carcelain G, Autran B. A systematic comparison of methods to measure HIV-1 specific CD8 T cells. J Immunol Methods. 2003;272:23–34. doi: 10.1016/s0022-1759(02)00328-9. [DOI] [PubMed] [Google Scholar]
- Weinberg A, Betensky RA, Zhang L, Ray G. Effect of shipment, storage, anticoagulant, and cell separation on lymphocyte proliferation assays for human immunodeficiency virus-infected patients. Clin Diagn Lab Immunol. 1998;5:804–7. doi: 10.1128/cdli.5.6.804-807.1998. [DOI] [PMC free article] [PubMed] [Google Scholar]
- Yasutomi Y, Reimann KA, Lord CI, Miller MD, Letvin NL. Simian immunodeficiency virus-specific CD8+ lymphocyte response in acutely infected rhesus monkeys. J Virol. 1993;67:1707–11. doi: 10.1128/jvi.67.3.1707-1711.1993. [DOI] [PMC free article] [PubMed] [Google Scholar]


