

Abstract
R. Ivry, R. M. Spencer, H. N. Zelaznik, and J. Diedrichsen (2002) have proposed a distinction between timed movements in which a temporal representation is part of the task goal (event timing) and those in which timing properties are emergent. The issue addressed in the present experiment was how timing in conditions conducive to emergent timing becomes established. According to what the authors term the transformation hypothesis, timing initially requires an event-based representation when the temporal goal is defined externally (e.g., by a metronome), but over the first few movement cycles, control processes become established that allow timing to become emergent. Different groups of participants (N = 84) executed either 1 timed interval, 4 timed intervals, or 2 timed intervals separated by a pause. They produced the intervals by either circle drawing, a task associated with emergent timing, or tapping, a task associated with event timing. Analyses of movement variability suggested that similar timing processes were used in the 2 tasks only during the 1st interval. Those results are consistent with the transformation hypothesis and lead to the inference that the transition from event-based control to emergent timing can occur rapidly during continuous movements.
Keywords: motor performance, tapping, timing, timing variability
Many actions manifest precise timing. The musicians in an orchestra time their movements to the gestures of the conductor. The drag racer uses the countdown lights to anticipate the start of a race. A pitcher must temporally coordinate muscular activity across different joints to ensure that the ball is delivered to a targeted region of the strike zone. One basic question in motor control concerns how the timing of those different types of actions is controlled and whether a common process is invoked across different task domains so that such temporal precision can be achieved (see Keele & Ivry, 1987).
Recently, Zelaznik and colleagues (Ivry, Spencer, Zelaznik, & Diedrichsen, 2002; Spencer, Zelaznik, Diedrichsen, & Ivry, 2003; Zelaznik, Spencer, & Ivry, 2002) proposed that two qualitatively different control processes could be used for the timing of repetitive movements. When the periodic movements are marked by salient events, such as during finger tapping, control processes include a temporal representation of the target interval between those events. That form of control is referred to as event timing (Ivry et al.). On the other hand, when the movements are smooth and continuous, such as during continuous circle drawing, the ability to maintain a consistent rate does not require an explicit representation of the interval duration. Rather, Zelaznik and colleagues hypothesized that timing under such conditions emerges from the dynamics of trajectory control. Borrowing from the classic article of Turvey (1977), they refer to that form of control as emergent timing (Spencer et al.).
The initial motivation for the distinction between emergent and event timing came from studies of the correlations between measures of temporal variability on different types of movement tasks. Individual differences in timing variability during finger tapping were not correlated with individual differences in timing variability during circle drawing (Robertson et al., 1999). If a common timing process is invoked for both types of tasks, then performance on one task should be predictive of performance on the other task. The absence of correlation is consistent with the idea that individual differences in performance are task specific (Henry & Rogers, 1960; Lotter, 1961). In a subsequent study, however, Zelaznik et al. (2002) demonstrated significant correlations between tapping and circle drawing when participants were required to pause for one cycle interval between the completion of one circle and the initiation of the next. Most interesting, timing variability on the intermittent circle-drawing and on the tapping tasks did not correlate with timing variability on a continuous circle-drawing task. Thus, a common process is shared by the intermittent drawing and tapping tasks, one we assume reflects the need to maintain a representation of the temporal goal for movements that entail salient events. Those events are created by the imposed pauses in the intermittent drawing task; for tapping, they may be related to the intermittent tactile feedback or the natural pause that is typically observed before flexion onset.
Further support for the distinction between emergent and event timing comes from studies involving patients with neurological disorders. Callosotomy patients’ hands remain temporally coupled when they tap bimanually, yet the two hands become temporally uncoupled when they draw continuous circles (Kennerley, Diedrichsen, Hazeltine, Semjen, & Ivry, 2002). We attribute the lack of coupling on the circle-drawing task as indicative that performance on that task is based on reference to spatial codes of the desired trajectory; various lines of evidence indicate that the split-brain procedure eliminates interhemispheric interactions of spatial codes (Franz, Ivry, & Helmuth, 1996; Ivry & Hazeltine, 1999). The persistent coupling on the tapping task is in accord with the hypothesis that the motor system combines the signals that indicate the explicit (i.e., event) timing of each tap to simplify control requirements and that the signals arise in subcortical structures (see Ivry & Richardson, 2002).
On the basis of previous work, we predicted that those timing signals would depend on the cerebellum. Consistent with that idea, patients with cerebellar lesions exhibited increased temporal variability during unimanual tapping and intermittent circle drawing. Moreover, those patients performed similarly to control participants on the continuous circle-drawing task or when making continuous flexion–extension movements of the index finger (Spencer et al., 2003). Thus, we believe that the cerebellum is selectively engaged during tasks requiring event timing (see also Spencer, Ivry, & Zelaznik, 2005).
In our comparisons of tapping and circle drawing, we have generally relied on a task in which participants initially synchronize movements to a metronome and then attempt to maintain that rate after the metronome is disengaged. In the analyses of that task, we have focused on performance during the continuation phase. One shortcoming of the task is that it does not afford the opportunity to study performance during the initial phase when control processes are being established. That shortcoming is particularly relevant for tasks in which timing is emergent. As just noted, we hypothesize that the control processes for those tasks do not involve an explicit representation of cycle duration. However, people are quite competent at setting their movement rate to match the pace of a metronome. How do they achieve that feat if cycle duration is not represented?
One hypothesis is that a transformation from event to emergent timing is required when the movement period is externally defined. According to that view, the metronome signals define a temporal goal, or what we refer to as an event-timing representation. We hypothesize that participants adopt a particular dynamical state that achieves that goal—for example, an angular movement velocity that completes the circle in the target interval. Fine-tuning may be required so that the dynamics can be adjusted on the basis of subsequent comparisons of hand position and the metronome. Once established, that form of control no longer requires a temporal representation of the initial temporal goal; maintaining task dynamics would be sufficient.
That control strategy, on the surface, appears very difficult, perhaps impossible, in an intermittent circle-drawing task. However, the inclusion of a pause within each cycle mandates that the dynamics vary in a discontinuous manner. That is, matching the target duration requires the performer to account for both the movement duration and the pause duration. Under that condition, the performer uses the metronome to mark the onset of each cycle (as instructed) or instead to establish the timing between that salient event from cycle to cycle.
Now consider the situation in which a performer uses a metronome to define the target cycle duration, but movement onset is delayed until after the metronome is turned off—for example, a condition in which the participant hears a series of evenly spaced tones and then, after a brief delay, is required to move at the specified rate. For an event-timing task such as finger tapping, the metronome would define the temporal goal and the participant would use an internal representation of that goal to control subsequent movements. For an emergent-timing task such as circle drawing, the participant cannot compare the result of the initial setting of task dynamics with the metronome for fine-tuning. Rather, it seems reasonable to assume that the comparison requires an internal representation of the temporal goal. Over time, however, the temporal goal is not required because dynamics become stabilized.
To evaluate what we have termed the transition hypothesis, we examined temporal variability during the initiation of tapping and circle-drawing movements and assessed how that variability changes over a few subsequent intervals. In all conditions, a metronome initially indicated the target cycle duration. In the four group, participants were required to produce a series of four intervals, by either tapping or circle drawing. The transformation hypothesis led us to predict that variability during circle drawing would change over time, whereas variability during tapping would remain constant. In addition, we expected that variability on the first cycle would be correlated between the two tasks, reflecting the initial reliance on an event-based representation. However, that correlation should decrease over time as control shifts to an emergent form of timing with successive cycles of circle drawing. Whereas previous researchers have tended to use trials with considerably more intervals (e.g., 20), our informal observations suggested that performance on the continuous tasks becomes stable within the first few intervals.
We also included two other groups. In the one group, participants produced only a single interval (tapping or circle drawing). In the pause group, participants produced two intervals matched to occur when the first and last intervals would occur in the four condition. That is, the participants produced one interval, paused for a duration equal to two intervals of the metronome, and then produced a second interval. For that condition, the participant had to internally maintain the metronome rate for the entire response period. The use of the pause group allowed us to examine the effects of keeping track of time, even though movements, intervals, or both were not being actively produced. The one group allowed us to compare the effects of producing the first of four intervals with the effects of producing the first of one.
Method
Participants
Eighty-four right-handed undergraduate students participated in the experiment in exchange for course credit. The experimental and informed consent procedures were approved by the Purdue University Institutional Review Board.
Design, Apparatus, and Task
The participants were randomly assigned to one of the three experimental groups, with 28 participants in each group. Participants in all groups performed both a tapping and a circle-drawing task in separate blocks of trials.
Participants sat in front of a 79-cm-high wooden table for all tasks. For tapping, participants were required to tap on the table surface by flexing and extending the index finger about the metacarpophalangeal joint with an average excursion distance of 2 cm. For circle drawing, a template of a 5-cm-diameter circle was provided, and participants used a 2H wooden pencil to draw circles along the template. A 1-cm-diameter “endpoint” circle intersected the template at the farthest point from the participants. Participants were required to start each trial with the pencil tip in that endpoint circle. Their wrist and fingers were kept rigid, with the movements primarily achieved by rotation about the elbow and shoulder. We instructed participants to use the template as a guide rather than try to strictly trace the circle. In other words, instructions emphasized temporal over spatial accuracy, although the circle trajectories were visible from the pencil markings.
The target cycle duration was fixed at 500 ms for all conditions. To define that target interval, the experimenter presented five 10-ms tones (1600 Hz), with an interonset interval of 500 ms.
For all three groups, participants began responding whenever they were ready after the final tone of the metronome. The one-group participants produced a single interval after the series of tones ended by either tapping twice or drawing one circle. The four-group participants produced a series of four intervals, with five taps in the tapping task and four circles in the drawing task. The participants in the pause group produced one interval (by either making two taps or drawing one circle) and then paused for two intervals before producing a final interval. The instructions emphasized that the pause duration should equal the duration of two intervals; that is, the participants should initiate the last interval by internally maintaining a beat initiated by the movement onset for the first interval.
For tapping, participants were instructed that the intervals were defined by the time between successive taps on the table surface. For circle drawing, the instructions varied slightly between the groups. For the one and the pause groups, the interval was the time between the start and the end of the pencil movement. For the four group, participants were instructed that the end of Intervals 1–3 was defined as the time when the pencil entered the small, endpoint circle and that the end of Interval 4 was defined as the time when the pencil stopped. We used those events for the instructions, given that they were readily understood by the participants. We used different kinematic variables in the actual analyses (see Data Collection and Reduction), although those variables closely corresponded to the events highlighted in the instructions.
Procedure
Testing began after participants provided informed consent. Half of the participants within each group began with the tapping task, and half began with the circle-drawing task. Participants performed 70 trials of each task. The experimenter initiated each trial by triggering the metronome. Following the fifth beat, participants initiated the response, usually within 1 to 2 s of the offset of the metronome. During the first 15 trials of each task, the experimenter provided knowledge of results (KR) for each of the intervals by reading the temporal values from the computer monitor, including the pause duration for the pause group. For the remaining trials, KR was provided only if a movement cycle was less than 450 ms or greater than 550 ms, or less than 900 ms or greater than 1,100 ms for the duration of the pause (± 10% of target duration). The entire session lasted approximately 50 min.
Data Collection and Reduction
We used a three-dimensional miniBird movement analysis system (Ascension Technology Corp., Burlington, VT) to obtain kinematic records of the movements. The sampling rate was set at 144 Hz. For the tapping task, we taped a marker to the fingernail of the right index finger. For the drawing task, we attached the marker 1.5 cm from the tip of the pencil.
We up-sampled the kinematic data by a factor of seven by using the interp function in MATLAB (The MathWorks, Natick, MA), which provided an effective sampling rate of 1008 Hz. That procedure provided smooth records that allowed us to reconstruct the kinematics with approximately 1-ms precision. We applied a 30-Hz Butterworth low-pass filter and used a three-point difference technique to compute velocity. For the tapping task, we calculated the velocity function by using changes along the z-axis (perpendicular to table surface). For the circle-drawing task, we used velocity along the y-axis (proximal–distal axis).
To ascertain the onset of each tap, we determined the maximum downward velocity for that tap and defined the onset as the point at which the velocity dropped to 3% of that value. The 3% value occurs virtually coincidently with the point in time when the finger begins to contact the table surface. For circle drawing, we calculated the maximum velocity for the movement phase away from the body (y-axis, proximal-to-distal direction) for each cycle and defined the end of that cycle as the point at which velocity had decreased to 3% of that value. That criterion corresponds closely either (a) to the point at which the pencil comes to a stop (end of the first cycle in the pause condition or the last cycle for the one and the four conditions) or (b) to just before the reversal in direction along the y-axis for the other cycles. In most cases, the pencil tip was within the small, endpoint circle at that point in time. To capture the start of the first cycle in all three conditions as well as the second circle in the pause condition, we identified the maximum velocity for the movement phase toward the body (y-axis, distal-to-proximal direction) and then worked backward to define the point where the accelerating movement had reached 3% of that value. We adopted those criteria so that we could use a similar algorithm (3% of maximum velocity) to define cycle onsets, offsets, or both, for all of the tasks and could choose points that closely corresponded to the instructions. We recognize that alternative points could have been used (e.g., start of downstroke for tapping or time at which pencil changed direction on y-axis for circle drawing). However, Biberstine, Zelaznik, Kennedy, and Whetter (in press) have shown that each of those measures produces essentially the same results in terms of cycle duration.
On the basis of those criteria, the experimenter marked on graphic displays of the kinematic traces the cycle onsets, offsets, or both. The experimenter visually inspected that the identified onsets were appropriate. In the few cases (approximately 0.5%) in which the algorithm failed to mark an onset or marked an extra onset, the experimenter used a mouse-driven cursor to manually adjust the mark. That interactive procedure is similar to what has been used in previous studies (Robertson et al., 1999; Zelaznik, Smith, Franz, & Ho, 1997), and it has been shown to be accurate and reliable.
The analyses included data from only Trials 16 through 70. We eliminated approximately 2% of the circle-drawing trials for the four group because participants produced more than four circles. Participants in the one and the pause groups always produced the appropriate number of intervals.
Results
Given that the task requirements (i.e., number of intervals produced) for the three groups were different, a single analysis involving the variables group and task (circle drawing versus tapping) was not appropriate. Therefore, we initially present the results for each group separately. Then, we present between-groups analyses, focusing on performance of the first interval for all three groups and the last interval for the four and the pause groups.
The mean interval duration for each condition and the variability data in terms of coefficient of variation scores are summarized in Table 1 and Figure 1, respectively. The coefficient of variation is the standard deviation divided by the mean and then converted to a percentage. Differences in mean interval duration are adjusted for, and the monotonic relationship between interval duration and variability is taken into account in that measure (Michon, 1967; Schmidt, Zelaznik, Hawkins, Frank, & Quinn, 1979).
TABLE 1.
Average Interval Duration (in ms) for the Three Groups and Two Tasks as a Function of Interval
| Interval
|
|||||
|---|---|---|---|---|---|
| Task | 1 | 2 | Pause | 3 | 4 |
| Four group | |||||
| Tapping | 491 | 493 | 489 | 493 | |
| Circle | 506 | 471 | 474 | 498 | |
|
| |||||
| Pause group | |||||
| Tapping | 498 | 1,022 | 493 | ||
| Circle | 477 | 1,014 | 479 | ||
|
| |||||
| One group | |||||
| Tapping | 497 | ||||
| Circle | 477 | ||||
FIGURE 1.
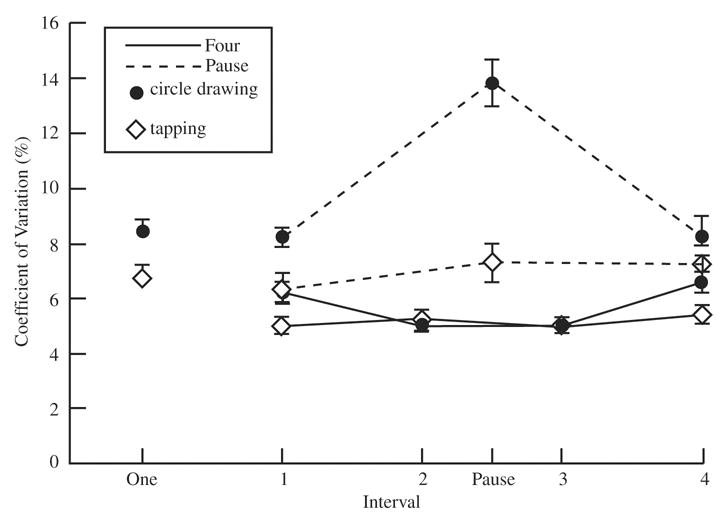
Coefficient of variation as a function of group (one, four, and pause) and interval. The one group is depicted as Interval One on the abscissa.
Four Group
Participants, on average, produced intervals that approximated the target duration. There was a significant interaction between interval and task, F(3, 81) = 36.00, p < .0001. Compared with circle drawing, the produced duration was shorter when the first interval was tapped and was longer for Intervals 2 and 3. On the fourth interval, the mean durations for the two tasks were equivalent.
In terms of the coefficient of variation, the four group provided two ways of comparing temporal precision. First, we examined the coefficient of variation, calculated within each trial and then averaged across trials. That measure is similar to the one used in the continuation task, although here there were only 4 intervals per trial (unlike the standard 20–30 intervals per trial). The coefficient of variation was 4.0% in the tapping task and 5.3% in the circle-drawing task. Thus, unlike what is observed with the standard continuation task (Robertson et al., 1999; Spencer & Zelaznik, 2003; Zelaznik et al., 2002), variability was greater during the circle-drawing task than in the tapping task, F(1, 27) = 18.1, p < .001.
Second, we compared the coefficient of variation scores for each interval across trials (see Figure 1) for the four group. In line with the transformation hypothesis, there was a Task × Interval interaction, F(3, 81) = 7.00, p < .001. Variability remained constant across the four intervals for the tapping task. In contrast, variability for circle drawing was greater on the first interval than on Intervals 2 and 3. Scheffé post hoc tests also revealed a significant increase in variability for the fourth interval in the circle-drawing task.
Pause Group
The pause group’s tapping exhibited longer interval durations than its circle drawing did, F(1, 27) = 5.42, p = .03. There was also a main effect of interval because the pause duration was approximately twice as long as the first and last intervals, F(2, 54) = 2,540.65, p < .0001. The Interval × Task interaction was not significant, F < 1.
For the coefficient of variation scores, there were significant effects of task, F(1, 27) = 35.35, p < .001, and interval, F(2, 54) = 177.16, p < .001, as well as a significant Interval × Task interaction, F(2, 54) = 31.85, p < .001. As can be seen in Figure 1, the coefficient of variation again remained stable in the tapping condition, not only for the first and last 500-ms intervals but also for the 1,000-ms pause. Based upon Scheffé post hoc tests (p < .05), circle drawing exhibited greater variability than tapping on Interval 1 and for the pause but was not statistically different for the last interval.
One Group
The 20-ms difference in average duration between tapping and circle drawing was significant for the one group, t(27) = 4.01, p < .0001. The coefficient of variation was also greater for circle drawing than for tapping, t(27) = 2.88, p = .008.
Interval-1 Effects
In this analysis, we compared the performance of the three groups on the first interval only. The main effect of group was significant, F(3, 81) = 9.67, p = .0002, and Scheffé post hoc tests (p < .05) confirmed that whereas the one and the pause groups were not different, variability was greater in those two groups than in the four group. There was also a main effect of task, F(1, 81) = 105.61, p < .0001. Participants were more variable when drawing circles than when tapping. The Group × Task interaction was not significant, F < 1.
Interval-4 Effects
Overall, the four group had a lower coefficient of variation than the pause group did, F(1, 54) = 10.65, p = .002, on the fourth interval. Similar to the Interval-1 analysis, circle drawing was associated with greater variability than tapping was, F(1, 54) = 5.93, p = .018. The Group × Task interaction was not significant, F < 1.
Individual Difference Analysis
We next turn to analyses of individual differences, looking at the correlation matrix for the different intervals of the two tasks. That analysis was especially relevant for the four group. By the transformation hypothesis, we proposed that the control processes for circle drawing undergo a transformation across cycles. Initially, performance requires that individuals refer to an internal representation of the target interval to ensure that the target duration is established. Over time, control processes that exploit task dynamics supplant that event-based representation, allowing timing to become emergent. From that hypothesis, we predict that performance on the tapping task (for all intervals) will correlate with performance on the first interval (or initial intervals) of the circle-drawing task, given that those conditions require an internal representation of the target interval. The correlation should become attenuated or be eliminated, however, when one compares tapping with the subsequent intervals of circle drawing.
We computed reliability by taking the last 54 trials in each task and calculating the coefficient of variation for the odd and even trials separately. In Table 2, we present the results of those calculations. Although there were only 27 intervals for each coefficient of variation measure, reliability was surprisingly high. Reliability for the within-four intervals sequence, a shortened version of the typical continuation task, was .90. That value is consistent with earlier individual difference work performed in our laboratory. Thus, correlations of individual differences are meaningful with the current data sets.
TABLE 2.
Reliability Coefficients
| Interval
|
|||||
|---|---|---|---|---|---|
| Group/task | 1 | 2 | Pause | 3 | 4 |
| Across-trial measures | |||||
| Four group | |||||
| Circles | .54 | .39 | .72 | .71 | |
| Tapping | .80 | .53 | .77 | .76 | |
| Pause group | |||||
| Circles | .56 | .75 | .83 | ||
| Tapping | .84 | .67 | .52 | ||
| One group | |||||
| Circles | .62 | ||||
| Tapping | .87 | ||||
|
| |||||
| Within-trial reliability | |||||
| Four group | |||||
| Circles | .91 | ||||
| Tapping | .89 | ||||
The r value required for significance (p < .05) with 28 participants is .38. In Table 3, we present the correlation values for the four group. First, notice that individual differences were highly correlated within the tapping task. That was also true for circle drawing, although the r values were lower. Most important, variability for the first circle-drawing interval was correlated with variability for each of the tapping intervals (range = .37–.50). In other words, performance on the tapping task was predictive of performance on the first interval during circle drawing. In contrast, the correlations between tapping and the last three intervals of circle drawing were low (range = –.05–.29). That result is in accord with the predictions of the transformation hypothesis: Tapping and circle drawing initially share a common source (or sources) of variability, but that relationship dissipates as circle drawing is extended.
TABLE 3.
Individual Differences in Coefficient of Variation Correlations for Participants in the Four Group
| Tapping
|
Circle drawing
|
||||||
|---|---|---|---|---|---|---|---|
| Intervals | 2 | 3 | 4 | 1 | 2 | 3 | 4 |
| Tapping | |||||||
| 1 | .74 | .80 | .80 | .49 | .13 | .19 | –.03 |
| 2 | .69 | .64 | .37 | .05 | .18 | –.07 | |
| 3 | .81 | .47 | .05 | .29 | .11 | ||
| 4 | .47 | –.05 | .24 | –.04 | |||
|
| |||||||
| Circles | |||||||
| 1 | .32 | .50 | .36 | ||||
| 2 | .62 | .56 | |||||
| 3 | .68 | ||||||
Further inspection of Table 3 reveals that within circle drawing, the smallest correlations were between the first interval and the other three intervals (range = .32–.50). Stronger correlations were observed between Intervals 2, 3, and 4 (range = .56–.68). That result suggests that although there were shared sources of variability during circle drawing across all intervals, the degree of overlap was reduced when we compared the initial interval with subsequent intervals. We hypothesize that the reason for that finding is that an event-timing representation was required at the start of circle drawing but gave way to control processes associated with emergent timing over the four intervals.
It is also important to note that performance on the tapping task did not correlate with the fourth interval of circle drawing. That finding suggests that although variability rises for the last circle-drawing interval, the processes involved in terminating the circling movements are not related to those involved in producing the periodic tapping movements. By the transformation hypothesis, we propose that the latter includes processes related to an event-timing representation. Termination of the circle-drawing movements does not require those processes.
The correlation results for the pause group are shown in Table 4. Within tapping, variability was significantly correlated for the two 500-ms intervals, and each of those was correlated with the variability of the 1,000-ms pause interval. Within circle drawing, variabilities in the timing of the two circles (first and fourth) were highly correlated. The correlation between the fourth and the pause intervals approached significance.
TABLE 4.
Individual Differences in Coefficient of Variation Correlations for Participants in the Pause Group
| Tapping
|
Circle drawing
|
|||||
|---|---|---|---|---|---|---|
| Intervals | 1st | Pause | 4th | 1st | Pause | 4th |
| Tapping | ||||||
| 1st | .60 | .71 | .36 | .27 | .42 | |
| Pause | .53 | .11 | .57 | .07 | ||
| 4th | .42 | .22 | .26 | |||
|
| ||||||
| Circles | ||||||
| 1st | .12 | .78 | ||||
| Pause | .35 | |||||
Between the two tasks, moderate correlations were observed for the 500-ms intervals. The findings for the first circle-drawing interval were similar to what was seen for the four group. Most interesting, tapping variability was also correlated with variability on the fourth interval in the circle-drawing task (reliable only with the first tapping interval), a finding that was not present in the four group. That result is consistent with the idea that the inclusion of the pause required the participants to use an event-based representation for both circle-drawing intervals. Variability for the 1,000-ms pause interval was also correlated between the two tasks, although the between-task correlations of the 500-ms movement-produced intervals and the 1,000-ms pause interval were weak.
For the one group, the correlation between variability on the tapping and circle-drawing tasks was only .20. That result is not in accord with the prediction of the transformation hypothesis that an event representation would be required for both tasks. Two aspects of that null result are noteworthy. First, the absence of correlation here is inconsistent with the results from the four and the pause groups. Second, participants in those groups had the least practice overall, producing only 70 intervals over the course of the experiment.
Discussion
We designed the current experiment to explore the relationship between event and emergent timing. In particular, we focused on the question of how emergent timing is established, given that we required the participants to produce movements that matched an externally specified temporal goal. We hypothesized that a transformation is required in which an event-timing representation is eventually supplanted once the participant identifies the optimal task dynamics. Such a strategy may be difficult to apply during movement tasks involving discontinuities (such as contact with an external surface or when there are pauses between successive movement cycles). Moreover, the participant can use the saliency of such events to maintain the task goal. In those conditions, we assume, the participant uses an event representation to time the movements for the entire trial.
Two key predictions derived from the transformation hypothesis were supported by the four group’s results. First, the coefficient of variation remained constant across the four intervals in the tapping task, consistent with the idea that the control processes remained invariant. In other words, the metronome allowed the participant to establish the temporal goal, which was defined as the interval between salient events, and that representation was invoked across the entire trial. In contrast, the coefficient of variability fluctuated across intervals in the circle-drawing task. We assume that the fluctuations reflected the transition from control based on an event-based representation to control based on movement dynamics. Second, and more compelling, the individual difference analyses revealed significant correlations between temporal variability for all intervals during tapping and temporal variability for only the first interval during circle drawing. Those correlations were not present when we compared tapping variability with variability during Intervals 2, 3, and 4 for circle drawing.
Several other aspects of the results are also consistent with the transformation hypothesis. Within the circle-drawing task for the four group, correlations were lowest when we compared Interval 1 with the subsequent intervals. For the pause group, although not all of the correlations were significant, they were consistently positive when either the movement phases within a task or the movement phases between tasks were compared. Given the significant discontinuity introduced by the pause, as well as the task requirement that the target duration be internally maintained, we assume that an event-timing representation was required for the entire trial in the pause condition.
Based on the individual difference correlation results, it appears that the transformation of event to emergent timing was achieved by the second interval. We draw that inference from the finding that only the first interval of circle drawing in the four group correlated with tapping. Subsequent intervals were not significantly correlated with tapping, suggesting that a different form of control had been established. The rapid transformation may be somewhat task specific. More complex rhythmic movements may require a longer transformation period before performance stabilizes.
Two aspects of the results are not consistent with the transformation hypothesis. First, correlations between the pause interval during circle drawing and the movement phases of either the tapping or the circle-drawing task failed to reach significance. Given that the target interval was maintained during the pause (see Table 1), we would expect variability of that epoch to correlate with the movement phases for that condition. The lower correlations may reflect the fact that additional component sources of variability associated with the movements themselves are not operative during the pause. Second, we expected to observe a significant correlation between tapping and circle drawing for the one group, but the r value was only .20. As noted earlier, those participants had less practice in producing the 500-ms interval because there was only one interval per trial, and that may have contributed to the low correlation. In addition, drawing well-timed circles in isolation is difficult, as evidenced by the high coefficient of variability scores for the one and the pause groups (both circles). We have hypothesized that participants explore a mapping between an event-based representation of the task goal and the appropriate task dynamics. Variability across trials as such will not simply reflect variability in the event representation but will also reflect variability in the mapping process. We assume that the mapping operation was not invoked by the one group participants during tapping.
Additional sources of variability are, of course, present in all of the conditions and will vary between conditions. The increase in the coefficient of variation for the last circle in the four group was unexpected, although, as predicted, it did not correlate with tapping variability; and the correlation was greater between that interval and Intervals 2 and 3 than for Interval 1 in the circle-drawing task. Taken together, the results for the one group and last circle of the four group suggest that terminating a circling movement may introduce sources of variability that are not related to event timing. It is interesting to note that terminating the movement and marking the end of the final interval are not identical for circle drawing and tapping. For the former, the two events are identical. For tapping, the last interval is terminated when the finger contacts the table, even though the movement itself actually ends after finger extension. Processes associated with stopping a movement are probably not identical to those controlling the interval between salient events.
Variability associated with stopping a movement may also help explain the large increase in the coefficient of variation for the pause in circle drawing. To time the pause, the participant requires information about when she or he terminated the first circling interval. A representation based on the time a movement terminated may not be as reliable as that based on a salient event such as the time when the finger contacts the table when tapping.
We recognize that our articulation of the distinction we make between event and emergent timing remains asymmetric: We have specified the form of control for event timing, hypothesizing the operation of a process that explicitly specifies the timing of salient events, and have argued that the cerebellum plays a critical role in providing that form of representation (see Ivry & Spencer, 2004; Spencer et al., 2003). With respect to the control processes underlying emergent timing, we are, admittedly, vague. We speculate that emergent timing may come about in continuous movements through a strategy in which changes in kinematic variables are minimized (Flash & Hogan, 1985). At the present time, the neural locus of that form of control remains unknown. Such a strategy would be difficult for the first and last circles of the four group as well as for those conditions that require the production of isolated circles. Spencer and Zelaznik (2003) observed that the relation between timing interval and timing variance, a Weber slope (Ivry & Hazeltine, 1995), was different for circle drawing and for line drawing, purportedly two emergently timed tasks. The reason for that difference may be that in circle drawing a constant angular velocity strategy is used, and in line drawing the strategy could be to minimize jerk. Thus, it is plausible, and we believe likely, that different movement trajectories control different aspects of movement kinematics, and thus emergent timing will not be common across those tasks.
Although future work is required to enable researchers to specify the psychological and neural mechanisms associated with emergent timing, the current study does offer one account of how people might perform continuous, rhythmic movements without explicit temporal control while still exhibiting the flexibility required to vary movement rate so as to match an externally defined temporal goal. We hypothesize, on the basis of the current results, that the goal is derived with reference to an event-based representation, but over cycles the representation is transformed such that timing becomes emergent.
Acknowledgments
R. Spencer and R. Ivry were supported by Grants NS30256, NS33504, and NS40813, and R. Spencer was supported by National Institutes of Health Grant F32 NS048012. H. Zelaznik was supported by Grants DC 00559 and DC 02527 from the National Institutes of Health and by National Science Foundation Grant 0427260. The authors thank an anonymous reviewer and Knut Drewing for comments on a previous version of the article.
References
- Biberstine J, Zelaznik HN, Kennedy L, Whetter E. Timing precision in circle drawing does not depend on spatial precision of the timing target. Journal of Motor Behavior. doi: 10.3200/JMBR.37.6.447-453. in press. [DOI] [PubMed] [Google Scholar]
- Flash T, Hogan N. The coordination of arm movements: An experimentally confirmed mathematical model. Journal of Neuroscience. 1985;5:1688–1703. doi: 10.1523/JNEUROSCI.05-07-01688.1985. [DOI] [PMC free article] [PubMed] [Google Scholar]
- Franz EA, Ivry RB, Helmuth LL. Reduced timing variability in patients with unilateral cerebellar lesions during bimanual movements. Journal of Cognitive Neuroscience. 1996;8:107–118. doi: 10.1162/jocn.1996.8.2.107. [DOI] [PubMed] [Google Scholar]
- Henry FM, Rogers C. Influence of motor and sensory sets on reaction latency and speed of discrete movements. Research Quarterly. 1960;31:459–468. [Google Scholar]
- Ivry R, Spencer RM, Zelaznik HN, Diedrichsen J. The cerebellum and event timing. In: Highstein SM, Thach WT, editors. The cerebellum: Recent developments in cerebellar research. Vol. 978. New York: New York Academy of Sciences; 2002. pp. 302–317. [DOI] [PubMed] [Google Scholar]
- Ivry RB, Hazeltine E. Subcortical locus of temporal coupling in the bimanual movements of a callosotomy patient. Human Movement Science. 1999;18:345–375. [Google Scholar]
- Ivry RB, Hazeltine E. Perception and production of temporal intervals across a range of durations: Evidence for a common timing mechanism. Journal of Experimental Psychology: Human Perception and Performance. 1995;21:3–18. doi: 10.1037//0096-1523.21.1.3. [DOI] [PubMed] [Google Scholar]
- Ivry RB, Richardson TC. Temporal control and coordination: The multiple timer model. Brain & Cognition. 2002;48:117–132. doi: 10.1006/brcg.2001.1308. [DOI] [PubMed] [Google Scholar]
- Ivry RB, Spencer RMC. The neural representation of time. Current Opinion in Neurobiology. 2004;14:225–232. doi: 10.1016/j.conb.2004.03.013. [DOI] [PubMed] [Google Scholar]
- Keele SW, Ivry RB. Modular analysis of timing in motor skill. In: Bower GH, editor. The psychology of learning and motivation. Vol. 21. New York: Academic Press; 1987. pp. 183–228. [Google Scholar]
- Kennerley SW, Diedrichsen J, Hazeltine E, Semjen A, Ivry RB. Callosotomy patients exhibit temporal uncoupling during continuous bimanual movements. Nature Neuroscience. 2002;5:376–381. doi: 10.1038/nn822. [DOI] [PubMed] [Google Scholar]
- Lotter WS. Specificity or generality of speed of systematically related movements. Research Quarterly. 1961;31:55–62. [Google Scholar]
- Michon JA. Timing in temporal tracking. Soesterberg, The Netherlands: Institute for Perception–TNO; 1967. [Google Scholar]
- Robertson S, Zelaznik H, Lantero D, Gadacz K, Spencer R, Doffin J. Correlations for timing consistency among tapping and drawing tasks: Evidence against a single timing process for motor control. Journal of Experimental Psychology: Human Perception and Performance. 1999;25:1316–1330. doi: 10.1037//0096-1523.25.5.1316. [DOI] [PubMed] [Google Scholar]
- Schmidt RA, Zelaznik H, Hawkins B, Frank JS, Quinn JT. Motor-output variability—Theory for the accuracy of rapid motor acts. Psychological Review. 1979;86:415–451. [PubMed] [Google Scholar]
- Spencer RMC, Ivry RB, Zelaznik HN. Role of the cerebellum in movements: Control of timing or movement transitions? Experimental Brain Research. 2005;161:383–396. doi: 10.1007/s00221-004-2088-6. [DOI] [PubMed] [Google Scholar]
- Spencer RMC, Zelaznik HN. Weber (slope) analyses of timing variability in tapping and drawing tasks. Journal of Motor Behavior. 2003;35:371–381. doi: 10.1080/00222890309603157. [DOI] [PubMed] [Google Scholar]
- Spencer RMC, Zelaznik HN, Diedrichsen J, Ivry RB. Disrupted timing of discontinuous but not continuous movements by cerebellar lesions. Science. 2003;300:1437–1439. doi: 10.1126/science.1083661. [DOI] [PubMed] [Google Scholar]
- Turvey MT. Preliminaries to a theory of action with reference to vision. In: Shaw RE, Bransford J, editors. Perceiving, acting and knowing. Hillsdale, NJ: Erlbaum; 1977. pp. 211–265. [Google Scholar]
- Zelaznik HN, Smith A, Franz EA, Ho M. Differences in bimanual coordination associated with stuttering. Acta Psychologica. 1997;96:229–243. doi: 10.1016/s0001-6918(97)00014-0. [DOI] [PubMed] [Google Scholar]
- Zelaznik H, Spencer RMC, Ivry RB. Dissociation of explicit and implicit timing in repetitive tapping and drawing movements. Journal of Experimental Psychology: Human Perception and Performance. 2002;28:575–588. doi: 10.1037//0096-1523.28.3.575. [DOI] [PubMed] [Google Scholar]