

Abstract
Knockdown studies suggest transcription factor AP-2 alpha (Tfap2a), is required for neural crest induction in frog embryos. Because tfap2a is expressed in neural crest and in presumptive epidermis, a source of signals that induce neural crest, it was unclear whether this requirement was cell autonomous. Moreover, neural crest induction occurs normally in zebrafish tfap2a and mouse Tcfap2a mutant embryos, so it was unclear if a requirement for Tfap2a in this process was evolutionarily conserved. Here we show that zebrafish tfap2c, encoding AP-2 gamma (Tfap2c), is expressed in non-neural ectoderm including transiently in neural crest. Inhibition of tfap2c with antisense oligonucleotides does not visibly perturb development. However, simultaneous inhibition of tfap2a and tfap2c utterly prevents neural crest induction, and disrupts development of cranial placode derivatives, although gene expression characteristic of the pre-placodal domain is normal. Transplant studies support a cell-autonomous role for Tfap2a and Tfap2c in neural crest induction. Unexpectedly, Rohon-Beard sensory neurons, which previous studies indicate are derived from the same precursor population as neural crest, are reduced by less than half in tfap2a/tfap2c doubly deficient embryos, implying non-neural crest origin for a subset of them. These results reveal a requirement for Tfap2-type activity for early development of all non-neural ectoderm derivatives.
Introduction
The neural crest is a population of precursor cells that migrate from the dorsal neural tube and give rise to diverse derivatives. Neural crest induction refers to the specification of ectoderm cells to the neural crest lineage. This process is of particular interest because it reflects events in the emergence of neural crest during vertebrate evolution. It is believed that combinatorial activity of transcription factors expressed at the neural plate border governs neural crest induction, but the functions of specific transcription factors in this process are not yet clear (Hong and Saint-Jeannet, 2005; Sauka-Spengler and Bronner-Fraser, 2006; Steventon et al., 2005).
The Tfap2 (AP-2 or Activator Protein 2) family of transcription factors is implicated in control of cell induction, differentiation, survival, and proliferation in various developmental contexts, including the neural crest (reviewed in Eckert et al., 2005; Hilger-Eversheim et al., 2000). In mouse, the five Tfap2 proteins, a–e, are encoded by the genes Tcfap2a, Tcfap2b, etc., respectively; in humans and frogs the orthologues of these genes are TFAP2A, etc., and in zebrafish, they are known as tfap2a, etc. The five proteins share a conserved structure, and with the exception of Tfap2d, they share very similar DNA binding specificity (Eckert et al., 2005). Mutant analysis has shown that Tfap2a is essential for normal development of neural crest derivatives (Holzschuh et al., 2003; Knight et al., 2004; Schorle et al., 1996; Zhang et al., 1996). However the role of Tfap2a specifically in neural crest induction has remained uncertain, because disruption of Tfap2a expression has different effects in different species. Oligonucleotide-mediated knock down of TFAP2A in frog embryos greatly, but not completely, reduced expression of Slug and Sox9, two markers of pre-migratory neural crest, and forced expression of TFAP2A in neural plate or in explanted, neuralized ectoderm induced ectopic expression of these genes (Luo et al., 2003; Luo et al., 2005). These experiments suggested that Tfap2a is required for specification of neural crest in frogs, in a cell autonomous or non-autonomous mode. By contrast, in mouse and zebrafish Tcfap2a (tfap2a) strong hypomorphic or null mutants induction and migration of neural crest appear to occur essentially normally (Barrallo-Gimeno et al., 2004; Knight et al., 2003; Schorle et al., 1996; Zhang et al., 1996). These disparities suggested the possibility that a role for Tfap2-type activity in neural crest induction might not be a conserved feature among vertebrates.
Alternatively, there may be variation among species in the degree to which neural crest induction is shared among Tfap2 family members. Tcfap2a, Tcfap2b, and Tcfap2c are all expressed in neural crest in mouse (Chazaud et al., 1996; Mitchell et al., 1991; Moser et al., 1997), and there is evidence that Tfap2 family members act redundantly in development. For instance, Tcfap2a and Tcfap2c are co-expressed in extra-embryonic tissue (Auman et al., 2002; Werling and Schorle, 2002; Winger et al., 2006). Mouse Tcfap2c mutants die at 8.5 days post coitum (dpc) because of abnormal placental function (Auman et al., 2002; Werling and Schorle, 2002). By contrast, mouse Tcfap2a mutant embryos live considerably longer, until shortly after birth (Schorle et al., 1996; Zhang et al., 1996). Embryos doubly mutant for Tcfap2a and Tcfap2c die at 3.5 dpc, i.e., even earlier than Tcfap2c mutants, consistent with redundant activity of these proteins within extra embryonic tissue during mouse peri-implantation development (Winger et al., 2006). In another example, zebrafish tfap2b is expressed in the hindbrain and, like tfap2a, in non-neural ectoderm flanking the hindbrain (Knight et al 2005). Oligonucleotide-mediated knockdown of tfap2b did not visibly perturb development, but simultaneous inhibition of tfap2a and tfap2b resulted in far more severe defects in craniofacial cartilage than in tfap2a mutants, apparently because of redundant activity of Tfap2a and Tfap2b in cranial epidermis (Knight et al 2005). Because Tfap2 family members appear to act redundantly in other developmental contexts they may do so during neural crest induction.
A second open question regarding the role of Tfap2-type activity in neural crest induction is whether this role is direct or indirect. In mice and zebrafish, Tcfap2a/tfap2a is expressed from gastrula stages in premigratory neural crest, but also in non-neural ectoderm flanking the neural crest. Explant studies have shown that non-neural ectoderm is the source of signals that induce neural crest (Dickinson et al., 1995; Liem et al., 1995; Moury and Jacobson, 1990; Selleck and Bronner-Fraser, 1995), so it is possible the production of these signals depends on Tfap2-type activity. Consistent with this possibility, there is evidence that signals from adjacent tissues that instill pattern on neural crest cells depend on Tfap2-type activity. Thus, in mouse Tcfap2a mutant embryos and zebrafish tfap2a mutant embryos, there is a profound reduction in a subset of neural crest derivatives including the jaw (Barrallo-Gimeno et al., 2004; Holzschuh et al., 2003; Knight et al., 2003; Schorle et al., 1996; Zhang et al., 1996). However, this dependence of jaw development on Tfap2a is at least partially cell non-autonomous, because embryos with Wnt1-Cre mediated neural crest-specific elimination of Tcfap2a have normal jaws (Brewer et al., 2004), and the presence of wild-type pharyngeal ectoderm can partially rescue the development of the jaw in zebrafish tfap2a mutants (Knight et al., 2005). These examples illustrate that non-autonomous effects of Tfap2-type activity on neural crest development are possible.
Here we address both of these issues in zebrafish embryos. We present evidence that redundant activity of Tfap2a and Tfap2c is required for neural crest induction, and that this requirement is cell autonomous. Unexpectedly, Rohon-Beard spinal sensory neurons, which share properties with neural crest (Artinger, et al. 1999; Cornell and Eisen, 2000; Cornell and Eisen, 2002), are merely reduced in embryos deficient in Tfap2a and Tfap2c. These findings suggest that Tfap2-type activity, mediated by Tfap2a and Tfap2c, is a conserved, and cell-autonomous requirement of neural crest induction. We also describe severe reduction of cranial placode derivatives, but no evidence of a failure of induction of the preplacodal domain, in embryos deficient in both genes.
Materials and Methods
Fish maintenance
Zebrafish embryos and adults were reared as described (Westerfield, 1993) in the University of Iowa Zebrafish Facility. Embryos were staged by hours or days post fertilization at 28.5°C (hpf or dpf) (Kimmel et al., 1995). To generate tfap2a homozygous mutant embryos, heterozygous adults harboring a presumed null allele of tfap2a (lockjaw, Knight et al., 2003) were used.
Identify zebrafish Tfap2 orthologes
Three putative genes encoding zebrafish Tfap2 orthologues were found in the database of the Zebrafish Information Network (ZFIN, http://zfin.org). Genbank accession numbers for these genes are listed: tfap2c, NM_001008576; tfap2d, NM_00102554; tfap2e, NM_200821.
RT-PCR and morpholinos
First-strand cDNA was synthesized from total RNA harvested from embryos at 24 hpf as described (O’Brien et al., 2004). A 1.3 kb fragment of zebrafish tfap2c was amplified from the wild-type cDNA by using the following primers: forward, 5′-GTT AGC AGC AAT GGG AAC CCT C-3′, reverse, 5′-GGT ACC ATC GGA AGA GGC TTG T-3′, and inserted into pCR4-TOPO vector (Invitrogen, Carlsbad, CA). This fragment includes most of the open reading frame (i.e., encoding amino acids 22 to 434 of 445).
To disrupt tfap2c expression, the exon 3 splice donor site and the exon 4 splice acceptor site were inferred in zebrafish tfap2c gene by comparison of cDNA sequence to tfap2c genomic sequence (www.ensembl.org/Danio_rerio/index.html, zgc92088). Morpholinos complementary to these sites were ordered: tfap2c e3i3 MO, 5′-TCT GAC ATC AAC TCA CCT GAA CATC-3′; tfap2c i3e4 MO, 5′-CAT CGT GCT GCA ATA AAA CAA AAT G-3′ (Gene Tools, Philomath, OR). For a negative control, the vendor’s standard control morpholino (5′-CCT CTT ACC TCA GTT ACA ATT TAT A-3′), which is thought to have no specific target in animal cells, was used. Morpholinos were reconstituted to 5 mg/ml in Danieau solution (Nasevicius and Ekker, 2000) and stored at −20°C, then diluted immediately before use to 1 mg/ml in 0.2 M KCl. Embryos were injected with 4–8 nl of diluted morpholinos at the 1–4 cell stage into the yolk immediately below the blastomeres. We saw evidence of non-specific toxicity, i.e., patches of opacity in the brain and spinal cord, upon injection of 10 ng or more of either MO. However, injection of 5 ng of either tfap2c MO did not cause this phenotype. We compared efficiency of the MO, and found that 2.5 ng/embryo of tfap2c e3i3 MO was virtually always sufficient to eliminate melanophores in tfap2a homozygous mutants, while 5.0 ng/embryo of tfap2c i3e4 MO was necessary for this effect. To assure strong penetrance, 5 ng/embryo of tfap2c e3i3 MO was used to generate tfap2a−/cMO embryos. For double MO experiments, 5 ng of tfap2c e3i3 MO and 2.5 ng tfap2a e2i2 MO were injected. ngn1 MO (Cornell and Eisen, 2002), was used at 1.5 ng/embryo. To test the efficacy of those tfap2c MOs, a pair of primers flanking a 557 bp fragment between the exon 3 and exon 5 of tfap2c was used for RT-PCR (forward, 5′-AAC CCA GCG ACC CAT ACT CTC A-3′; reverse, 5′-TCC AAG CAG GGA TGC GTT CA-3′).
Chimeric embryo procedure
To create genetic chimeras, donor embryos were injected with 5 nl of 1% lysine-fixable biotinylated-dextran, 10,000 MW (Sigma, St. Louis, MO). At sphere stage (4 hpf), about 100 cells were withdrawn from each donor embryo with a manual-drive syringe fitted with an oil-filled needle (Fine Science Tools, Vancouver, BC), and about 20 cells were inserted into each of several host embryos at the same stage, aiming for a position close to the animal pole, to target clones to ectoderm (Kimmel et al., 1990). Host embryos were allowed to develop to 12 hpf, fixed and processed to reveal foxd3 gene expression by whole mount in situ hybridization and to reveal biotin with an ABC kit (Vector Labs, Burlingame, CA) and DAB as previously described (Moens and Fritz, 1999). Some host embryos were allowed to develop to 48 hpf, fixed and processed to reveal biotin.
Misexpression and rescue experiments
For rescue experiments, the open reading frame of zebrafish tfap2a, isoform AF457191, was amplified from cDNA prepared from 24 hpf embryos using the following primers: forward, 5′-GCA GGA TCC ATG AAA ATG CTT TGG A-3′, with BamHI restriction site added to the 5′ end; reverse, 5′-TAG TTC TAG ATT GGA TAT CAC TTT CTG-3′, with XbaI restriction site added to the 5′ end. The PCR product was ligated into pCS2+ vector, creating pCS2-tfap2a-ORF. This construct was linearized with NotI and capped tfap2a mRNA was generated in vitro with the mMessage mMachine kit (Ambion, Austin, TX). For rescue experiments, tfap2a mRNA was injected at a final dose of 0.25–0.5 ng, mixed with tfap2a MO and tfap2c MO prior to injection. For ectopic expression experiments, capped mRNA was synthesized in vitro from the GRXAP2 plasmid (Luo et al., 2002) and injected at 0.6–0.8 ng in 0.2 M KCl. lacz RNA was synthesized as described (Cornell and Eisen, 2000) and used as a lineage tracer.
Gene expression analysis
DIG-labeled antisense RNA probes (Roche Diagnostics, Mannheim, Germany) used for whole mount in situ hybridization were generated as described previously: tfap2a, msxb, foxd3, sox10, dlx2 (Monsoro-Burq et al., 2005; O’Brien et al., 2004), isl1 (Cornell and Eisen, 2002), pax3 (Lewis et al., 2004), zic2b (Kudoh et al., 2004), sox2 (Thisse et al., 2001), prdm1 (Hernandez-Lagunas et al., 2005); or as follows: tfap2c, NotI/T3; sox9b (Yan et al., 2005), StuI/T7; snai1b (Thisse et al., 1995), XbaI/T7; dlx3b (Akimenko et al., 1994), SalI/T7; eya1 (Sahly et al., 1999), NotI/T7; and tlxA (Andermann and Weinberg, 2001), BamHI/T7. Two-color in situ hybridization analysis, using DIG-labeled tfap2c probe and FITC-labeled foxd3 probe, was carried out as described (O’Brien et al., 2004).
Markers of cranial ganglia, enteric neurons, sympathetic neurons, and dorsal root ganglia, including anti-HNK1 (Zn12) (Trevarrow, et al. 1990) and anti-Hu (Marusich, et al. 1994), were used in whole mount immunohistochemistry as described (O’Brien et al., 2004). Double labeling with monoclonal antibody mAb 39.4D5 (anti-Islet proteins) and DIG-labeled foxd3/tfap2a probes were performed as described (Cornell and Eisen, 2000). Alcian green was used to label pharyngeal cartilage as described (Kimmel et al., 1998).
Apoptosis, cell proliferation, and DASPEI assays
Apoptotic cell death was monitored in whole embryos by terminal transferase dUTP nick-end labeling essentially as described (Reyes et al., 2004), except dUTP-DIG was used. The terminal transferase reaction was stopped by incubation at 70°C for 30 minutes, and embryos were processed with anti-DIG-alkaline phosphatase antibody and developed with NBT/BCIP, as for an RNA in situ hybridization. zVAD-fmk (MP Biomedicals, Irvine, CA) was diluted in fish water to 300 μM and added to the embryos at 6 hpf. To measure proliferation, live embryos at 10 hpf were incubated for 20 minutes in 10 mM bromodeoxyuridine (BrdU) (Roche Diagnostics Mannheim, Germany) in fish water with 15% DMSO at 4°C. Embryos were then rinsed in fish water and allowed to develop till 11 hpf. Anti-bromodeoxyuridine mouse monoclonal antibody (BMC 9318) (Roche Diagnostics, Indianapolis, IN) was used at 1:100 dilution, and developed with the PAP system (Abcam, Cambridge, MA) and DAB. To label hair cells, live embryos were incubated in 1 mM DASPEI (2-(4-dimethylaminostyryl)-N-ethylpyridinium iodide) (Biotium, Hayward, CA) for 60 minutes, rinsed for 30 minutes in embryo medium (Westerfield, 1993), and viewed with epifluorescence optics.
Results
A zebrafish tfap2c orthologue is expressed in non-neural ectoderm starting during gastrula stages
We looked for Tfap2 family members that were expressed at the appropriate place and time to participate in neural crest induction, i.e., in lateral ectoderm during gastrula stage. Orthologues of Tcfap2c, Tcfap2d, and Tcfap2e in zebrafish genomic DNA have been identified by sequence comparison algorithms (www.ensembl.org/Danio_rerio). With RT-PCR we amplified partial clones of at least 1 kb from each orthologue, and examined expression of each in situ in embryos ranging from 6 hpf (gastrula) to 48 hpf. Expression of neither tfap2d nor tfap2e is detected in non-neural ectoderm during gastrula stages, so these orthologues were not pursued in the context of neural crest induction (WL and RAC, unpublished data). At 4-cell stage, maternal tfap2c transcripts are detected by RT-PCR (not shown). At 6 hpf, tfap2c expression is detected in non-neural ectoderm (Fig. 1A), in a pattern similar or identical to that of tfap2a (Fig. 1B). At 8.5 hpf, tfap2c expression is found to at least partially overlap that of pax3, a marker of prospective neural crest (Lewis et al., 2004) (Fig. 1C,D). By 11 hpf, tfap2c expression is high in prospective epidermis and in the pre-placodal region (Fig. 1E). To learn whether tfap2c is expressed in pre-migratory neural crest at this stage, we processed embryos to reveal foxd3 in red and tfap2c in blue. At 11 hpf, the most caudal foxd3 expressing cells in the neural crest domain are found to also express tfap2c, while most of the rostral foxd3 expressing cells do not express high-level tfap2c (Fig. 1F,F′,F″,H). Becausefoxd3 expression appears in a rostral to caudal wave, these results suggest that neural crest cells down-regulate tfap2c expression shortly after they begin to express foxd3. To assess whether there is low level tfap2c expression in the more rostral neural crest cells, i.e., which may have been obscured by foxd3 expression in double-labeled embryos, we processed embryos at the same stage for tfap2c and sox2, a marker of the neural plate (Okuda et al., 2006). In tfap2c/sox2 double-labeled embryos, cells immediately flanking the cranial neural plate, which are neural crest cells, are devoid of detectable labeling (Fig. 1G). This indicates that tfap2c expression in neural crest has been down regulated below detectable levels at this stage. At 24 hpf, tfap2c expression is detected in a punctate pattern in the epidermis, but not in migrating neural crest (Fig. 1I,J). At 36 hpf, tfap2c expression is reduced or absent in surface ectoderm (Fig. 1K), and at 48 hpf, high level tfap2c expression is detected in the eye (Fig. 1L). In summary, tfap2c is expressed in non-neural ectoderm at gastrula stages through at least 24 hpf, and transiently in pre-migratory neural crest.
Figure 1.
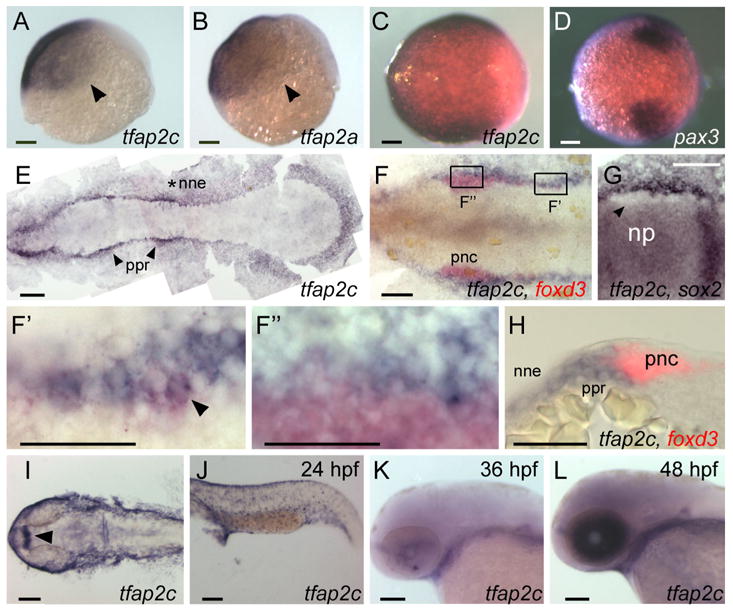
Comparison of tfap2a and tfap2c expression at embryonic stages. A, B Lateral views, animal pole oriented up and dorsal side to the right, of A, tfap2c and B, tfap2a expression in ventral and lateral ectoderm at 6 hpf. Arrowheads point to the limit of expression, which is similar or identical for the genes. C, D Animal pole views of C, tfap2c and D, pax3 expression at 8.5 hpf. Expression of pax3 marks prospective neural crest (Lewis et al., 2004); tfap2c expression partially or entirely overlaps it. E–G Dorsal views of flat-mounted embryos at 11 hpf, anterior to the left. E tfap2c expression is detected in non-neural ectoderm (nne, asterisk), with increased levels immediately adjacent to the rostral neural plate, in the pre-placodal region (ppr, arrowheads). F Double RNA in situ hybridization with foxd3 (red) and tfap2c (blue) probes. More caudal cells expressing foxd3, which are recently specified pre-migratory neural crest cells (pnc), also express tfap2c (shown at higher magnification in F′, arrowhead indicates double-labeled cell). By contrast, at more rostral levels, tfap2c is expressed in ppr but is excluded from the majority of foxd3 expressing cells (shown at higher magnification in F″). G An embryo labeled with tfap2c and sox2, a pan-neural plate marker (Okuda et al., 2006). tfap2c expression is absent from cells immediately lateral to the neural plate, which is the pnc domain (arrowhead). H A transverse section of an embryo labeled as in F. tfap2c (blue) is expressed at high level in the ppr and nne, lateral to foxd3 expression (red) in pnc. I–L Dorsal and lateral views of embryos at the indicated ages processed to reveal tfap2c. I In the head, and J, trunk at 24 hpf, expression of tfap2c is detected in surface ectoderm and diencephalon (arrowhead). K At 36hpf, tfap2c expression is reduced in surface ectoderm; L at 48 hpf, high level tfap2c expression is detected in the eye. Scale bars: A–G, I–L, 100 microns; F′–H, 50 microns.
Simultaneous reduction of Tfap2a and Tfap2c has non-additive effects
To determine whether Tfap2c is required for early zebrafish development, we injected embryos with an antisense morpholino oligonucleotide (MO) targeting the tfap2c exon 3 splice donor site (i.e., e3i3 MO) (Fig. 2A). RT-PCR and sequencing of the major aberrant splice product revealed that e3i3 MO causes a deletion of 38 nucleotides, resulting in a frame shift and a severe truncation of the predicted protein, eliminating the DNA binding domain (Fig. 2A,B). However, wild-type zebrafish embryos injected with this tfap2c MO developed with normal morphology, pigmentation, and craniofacial cartilage (Fig. 2E, 3C,G).
Figure 2.
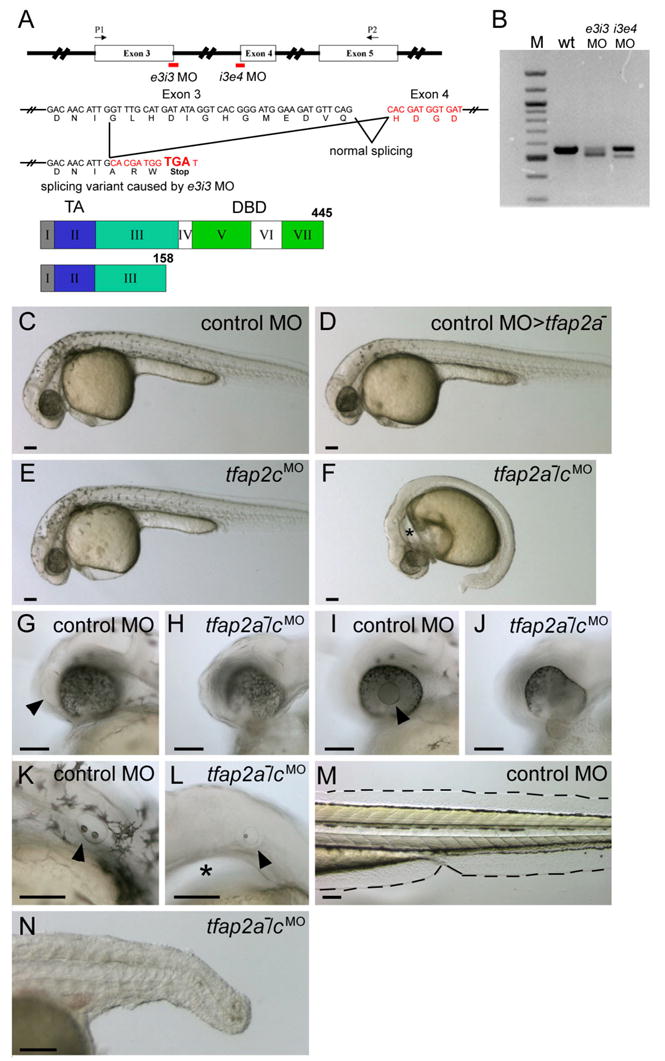
tfap2a mutant embryos injected with tfap2c morpholino (MO) display abnormal development in ectoderm-derived tissues. A Top, schematic of the tfap2c gene showing the position of MOs used in this study; middle, effects of the tfap2c e3i3 MO on the tfap2c transcript; bottom, the Tfap2c protein. Roman numerals refer to exons, numbers refer to amino acids. TA, transactivation domain. DBD, DNA binding domain. e3i3 MO targeting the exon 3 splice donor site and i3e4 MO targeting the exon 4 splicing acceptor site are shown in red. P1 and P2 are the primers used for the RT-PCR shown in B. tfap2c e3i3 MO causes a deletion of 38 nucleotides, which leads to a frame shift and introduces a stop codon at the end of exon 3. B tfap2c RT-PCR results. Amplification of cDNA from uninjected wild-type embryos (wt) with the primers P1 and P2 shown in A yielded a single band of the expected size of 557 bp, while amplification of 24 hpf cDNA from tfap2c e3i3 MO injected embryos (e3i3 MO) yielded a smaller band of 519 bp. Amplification of cDNA from tfap2c i3e4 MO injected embryos (i3e4 MO) also yielded a smaller band. M, 100 bp ladder. C–F Lateral views of live embryos at 28 hpf. In C, a wild-type embryo injected with standard control MO (hereafter, control embryo) with normal morphology and pigmentation. In D, a control MO-injected tfap2a homozygous mutant embryo displaying normal morphology but reduced number of melanophores. In E, a wild-type embryo injected with tfap2c e3i3 MO with normal morphology and pigmentation. F A tfap2a homozygous mutant embryo injected with tfap2c e3i3 MO (hereafter, tfap2a−/cMO embryo), with no visible pigmentation, an absence of yolk extension, a poorly extended tail, and edema ventral to the hindbrain (asterisk). G–L Lateral views of the embryos shown in C and F at higher magnification. Olfactory placode (arrowhead in G) and lens (arrowhead in I) are visible in the control embryo but not in the tfap2a−/cMO embryo (H, J) which also displays malformation of the ventral retina. Otic vesicle in K, the control embryo, contains two otoliths (arrowhead). While in L, the tfap2a−/cMO embryo, it is reduced in size and contains a single otolith (arrowhead). An enlarged view of the edema ventral to the hindbrain is also seen (asterisk). M, N Lateral views of the same embryos shown in C and F at 72 hpf. Medial fin folds, as outlined in M, the control embryo, are virtually absent in N, the tfap2a−/cMO embryo. Notochord and somites also appear abnormal, presumably due to indirect effects, because tfap2a and tfap2c expression are not detected in these tissues. Scale bars: 100 microns.
Figure 3.
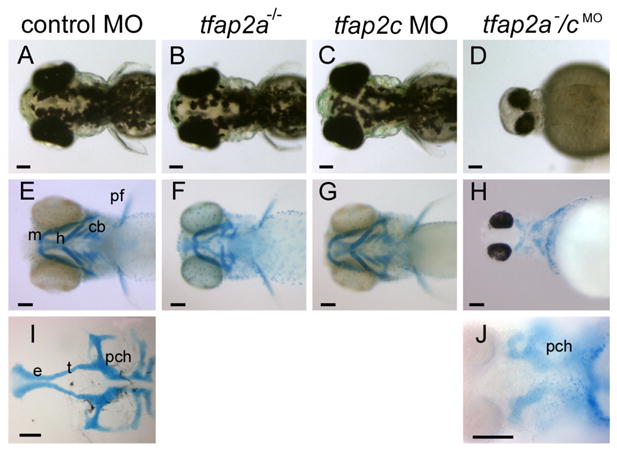
tfap2a/c deficient embryos display non-additive defects in pigmentation and jaw morphology. A–D Dorsal views of live 72 hpf embryos. A Melanophores are abundant on the dorsal aspect of the head in a control-MO injected wild-type embryo, slightly reduced in B, a control MO-injected tfap2a mutant, normal in C, a tfap2c MO-injected wild-type embryo, but absent from D, a tfap2a−/cMO embryo (6 of 6 tfap2a−/cMO embryos). E–H Ventral views of 4 dpf embryos processed to reveal cartilage (alcian green), and bleached to remove pigment (except H). E Cartilages derived from mandibular (1st arch, m), hyoid (2nd arch, h), and ceratobranchial (3rd–7th arches, cb) arches are seen in a control embryo. Pectoral fin (pf) is also visible. F A control MO-injected tfap2a homozygous mutant embryo, with normal sized mandibular, but severely reduced hyoid and ceratobranchial cartilages, as previously reported (Schilling et al., 1996). G A tfap2c MO-injected wild-type embryo, in which all craniofacial cartilages appear normal. H A tfap2a−/cMO embryo, in which ventral craniofacial cartilage elements and pectoral fin are absent (10 of 10 tfap2a−/cMO embryos). I Ventral view of dissected neurocranium from a control embryo. J Ventral view of a tfap2a−/cMO embryo, shown at higher magnification, only the mesoderm-derived posterior neurocranium is visible (10 of 10 tfap2a−/cMO embryos). e, ethmoid plate; pch, parachordal; t, trabeculae cranii (Schilling et al., 1996). Scale bars: 100 microns.
The similar expression patterns of tfap2a and tfap2c in early embryos, and the similar binding specificity of Tfap2a and Tfap2c in mammals (Bosher et al., 1996; McPherson and Weigel, 1999) and amphibians (Zhang et al., 2006), suggested that Tfap2a might compensate for lack of Tfap2c in embryos injected with tfap2c MO. To test this model, we injected embryos derived from tfap2a heterozygous parents with tfap2c e3i3 MO. One fourth of the embryos in this clutch showed striking defects, detailed below, and a PCR-based genotyping assay confirmed that the severely-affected embryos were the tfap2a homozygous mutants (Genotyping data presented in Supplementary Fig. S1) (100% of the tfap2a mutants, n = 7, and 0% of the wild-type and heterozygous siblings, n= 24, displayed the morphological phenotypes described below). By contrast, tfap2a mutants injected with a control MO were indistinguishable from uninjected tfap2a mutants. To confirm that tfap2c e3i3 MO-induced phenotypes resulted from effects on the tfap2c transcript, rather than on an alternative transcript with fortuitous sequence similarity, we designed an independent MO targeting the exon 4 splice acceptor site of the tfap2c gene (i.e., i3e4 MO). We performed RT-PCR and found that the i3e4 MO also disrupted tfap2c splicing (Fig. 2B). Injection of tfap2c i3e4 MO into wild-type embryos had no effect on morphology, but in one fourth of embryos derived from tfap2a heterozygous parents, it caused the array of phenotypes described below (7 of 30 i3e4 MO-injected embryos, not shown). 10 of 12 embryos co-injected with tfap2a MO and tfap2c MO also showed the same morphological features (Supplementary Fig. S1). These findings suggest Tfap2a and Tfap2c have partially redundant function in zebrafish embryogenesis.
We observed a range of morphological defects in live tfap2a homozygous mutant embryos injected with tfap2c e3i3 MO (hereafter, tfap2a−/cMO embryos). tfap2a−/cMO embryos can be readily distinguished from siblings by 20 hpf based on a lack of the yolk extension (not shown). In tfap2a−/cMO embryos at 28 hpf the yolk extension and tail were foreshortened, and an edema was present ventral to the pharyngeal arches (Fig. 2F,L). Lens and olfactory placodes were either not detectable or highly reduced in size, and the retinas exhibited abnormal morphology (Fig. 2H,J); these structures appeared normal in control MO-injected wild-type or tfap2a mutant embryos (Fig. 2G,I, and not shown). Otic vesicles in tfap2a−/cMO embryos were highly reduced in size, but always discernible, and usually contained a single otolith (Fig. 2L). Otic vesicles in control embryos and tfap2a mutants virtually always contained two otoliths at this stage (Fig. 2K and not shown) (Solomon and Fritz, 2002). Medial fin folds, which are derived from epidermis and contain mesenchymal cells of neural crest origin (Smith et al., 1994), were normal in control MO-injected wild type (Fig. 2M) and tfap2a mutant embryos (not shown), but were severely shrunken in tfap2a−/cMO embryos (Fig. 2N). Pectoral fins, which also appeared normal in tfap2a mutants (Fig 3 F), were reduced or absent in tfap2a−/cMO embryos (Fig. 3H). In control MO-injected tfap2a mutants, melanophores and iridophores were moderately reduced in number, and xanthophores were present (Fig. 3B and not shown) (Knight et al., 2004); by contrast, tfap2a−/cMO embryos lacked pigment cells of all types (Fig. 3D, and not shown). In tfap2a mutant embryos, cartilages derived from the hyoid arch (arch 2) and the ceratobranchial arches (arches 3–7) were reduced to various extents, whereas cartilage elements derived from the first arch (Meckel’s and palatoquadrate) were relatively unaffected (Barrallo-Gimeno et al., 2004; Knight et al., 2003) (Fig. 3F). By contrast, in tfap2a−/cMO embryos cartilage from all arches was absent, while the posterior neurocranium, which is mesoderm-derived, remained (Fig. 3H,J). In summary, wild-type embryos injected with tfap2c MO developed normally until at least 4 dpf, while tfap2a−/cMO embryos displayed defects far exceeding those detected in tfap2a mutants.
Neural crest derivatives are absent, and placode derivatives reduced in tfap2a/c-deficient embryos
We assessed the presence of other neural crest and placode derivatives by virtue of characteristic gene expression. Neurons of cranial ganglia are derived from both of these precursor populations (D’Amico-Martel and Noden, 1983). In tfap2a mutants, there is severe reduction or loss of neurons in epibranchial, distal enteric, and anterior lateral line ganglia, a more modest reduction of neurons in trigeminal and dorsal root ganglia, and apparently normal numbers of neurons in posterior lateral-line, vagal, and sympathetic ganglia (Barrallo-Gimeno et al., 2004; Holzschuh et al., 2003). In tfap2a−/cMO embryos, there was a more extreme loss of neurons in peripheral ganglia, such that trigeminal, vagal, sympathetic, proximal enteric, and dorsal root ganglia were all highly reduced in size or absent (Fig. 4B,D,F,H,J). Neural crest-derived glial cells –including satellite cells in cranial ganglia and Schwann cells associated with lateral line processes, both of which are characterized by foxd3 expression (Kelsh et al., 2000)– were completely absent from tfap2a−/cMO embryos (Fig. 4L,N). The migrating lateral line primordium, which is placode derived, was absent from tfap2a−/cMO embryos at 28 hpf, as determined by eya1 expression (Kozlowski et al., 2005) (Fig. 4P). Neuromasts, which derive from the lateral-line primoridium and can be detected by DASPEI labeling of hair cells, were absent in tfap2a−/cMO embryos at 3 dpf (Fig. 4R) (Harris et al., 2003). Finally, consistent with abnormal olfactory placode morphology (Fig. 2H), eya1 expression in olfactory placode was highly reduced in tfap2a−/cMO embryos at 28 hpf (Fig. 4T). In summary, neural crest derivatives were absent in tfap2a−/cMO embryos, and placode derivatives were absent or severely reduced in size.
Figure 4.
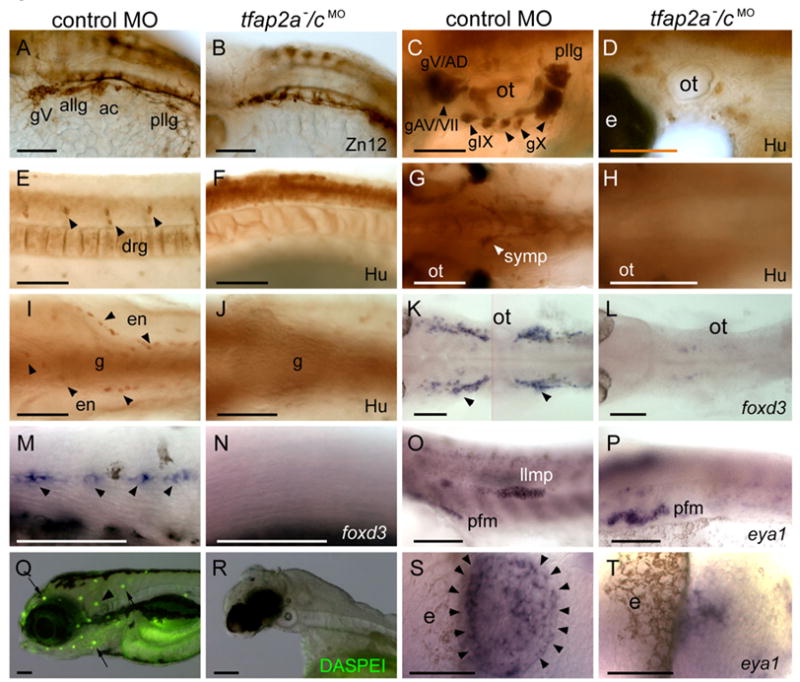
Neural crest and placode derivatives are absent or reduced in tfap2a/c deficient embryos. A, B Lateral views of 28 hpf embryos processed for anti-HNK1 (Zn12 antibody) immunoreactivity (IR), revealing the presence of cranial ganglia neurons in A, a control MO injected wild-type embryos, and their absence in B, a tfap2a−/cMO embryo (9 of 10 tfap2a−/cMO embryos). C–F Lateral and G–J ventral views of 72 hpf embryos processed for anti-Hu IR. C, E, G, I In control embryos anti-Hu IR reveals C, cranial ganglia surrounding the otic vesicle (ot), E, dorsal root ganglia (drg) in the trunk, G, sympathetic neurons at vagal level, and I, proximal enteric neurons, adjacent to gut (g), also at vagal level. D, F, H, J All of these neurons appear to be absent from a tfap2a−/cMO embryo (8 of 8 tfap2a−/cMO embryos). K, L Dorsal and M, N, lateral views of 28 hpf embryos processed to reveal foxd3 expression, which labels K, satellite cells (arrowheads) and M, Schwann cells associated with lateral line processes (arrowheads) in a control embryo, but not in L, N, a tfap2a−/cMO embryo (12 of 12 tfap2a−/cMO embryos). O, P Lateral views of 28 hpf embryos processed to reveal eya1 expression, which is detected in the migrating lateral line migrating primordium (llmp) in O, a control embryo, but absent in P, a tfap2a−/cMO embryo (11 of 11 tfap2a−/cMO MO embryos). eya1 expression in presumed pectoral fin mesoderm (pfm) remains normal in the tfap2a−/cMO MO embryo (11 of 11 tfap2a−/cMO MO embryos). Q, R Lateral head views of 4 dpf embryos incubated in DASPEI, which is taken up by hair cells. In Q, a control embryo, DASPEI-positive hair cells in the inner ear (arrowhead) and the neuromasts (arrows) are visible. In R, a tfap2a−/cMO embryo, DASPEI positive cells are not seen. S, T Dorsal anterior views of 28 hpf embryos processed to reveal eya1 expression. eya1 expression in olfactory placode is apparent in S, a control embryo. In R, a tfap2a−/cMO embryo, a small cluster of eya1-expressing cells is present in this position (11 of 11 tfap2a−/cMO embryos). gV, trigeminal ganglion; allg, anterior lateral line ganglion; ac, acoustic ganglion; pllg, posterior lateral line ganglion; gAD, anterodorsal lateral line ganglion; gAV, anteroventral lateral line ganglion; gVII, facial sensory ganglion; gIX, glossopharyngeal ganglion; gX, vagus ganglion; e, eye; ot, otic vesicle. Scale bars: A–R, 100 microns; S, T, 50 microns.
Simultaneous reduction of Tfap2a and Tfap2c eliminates the neural crest but not the pre-placodal domain
We speculated that redundant activity of Tfap2a and Tfap2c (hereafter referred to as Tfap2a/c activity) was required for induction or maintenance of neural crest. In tfap2a mutants, expression of dlx2 in migratory neural crest is highly reduced in all but the first pharyngeal arch; however, early expression of most neural crest markers appears to be normal, except crestin expression is absent and foxd3 expression is reduced specifically in hindbrain neural crest (Knight, et al. 2003). In tfap2a−/cMO embryos, we found expression of dlx2 and sox10 in migratory neural crest was absent in the trunk and in all pharyngeal arches (Fig. 5B,D). In addition, foxd3 expression at 11 hpf in premigratory neural crest was absent from about one fourth of a clutch of embryos derived from tfap2a heterozygous parents and injected with tfap2c e3i3 MO (7 of 26 embryos, not shown). To facilitate further evaluation of tfap2a/c-deficient embryos at early stages, we employed a morpholino targeting the exon 2 donor site of tfap2a (i.e., tfap2a e2i2 MO). We have previously shown that embryos injected with this MO closely resemble tfap2a homozygous mutant embryos (O’Brien et al., 2004). We found that embryos injected with both tfap2a e2i2 MO and tfap2c e3i3 MO (hereafter, tfap2aMO/cMO embryos) recapitulate all of the morphological features of tfap2a−/cMO embryos (95%, n = 100 embryos, not shown). Expression of foxd3, sox9b, sox10, and snai1b in pre-migratory neural crest was eliminated in tfap2aMO/cMO embryos (Fig. 5, Supplementary Fig. S2, and not shown). By contrast, expression of the neural plate border markers pax3, msxb, and zic2b was normal in tfap2aMO/cMO embryos (Fig. 5 and not shown), and in all embryos derived from tfap2a heterozygous parents and injected with tfap2c e3i3 MO (not shown, n = 40 or more embryos examined for each gene). These findings implicate Tfap2a/c activity in neural crest induction, and place it in parallel to or possibly downstream of Pax3, Zic2b, and Msxb, and upstream of Foxd3, Sox9, Sox10, and Snai1b activities.
Figure 5.
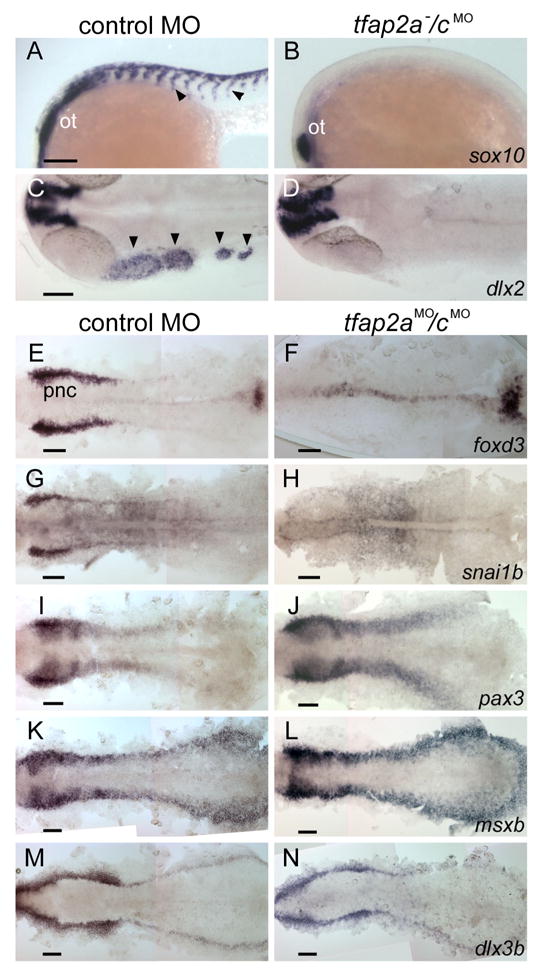
Gene expression characteristic of neural crest is absent, but of the neural plate border and pre-placodal region is present in tfap2a/c deficient embryos. A, B Lateral views of 22 hpf embryos processed to reveal sox10 expression, which is present in migratory neural crest streams (arrowheads) and the otic vesicle (ot) in A, a control embryo; in B, a tfap2a−/cMO embryo, it is only present in the ot (11 of 11 tfap2a−/cMO embryos). C, D Dorsal views of 24 hpf embryos processed to reveal dlx2 expression, which is present in cranial migratory neural crest streams (arrowheads) and brain in C, a control embryo, but only in the latter in D, a tfap2a/c deficient embryo (10 of 10 tfap2a−/cMO embryos). E–N Dorsal views of flat-mounted, 11 hpf embryos processed to reveal the indicated markers. foxd3 and snai1b expression that are characteristic of premigratory neural crest (pnc) cells are absent in embryos injected with tfap2a e2i2 MO and tfap2c e3i3 MO (hereafter, tfap2aMO/cMO embryo) (foxd3, 27 of 27 tfap2aMO/c MO embryos; snai1b, 29 of 29 tfap2aMO/cMO embryos. Also not shown, at the same stage, sox10, 29 of 29 tfap2aMO/cMO embryos). Expression of pax3, msxb and dlx3b expression appear normal in tfap2aMO/cMO embryos (100%, n is greater or equal to 30 tfap2aMO/cMO embryos for each gene, also not shown, zic2b). Scale bars: 100 microns.
The defects in the sensory placodes of tfap2a−/cMO embryos suggested a failure in specification of the pre-placodal domain. However, the expression of dlx3b and eya1 genes, which are both markers of the pre-placodal domain in wild-type embryos (Akimenko et al., 1994; Kozlowski et al., 2005), was normal in tfap2aMO/cMO embryos (Fig. 5N and Supplementary Fig. S2) and all tfap2c MO-injected embryos derived from tfap2a heterozygous parents (not shown, n = 40 or more embryos or each gene). These results suggest that Tfap2a/c activity is required for a step, or steps, that occur during the development of placodal derivatives subsequent to the establishment of the pre-placodal domain.
Rohon-Beard sensory neurons are reduced but not absent in tfap2a/c deficient embryos
Rohon-Beard sensory neurons (RBs) reside in the dorsal spinal cord but derive from the same neural plate domain as neural crest (Cornell and Eisen, 2000; see also Jacobson, 1991). Mutants with defective Delta/Notch signaling have supernumerary RBs but lack trunk neural crest, suggesting that RBs derive from precursor cells that are also competent to become trunk neural crest, i.e., RB/NC precursors (Cornell and Eisen, 2000; Cornell and Eisen, 2002). These data suggest the default fate for RB/NC precursors is RB, but when RB/NC precursors are exposed to the cell-surface ligand Delta, which is expressed on nascent RBs, they adopt the alternate fate of neural crest. Inhibition of ngn1 in Delta/Notch pathway mutants will substitute for Delta signaling in RB/NC precursors, thereby eliminating RBs and restoring trunk neural crest in these mutants (Cornell and Eisen, 2002).
RBs were reported to be slightly reduced in tfap2a mutants (Knight et al., 2004), and our expectation was that like neural crest they would be absent from tfap2a/c deficient embryos. RBs are characterized by expression of tlxA at 20 hpf (Andermann and Weinberg, 2001). We injected control MO or tfap2c MO into embryos derived from tfap2a heterozygotes, fixed and processed embryos at 20 hpf, and counted tlxA-positive cells. We found that tfap2a−/cMO embryos, which could be recognized by their characteristic morphology, contained about 60% of the average number of RBs in control MO-injected embryos, i.e., both tfap2a mutants and their siblings (tfap2a mutants could not be un-ambiguously identified based on their phenotype of reduced RBs) (Fig. 6 A–C). To confirm that reduction of Tfap2a/c activity has a more severe impact on neural crest cells than RBs, we processed 12 hpf embryos derived from tfap2a heterozygous parents injected with tfap2c MO to reveal foxd3 mRNA and anti-Islet IR (a marker of RBs) simultaneously. One fourth of these, presumed to be tfap2a−/cMO embryos, were completely devoid of foxd3 expression (Fig. 6E), yet had residual RBs (Fig. 6E,E′). The transcription factor Prdm1/Blimp1 is implicated in the early development of neural crest and RBs (Artinger et al., 1999; Hernandez-Lagunas et al., 2005; Roy and Ng, 2004). In contrast to neural crest marker expression, which was absent, and neural plate border expression, which was normal, prdm1 expression was highly reduced but not completely absent in tfap2aMO/cMO embryos (not shown) and in about one fourth of embryos derived from tfap2a heterozygous parents injected with tfap2c MO (Fig. 6 G,G′). These findings are consistent with prdm1 being expressed in Tfap2a/c-dependent RB/NC precursors, and in a previously unknown cell type, Tfap2a/c-independent RB precursor cells (Fig. 10, see Discussion).
Figure 6.
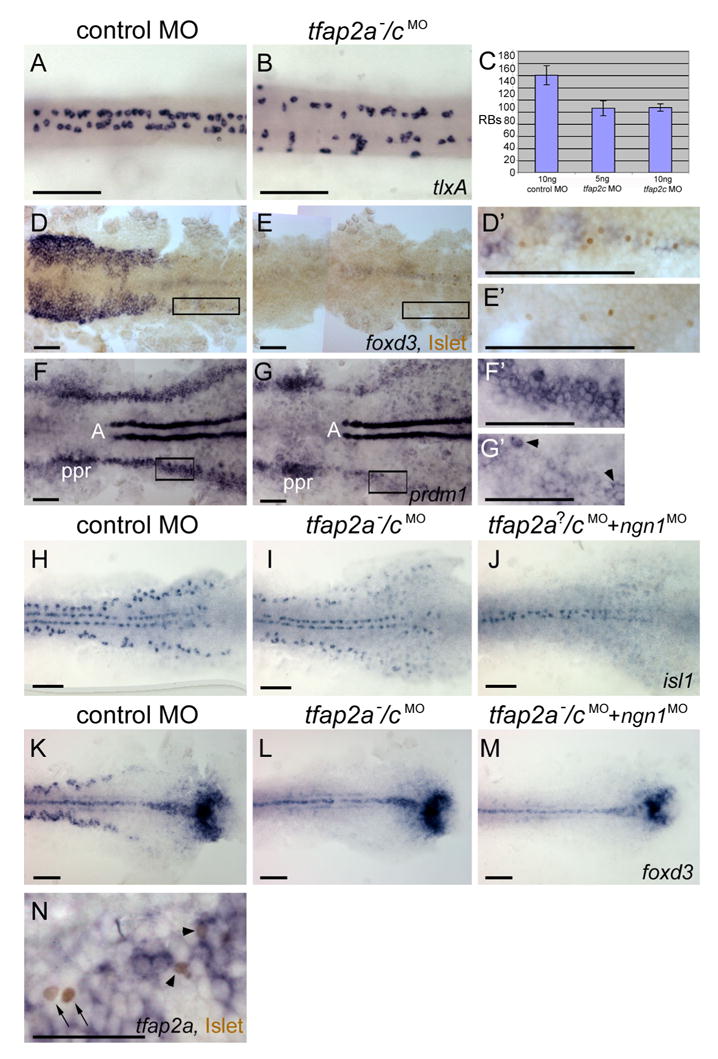
Rohon-Beard sensory neurons (RBs) are reduced but not absent in tfap2a/c deficient embryos. A, B Dorsal trunk views of 20 hpf embryos processed to reveal tlxA expression, anterior to the left. RBs are abundant in A, a wild-type or tfap2a mutant embryo, but moderately reduced in B, a tfap2a−/cMO embryo. Note that RBs are abnormally distributed in the latter, suggestive of abnormal patterning in the dorsal neural tube. C The average number of tlxA-positive cells in the dorsal spinal cord at 20 hpf. Error bars indicate standard deviation. Left column, embryos derived from tfap2a heterozygous mutants and injected with control MO, n = 23 embryos. Middle column, tfap2a mutants injected with 5 ng tfap2c e3i3 MO, n = 5 embryos. Right column, tfap2a mutants injected with 10 ng tfap2c e3i3 MO, n = 8 embryos. D, E Dorsal views of flat mounted 12 hpf embryos stained for anti-Islet immunoreactivity (brown, nuclear) and foxd3 mRNA (purple, cytoplasmic), anterior to the left. Premigratory neural crest (pnc) cells expressing foxd3 and RBs expressing antiIslet IR are present in D, a control embryo. RBs and pnc cells are intermingled, as seen at higher magnification in D′ (corresponds to box in D). In E, a presumed tfap2a−/cMO embryo, foxd3 expression is absent while RBs are still present, as shown at higher magnification in E′ (11 of 40 injected embryos derived from tfap2a heterozygous mutants). F, G Dorsal views of flat mounted 11 hpf embryos processed to reveal prdm1 expression, anterior to the left. In F, a control embryo, prdm1 expression is detected in the pre-placodal region (ppr), in the neural plate boundary in the trunk (F′ corresponds to box in F), and in adxial cells (A). G, In a presumed tfap2a−/cMO embryo, prdm1 is expressed in scattered cells at the neural plate border (arrowheads) (G′ corresponds to box in G) (7 of 29 injected embryos derived from tfap2alow heterozygotes). H–M Dorsal trunk views of flat mounted 12.5 hpf embryos. isl1 (H) and foxd3 (K) expression shown in control embryos. I, In the presumed tfap2a−/cMO embryos, isl1 expression is moderately reduced (16 of 56 injected embryos derived from tfap2alow heterozygotes), while foxd3 expression is absent (L, 12 of 58 injected embryos derived from tfap2alow heterozygotes). J In an embryo derived from tfap2a heterozygous mutant parents and co-injected with tfap2c e3i3 MO and ngn1 MO, isl1 expression in lateral neural plate, indicating RBs, is absent (48 of 51 tfap2c MO and ngn1 MO injected embryos). M In a presumed tfap2a mutant injected with tfap2c MO and ngn1 MO, foxd3 expression is absent (M, 16 of 53 injected embryos derived from tfap2alow heterozygotes). N Dorsal view of a 12.5 hpf embryo processed to reveal anti-Islet IR (brown, nuclear) and tfap2a mRNA (purple, cytoplasmic), anterior to the left. Some RBs that are positive for anti-Islet IR also express tfap2a (arrowheads). There are also RBs that are devoid of tfap2a expression in the cytoplasm (arrows). Scale bars: AM, 100 microns; N, 50 microns.
Figure 10.
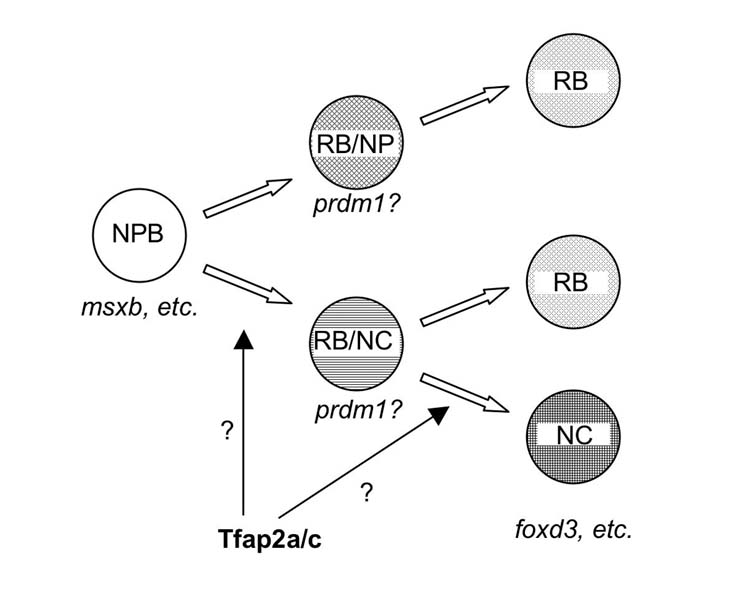
Model for the role of Tfap2a/c activity in specification of trunk neural crest and RBs. At cranial levels, Tfap2a and Tfap2c, acting redundantly in neural plate border precursor (NPB) cells and in concert with other transcription factors expressed in these cells (Msx, Pax, and Zic family members), specify neural crest. At trunk levels, Tfap2a/c activity specifies RB/neural crest (NC) precursor cells, which may be identified by expression of prdm1. In tfap2a/c deficient embryos, RB/NC precursors are lost, resulting in the loss of NC, which is characterized by expression of foxd3, snai1b, sox10, and other genes, and a subset of RBs. The RBs that remain in tfap2a/c deficient embryos derive from a hypothetical precursor cell with potential to become RB and other unidentified neural plate (NP) cells (i.e., the RB/NP precursor). The RB/NP precursor cell may also be characterized by prdm1 expression. Alternatively in the trunk, Tfap2a/c activity governs specification of NC from RB/NC precursors, in which case all RBs may derive from RB/NC precursors.
We considered that the presence of RBs and prdm1 expression in tfap2a/c-deficient embryos might merely reflect incomplete suppression of Tfap2a/c activity. Residual Tfap2a/c activity might suffice to promote induction of a few RB/NC precursors. If these were sparsely distributed they might not receive a Delta signal and therefore would be expected to adopt the RB fate. A prediction of this model is that the number of RBs present should be highly dependent on the thoroughness of the knockdown of tfap2a and tfap2c. To test this prediction, we used tfap2a mutants and injected either twice (5 ng) or 4 times (10 ng) the amount of tfap2c e3i3 MO necessary to eliminate foxd3 expression (2.5 ng), and counted RBs at 20 hpf. The number of RBs in tfap2a mutants injected with either dose of tfap2c MO was the same (Fig. 6C), i.e., about 60% of the number present in control embryos, arguing against the possibility that poor distribution of tfap2c MO explains the presence of residual RBs in tfap2a−/cMO embryos. A second prediction of the model that RBs in tfap2a/c deficient embryos derive from RB/NC precursors that fail to receive a Delta signal is that inhibition of ngn1 should convert these residual RBs to neural crest. We injected ngn1 MO (ngn1 MO) and tfap2c MO into embryos derived from tfap2a mutant parents. At 12 hpf, as expected, all such embryos lacked isl1 expression in lateral neural plate, reflecting the requirement for Ngn1 in RB development (Fig. 6J) (Andermann et al., 2002; Cornell and Eisen, 2002). Significantly, one fourth of similarly treated embryos utterly lacked foxd3 expression, that is, we did not observe expression of foxd3 in place of RBs as predicted by this model (Fig 6M). Together these results argue against the possibility that residual RBs in tfap2a/c deficient embryos are derived from RB/NC precursors.
An alternative model is that there are distinct subsets of RBs, i.e., Tfap2a/c-dependent and -independent subsets. Genetically distinct subsets of RBs might be expected to have distinct expression profiles; specifically, the Tfap2a/c-independent subset might never express tfap2a. Consistent with this possibility, in 12.5 hpf embryos processed to reveal anti-Islet IR and tfap2a mRNA we detected unambiguous examples of Islet-IR-positive RBs that expressed tfap2a and those that did not (Fig. 6N). This result supports the existence of a Tfap2a/c-independent class of RBs (See Discussion).
Requirement for Tfap2a/c in neural crest induction is cell autonomous
To determine whether the requirement for Tfap2a/c in neural crest induction is cell-autonomous, we created genetic chimeras with blastula transplants. First, we transplanted cells from 4 hpf wild-type donors injected with a lineage tracer into wild-type host embryos. At 12 hpf, we processed embryos to reveal the lineage tracer in brown and foxd3 expression in blue. Double-labeled donor-derived cells were readily distinguished from host-derived cells expressing foxd3 singly (Fig. 7A,A′). Next, we repeated this experiment but used host embryos born of tfap2a heterozygous parents and injected with tfap2c MO. In tfap2a−/cMO hosts at 12hpf, which were identified by a severe reduction of foxd3 expression, all cells expressing foxd3 were donor-derived (with one exception out of the 151 foxd3-expressing cells scored) (Fig. 7B,B′). In similar chimeras grown to 48 hpf, made with wild-type donors and tfap2aMO/cMO hosts, virtually all melanophores were found to contain lineage tracer (Fig. 7 D,D′). These findings indicate that bona fide neural crest can develop from wild-type cells that are flanked by tfap2a/c-deficient non-neural ectoderm. We conducted the same experiment in reverse, using tfap2a−/cMO donors (determined by raising donors to 28 hpf after the transplant procedure) and wild-type hosts. In such chimeras, donor-derived cells were never found to express foxd3 (Fig. 7C,C′), and in similar experiments, using a host strain that lacks melanophores to facilitate identification of donor-cell derived melanophores, tfap2a/c-deficient donor cells were never found to become melanophores (Supplementary Fig. S3). These results show that even when flanked by wild-type non-neural ectoderm, Tfap2a/c deficient cells were not competent to become neural crest. Together these transplant studies strongly support a cell-autonomous requirement for Tfap2a/c activity in neural crest induction.
Figure 7.
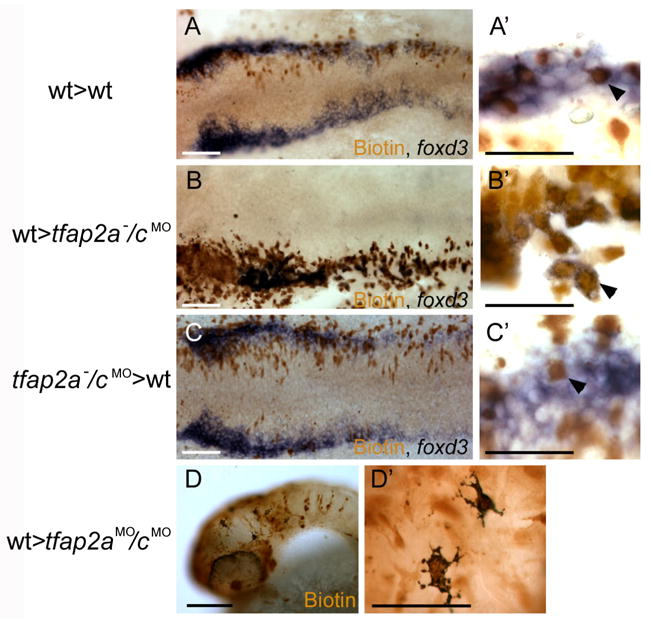
Chimera experiments suggest requirement for Tfap2a/c activity in neural crest induction is cell autonomous. A–C Dorsal views of flat mounted 12 hpf embryos. A A chimera derived from a wild-type host and a wild-type donor. Biotin-labeled, donor derived cells are seen to express foxd3 (arrowhead in A′) (a total of 40 biotin-labeled foxd3-expressing cells were found, 3 embryos scored). B A chimera derived from a tfap2a−/cMO host and a wild-type donor. Biotin-labeled, donor derived cells expressing foxd3 are visible (arrowhead in B′) (150 of 151 foxd3-expressing cells were also biotin-labeled, 5 embryos scored). C A chimera derived from a wild-type host and a tfap2a−/cMO donor embryo. A biotin-labeled, foxd3 negative cell is seen interspersed with host cells expressing foxd3 (shown at higher magnification in C′, arrowhead) (of 95 biotin-labeled cells within the host foxd3 domain, none expressed foxd3, 6 embryos scored). D Lateral view of a 48 hpf a chimera derived from a tfap2aMO/cMO host and a wild-type donor. Melanophores are visible in the head. As seen at higher magnification in D′, melanophores are labeled with biotin, indicating that they are donor-derived (Out of 30 such chimeras that survived to 48 hpf, 11 had at least 5 or more biotin-positive melanophores and lacked melanophores without biotin). Scale bars: A, B, C, D, 100 microns; A′, B′, C′, D′, 50 microns.
Tfap2a/c required for neural crest specification
An absence of neural crest in tfap2a/c-deficient embryos was consistent with several possible roles for Tfap2a/c activity in neural crest development, including promotion of neural crest survival, proliferation, specification, or a combination of these. To test for a role for Tfap2a/c in neural crest survival, we fixed control and tfap2aMO/cMO embryos at 11 hpf and processed them for TUNEL, a marker of apoptotic cell death. We did not detect a gross increase in TUNEL-positive cells in tfap2aMO/cMO embryos(Fig. 8A,B), although we recognized that a small or highly localized increase in TUNEL-positive cells might have been difficult to detect. Therefore, we incubated control and tfap2aMO/cMO embryos in the pan-caspase inhibitor, zVAD-fmk (Hsieh et al., 2003; Williams et al., 2000). We found this treatment drastically reduced levels of cell death in both populations, but it did not rescue foxd3 expression in the latter (Fig. 8C–F). We conclude that excessive cell death is unlikely to account for the absence of neural crest in tfap2a/c-deficient embryos.
Figure 8.
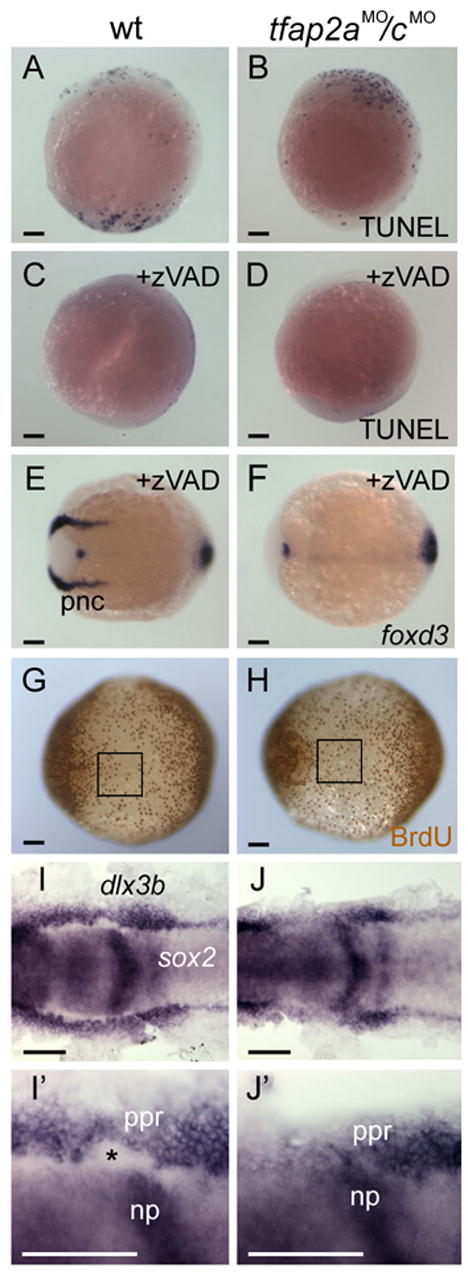
Loss of neural crest in tfap2a/c deficient embryos is concomitant with an expansion of neural plate. A–D Lateral views, dorsal to the right, of either uninjected wild type or tfap2aMO/cMO embryos fixed at 11hpf and processed to reveal dying cells with TUNEL. A wild-type embryo and a tfap2aMO/cMO embryo have comparable numbers of TUNEL-positive cells [control embryos, 62 ± 70 (average ± standard deviation), n = 13; tfap2aMO/cMO embryos, 42 ± 38, n = 28; unpaired t test, p = 0.23]. C A wild-type embryo, and D, a tfap2aMO/cMO embryo, after treatment with caspase inhibitor zVAD-fmk. Reduced levels of cell death are seen in both of them (control embryos, 10 ± 14, n = 19, p < 0.005 in comparison to untreated controls; tfap2aMO/cMO embryos, 17 ± 13, n = 18, p < 0.05, in comparison to untreated tfap2aMO/cMO embryos). Dorsal views, anterior to the left, of E, a wild-type embryo, and F, a tfap2aMO/cMO embryo treated with zVAD-fmk and processed to reveal foxd3 expression at 11 hpf. foxd3 expression is absent in the premigratory neural crest (pnc) domain of the zVAD treated tfap2aMO/cMO embryo (30 of 30 zVAD treated tfap2aMO/cMO embryos). G, H Ventral views, anterior to the left, of embryos incubated in BrdU for 20 minutes at 10 hpf, fixed at 11 hpf, and stained for anti-BrdU IR. The number of anti-BrdU IR positive cells within a 200x200 μm region of ventral ectoderm (boxes in G and H) was comparable in both groups (control embryos, 37 ± 6 anti-BrdU IR positive cells, n = 9 embryos; tfap2aMO/cMO embryos, 35 ± 7 anti-BrdU IR positive cells, n = 9 embryos; unpaired t test, p = 0.48). I, J Dorsal views of 11 hpf embryos processed to reveal sox2 expression, labeling neural plate (np), and dlx3b expression, labeling the pre-placodal region (ppr). I′, J′ Close-up views of right side of embryos shown in I and J, respectively. The space between these two expression domains, normally occupied by premigratory neural crest (asterisk in I′), is absent in the tfap2aMO/cMO embryo (J, 30 of 32 tfap2aMO/cMO embryos). Scale bars: A–J, 100 microns; I′, J′, 50 microns.
To test for a role for Tfap2a/c in promoting proliferation, we used BrdU incorporation to label cells in S-phase in tfap2aMO/cMO embryos. Because neural crest is not detectable in these embryos, we counted BrdU-positive cells in non-neural ectoderm, which expresses tfap2a and tfap2c. We did not detect a significant difference in the number of BrdU-labeled cells between control and tfap2aMO/cMO embryos (Fig. 8 G,H). While it is possible that Tfap2a/c is required for proliferation of neural crest, we note that if this were its only function in neural crest, we would have expected tfap2a/c deficient cells to express foxd3 when transplanted into the neural crest domain of control embryos, which was not observed (Fig. 7C,C′).
We reasoned that if Tfap2a/c activity was required for neural crest specification, prospective neural crest cells would adopt an alternative fate in tfap2a/c-deficient embryos. We found that wild-type embryos fixed at 11 hpf and processed to reveal sox2, a marker of the neural plate (Okuda et al., 2006), and dlx3b, a marker of the preplacodal domain (Akimenko et al., 1994), exhibit a patch of unlabeled cells between these two expression domains which we presume to be neural crest (Fig. 8I,I′). However, in tfap2aMO/cMO embryos, this space is absent (Fig. 8J,J′). Because dlx3b expression is unchanged in tfap2aMO/cMO embryos (Fig. 5N), this finding suggests that presumptive neural crest converts to neural plate in tfap2a/c-deficient embryos, and thus that Tfap2a/c activity is necessary to assign ectoderm cells to the neural crest lineage.
Overexpression of tfap2a induces ectopic neural crest
As a positive test of the ability of Tfap2-type activity to induce neural crest we conducted a misexpression experiment. We found that injection of RNA encoding full-length Tfap2a into tfap2aMO/cMO embryos efficiently rescued foxd3 expression at 11 hpf (Supplementary Fig. S4). Injection of tfap2a mRNA into wild-type embryos expanded neural crest expression of foxd3 (not shown), although abnormal gastrulation in these embryos complicated interpretation of this finding. To circumvent the effect of ectopic Tfap2a on gastrulation, we injected RNA encoding an dexamethasone-inducible form of X. laevis Tfap2a, GRXAP2 (Luo et al., 2005), added dexamethasone at mid-gastrulation (6 hpf), fixed embryos at 11 hpf, and processed them to reveal expression of foxd3 or other early markers of premigratory neural crest. In such embryos, which appeared to undergo gastrulation normally, we detected ectopic expression of foxd3, snai1b, sox9b, and sox10 in the neural plate (Fig. 9B,D,F, and not shown), and reduced expression of neural plate marker sox2 (Fig. 9H). Moreover, when such embryos were allowed to develop to 36 hpf, they often displayed patches of supernumerary melanophores (Fig. 9J), possibly resulting from a conversion of neural plate to neural crest, although abnormal growth within the melanophore lineage would also explain this finding. The results of these gain-of-function experiments are consistent with a requirement for Tfap2a/c in neural crest induction.
Figure 9.
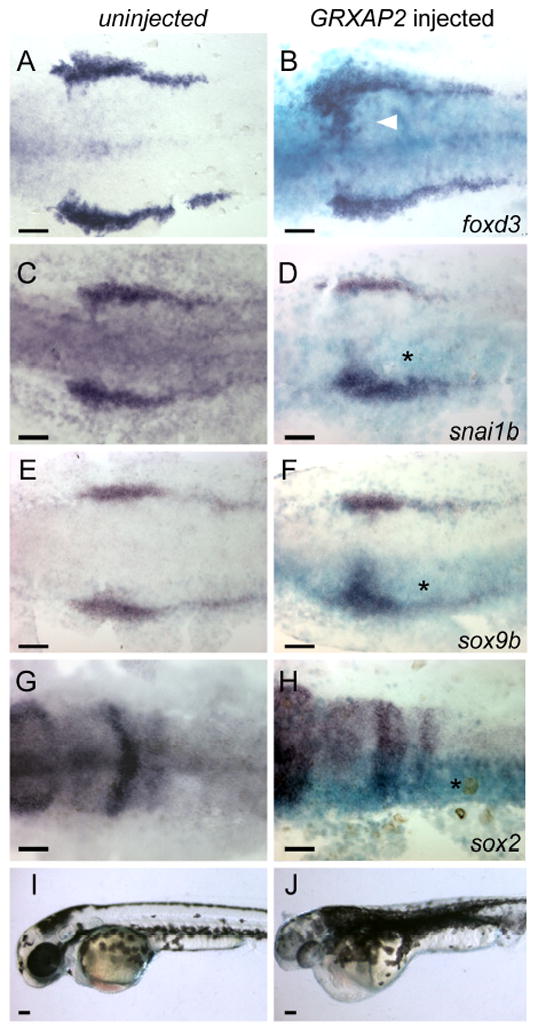
Misexpression of Xenopus TFAP2A expands neural crest into the neural plates. A, C, E, G, I Uninjected control embryos or B, D, F, H, J embryos co-injected with RNA encoding β–galactosidase and GRXAP2, treated with dexamethasone at 8 hpf. AH Embryos fixed at 11 hpf, and processed to reveal β-galactosidase activity (turquoise) (B, D, F, H) and expression of the indicated gene (dark blue). Expression of neural crest markers is seen to be expanded into the rostral domain of the neural plate on the injected side of the embryo (asterisk) (foxd3, 29 of 37 embryos; snai1b, 31 of 40 embryos; sox9b, 34 of 45 embryos) while expression of neural plate marker sox2 is decreased on the injected side (37 of 50 embryos). I, J Lateral views of live embryos at 36 hpf, showing a massive expansion of melanophores in the GRXAP2-injected embryo (27 of 34 RNA-injected embryos). Scale bars: 100 microns.
Discussion
Requirement for Tfap2-type activity in neural crest induction is conserved
Our data reveal that Tfap2a and Tfap2c function redundantly in neural crest induction and in development of other non-neural ectoderm derivatives. While neural crest induction occurs normally in embryos deficient in tfap2c (present study), and largely normally in embryos deficient in tfap2a (Knight et al., 2003; O’Brien et al., 2004), it appears to fail altogether in embryos deficient in both tfap2a and tfap2c. Additional phenotypes observed in tfap2a/c-doubly deficient embryos, but not in embryos singly deficient in either gene, include a failure of lens, ear, and olfactory placode to develop normally, and abnormal epidermal development, as revealed by shrunken medial fin folds. These phenotypes reveal that Tfap2a and Tfap2c can compensate for each other’s absence in many contexts during zebrafish development. These proteins also appear to cooperate in mouse extra-embryonic tissue (Winger et al., 2006). We predict that compensatory activity of Tfap2c explains why neural crest induction occurs normally in mouse Tcfap2a homozygous mutants. Importantly, our results suggest that a role for Tfap2-type activity in neural crest induction is a conserved feature of vertebrate development. In fish, and possibly in mice, this role is shared between two closely related Tfap2 family members, Tfap2a and Tfap2c. In frog embryos this role is largely carried out by Tfap2a, but also possibly in part by Tfap2c because inhibition of TFAP2A reduces, but does not completely eliminate, neural crest (Luo et al., 2003).
Cell-autonomous Tfap2-type activity is required for neural crest induction
Many previous studies have shown that Tfap2-type activity can regulate the balance between cell proliferation and differentiation or death (reviewed in Eckert et al., 2005). The present findings, together with earlier work in frog (Luo et al., 2003), suggest that Tfap2-type activity can also govern cell fate specification, in this case, the choice of an ectodermal cell to become neural crest. Several alternative explanations for the loss of neural crest in tfap2a/c deficient embryos were ruled out. For instance, this loss might have resulted from conversion of posterior neural tissue to anterior, from which neural crest does not arise. Indeed, tfap2a/c deficient embryos display reduced extension of the tail, consistent with anteriorization of the embryo, perhaps reflecting regulation of tfap2a and tfap2c by the well-known posteriorizing factor retinoic acid (Oulad-Abdelghani et al., 1996; Wanner et al., 1996). However, arguing against a wholesale conversion of neural tissue to a rostral identity, multiple derivatives of the spinal cord are detected in tfap2a/c deficient embryos, including primary motoneurons, a subset of RBs, and spt expressing interneurons (WL and RAC, unpublished observations). In addition, changes in proliferation or cell death did not appear to be sufficient to account for the absence of neural crest in tfap2a/c-deficient embryos; we note that if either of these were the explanation, a change would have been expected in msxb expression, whose domain overlaps the neural crest (Phillips et al., 2006; RAC, unpublished observations). Rather, our observation that sox2 is expanded in tfap2a/c deficient embryos suggests neural crest is converted to neural plate in such embryos. We predict that a dorsal or intermediate spinal cord fate is expanded in tfap2a/c deficient embryos. Although we have not yet identified such a fate, we note that in such embryos, RBs are unusually widely distributed in the medio-lateral dimension, consistent with abnormal dorso-ventral patterning of the spinal cord. It is noteworthy that Tfap2-type activity is required for epidermis-specific gene expression (Luo et al., 2002). Whether Tfap2-type activity induces neural crest or epidermis may depend on the presence of specific cofactors, or the absence of specific repressors. Msx, Pax, and Zic family members are candidates for Tfap2 co-factors during induction of neural crest specific genes (Monsoro-Burq et al., 2005).
The absence of neural crest in tfap2a/c-deficient embryos did not immediately reveal which tissues require Tfap2a/c expression for neural crest induction. There is strong evidence that neural crest patterning depends on Tfap2-type activity in surrounding tissues (Brewer et al., 2004; Knight et al., 2005). However, our transplant studies support a cell-autonomous requirement for Tfap2a/c during neural crest induction. Because tfap2c expression is rapidly down regulated in neural crest, Tfap2a/c function in neural crest induction must occur during gastrula stage. At later stages, expression of tfap2a members persists in migratory neural crest and many of its derivatives. The cell autonomous function of Tfap2-type activity within neural crest (i.e., subsequent to its induction) is unknown, but conceivably includes control of survival, proliferation, or patterning. Within neural crest derivatives, Tfap2-type activity promotes Kit expression in melanophores (Brewer et al., 2004), tyrosine hydroxylase expression in sympathetic neurons (Holzschuh et al., 2003; Kim et al., 2001), and hoxa2 expression in cranial neural crest streams (Maconochie et al., 1999). Identification of all functions mediated by Tfap2-type activity in neural crest will require simultaneous, tissue-specific knockdown of each tfap2 family members expressed in neural crest.
A subset of RBs may be independent of Tfap2-type activity
The persistence of RBs in tfap2a/c-deficient embryos is consistent with several models (Fig. 10). In one, Tfap2a/c activity is required for specification of RB/NC precursors, but tfap2a−/cMO embryos have sufficient residual Tfap2a/c activity to allow induction of a few such precursors. These all adopt the RB fate because they are sparsely distributed and do not receive the Delta signal necessary to induce them to become neural crest. While we did not find the number of RBs to be highly dependent on the dose of injected tfap2c MO, maternally encoded Tfap2c may persist in tfap2a−/cMO embryos at sufficient levels to permit induction of some RB/NC precursors. If this were the case, however, we would have expected injection of ngn1 MO into tfap2a−/cMO embryos to convert residual RBs to foxd3-positive neural crest cells, which it did not. An alternative model is that Tfap2a/c activity is not required for specification of RB/NC precursors, but rather for the subsequent specification of neural crest from these precursors (Fig. 10). Our data are consistent with this model, but we do not favor it because it does not explain the reduction of RBs in tfap2a/c-deficient embryos at neural plate stages. Finally, in our preferred model, a subset of RBs is derived from Tfap2a/c-dependent RB/NC precursors, and another subset is derived from Tfap2a/c-independent precursor cells, presumably present in the neural plate (NP) (i.e., an RB/NP precursor) (Fig. 10). Lineage experiments in frog embryos reveal that at least some RBs derive from a progenitor cell at the 512-cell stage that does not give rise to neural crest (referenced in Jacobson, 1991). Different subsets of RBs might be expected to have distinct expression profiles, and we found that at the 6-somite stage not all RBs expressed tfap2a. We cannot rule out the possibility that all RBs initially express tfap2a but a subset of them by 6-somite stage no longer does so. Nonetheless, it is an intriguing hypothesis that the RBs that express tfap2a represent the subset of RBs that derive from RB/NC precursor cells. Lineage studies correlated with gene expression analyses will be required to test this possibility.
Finally, we note that the possibility that a subset of RBs is independent of Tfap2a/c activity is consistent with an earlier proposal that RBs predate the neural crest in evolutionary terms. This hypothesis was partially based on the presence of sensory neurons in the dorsal central nervous system of Amphioxus, a modern cephalochordate believed to share features with the hypothesized vertebrate precursor (Bone, 1960; Fritzsch and Northcutt, 1993). Whatever the relationship between RBs and neural crest, evidence that Tfap2-type activity is a conserved requirement for neural crest induction supports the model that the emergence of neural crest during evolution required modification of the ancestral Tfap2 gene’s regulatory domain to expand Tfap2 expression from the presumptive epidermis into the lateral neural plate (Meulemans and Bronner-Fraser, 2005).
Supplementary Material
A PCR-based genotype assay of tfap2c MO-injected tfap2a mutant embryos. The low mutation introduces a Blp1 restriction site into exon 5 of tfap2a cDNA (Knight et al., 2003). tfap2c e3i3 MO was injected into 31 embryos derived from tfap2a heterozygous mutant parents. PCR on genomic DNA harvested from individual embryos revealed that all embryos with the strong phenotype harbored two copies of the Blp1-sensitive allele of tfap2a, while embryos with normal phenotype harbored 1 or 0 copies of this allele. All 31 embryos were assayed; this gel shows results from all 7 embryos with the strong phenotype (lanes 1–7) and 6 embryos with normal morphology. M, 100 bp ladder. B, C Lateral views of live embryos at 30 hpf. In B, a wild-type embryo injected with tfap2c i3e4 MO (hereafter, control embryo) with normal morphology and pigmentation. In C, a wild-type embryo injected with tfap2a e2i2 MO and tfap2c e3i3 MO, with no visible pigmentation, an absence of yolk extension, a poorly extended tail, and edema ventral to the hindbrain.
Gene expression characteristic of neural crest is absent, but of pre-placodal region is present in tfap2a/c deficient embryos. A, B Dorsal views of flat-mounted, 11 hpf embryos processed to reveal sox9b expression. sox9b expression that is characteristic of premigratory neural crest (pnc) cells is absent in the tfap2aMO/cMO embryos (31 of 31 tfap2aMO/cMO embryos). C, D Dorsal views of flat-mounted, 11 hpf embryos processed to reveal eya1 expression. Expression of eya1 in the preplacodal region (ppr) appears normal in the tfap2aMO/cMO embryos (40 of 40 tfap2aMO/cMO embryos). Scale bars: 100 microns.
Cells from tfap2a/c deficient donors do not give rise to melanophores in mitf/nacre homozygous host embryos. A Lateral view of a 48 hpf chimera derived from a wild-type donor and a mitf/nacre homozygous host embryo nacre mutants have neural crest but lack melanophores because of a cell autonomous requirement for MITF in the melanophore lineage(Lister et al., 1999). A′ A close-up view reveals that the melanophores found in the embryo contain biotin and thus are donor-derived (13 transplanted embryos, at least 5 donor-derived melanophores were found in each of them). B Lateral view of a 48 hpf chimera derived from a tfap2aMO/cMO donor and a mitf/nacre homozygous host embryo. Despite the presence of biotin-labeled donor-derived cells in the dorsal neural tube, no melanophores are visible in this embryo (0 melanophores were found in 18 transplanted embryos which had donor-derived cells in the dorsal neural tube). Scale bars: A, B, 100 microns; A′, 50 microns.
Injection of RNA encoding full-length Tfap2a into tfap2a/c deficient embryos efficiently rescued foxd3 expression in premigratory neural crest (pnc). A–C Dorsal views of flat-mounted embryos at 11 hpf, anterior to the left. foxd3 is expressed in pnc cells in A, a uninjected wild-type embryo, and this expression is absent in B, a tfap2aMO/cMO embryo. C In tfap2aMO/cMO embryo also co-injected with tfap2a and lacZ mRNAs, foxd3 expression in pnc cells is visible on the injected side, marked by X-gal stain (light blue) (36 of 43 tfap2a mRNA injected tfap2aMO/cMO embryos). Scale bars: 100 microns.
Acknowledgments
RAC gratefully acknowledges assistance from Dr. Joni Kinsey, Department of Art History, University of Iowa. We thank Greg Bonde for help with embryo injections and transplant experiments, Tom Sargent, Dan Meulemans, and Kristin Artinger for helpful discussions, David Kimelman, Yi-Lin Yan, David Raible, Paul Henion, Kristin Artinger, and John Postlethwait for probes, Tom Sargent and David Turner for plasmids, and Michael Rebagliati and Kristin Artinger for critical reading of the manuscript. The Islet antibody mAb 39.4D5, developed by Dr. Tom Jessell’s laboratory was obtained from the Developmental Studies Hybridoma Bank developed under the auspices of the NICHD and maintained by The University of Iowa, Department of Biological Sciences, Iowa City, IA 52242. This work supported by a seed grant from the American Cancer Society administered by the Holden Comprehensive Cancer Care Center, a March of Dimes Beginning Grant in Aid, and NIH GM067841 to RAC.
Footnotes
Publisher's Disclaimer: This is a PDF file of an unedited manuscript that has been accepted for publication. As a service to our customers we are providing this early version of the manuscript. The manuscript will undergo copyediting, typesetting, and review of the resulting proof before it is published in its final citable form. Please note that during the production process errors may be discovered which could affect the content, and all legal disclaimers that apply to the journal pertain.
References
- Akimenko MA, Ekker M, Wegner J, Lin W, Westerfield M. Combinatorial expression of three zebrafish genes related to distal-less: part of a homeobox gene code for the head. J Neurosci. 1994;14:3475–86. doi: 10.1523/JNEUROSCI.14-06-03475.1994. [DOI] [PMC free article] [PubMed] [Google Scholar]
- Andermann P, Ungos J, Raible DW. Neurogenin1 defines zebrafish cranial sensory ganglia precursors. Dev Biol. 2002;251:45–58. doi: 10.1006/dbio.2002.0820. [DOI] [PubMed] [Google Scholar]
- Andermann P, Weinberg ES. Expression of zTlxA, a Hox11-like gene, in early differentiating embryonic neurons and cranial sensory ganglia of the zebrafish embryo. Dev Dyn. 2001;222:595–610. doi: 10.1002/dvdy.1239. [DOI] [PubMed] [Google Scholar]
- Artinger KB, Chitnis AB, Mercola M, Driever W. Zebrafish narrowminded suggests a genetic link between formation of neural crest and primary sensory neurons. Development. 1999;126:3969–79. doi: 10.1242/dev.126.18.3969. [DOI] [PMC free article] [PubMed] [Google Scholar]
- Auman HJ, Nottoli T, Lakiza O, Winger Q, Donaldson S, Williams T. Transcription factor AP-2gamma is essential in the extra-embryonic lineages for early postimplantation development. Development. 2002;129:2733–47. doi: 10.1242/dev.129.11.2733. [DOI] [PubMed] [Google Scholar]
- Barrallo-Gimeno A, Holzschuh J, Driever W, Knapik EW. Neural crest survival and differentiation in zebrafish depends on mont blanc/tfap2a gene function. Development. 2004;131:1463–77. doi: 10.1242/dev.01033. [DOI] [PubMed] [Google Scholar]
- Bone Q. The central nervous system in Amphioxus. J Comp Neurol. 1960;115:27–51. [Google Scholar]
- Bosher JM, Totty NF, Hsuan JJ, Williams T, Hurst HC. A family of AP-2 proteins regulates c-erbB-2 expression in mammary carcinoma. Oncogene. 1996;13:1701–7. [PubMed] [Google Scholar]
- Brewer S, Feng W, Huang J, Sullivan S, Williams T. Wnt1-Cre-mediated deletion of AP-2alpha causes multiple neural crest-related defects. Dev Biol. 2004;267:135–52. doi: 10.1016/j.ydbio.2003.10.039. [DOI] [PubMed] [Google Scholar]
- Chazaud C, Oulad-Abdelghani M, Bouillet P, Decimo D, Chambon P, Dolle P. AP-2.2, a novel gene related to AP-2, is expressed in the forebrain, limbs and face during mouse embryogenesis. Mech Dev. 1996;54:83–94. doi: 10.1016/0925-4773(95)00463-7. [DOI] [PubMed] [Google Scholar]
- Cornell RA, Eisen JS. Delta signaling mediates segregation of neural crest and spinal sensory neurons from zebrafish lateral neural plate. Development. 2000;127:2873–82. doi: 10.1242/dev.127.13.2873. [DOI] [PubMed] [Google Scholar]
- Cornell RA, Eisen JS. Delta/Notch signaling promotes formation of zebrafish neural crest by repressing Neurogenin 1 function. Development. 2002;129:2639–48. doi: 10.1242/dev.129.11.2639. [DOI] [PubMed] [Google Scholar]
- D’Amico-Martel A, Noden DM. Contributions of placodal and neural crest cells to avian cranial peripheral ganglia. Am J Anat. 1983;166:445–68. doi: 10.1002/aja.1001660406. [DOI] [PubMed] [Google Scholar]
- Dickinson ME, Selleck MA, McMahon AP, Bronner-Fraser M. Dorsalization of the neural tube by the non-neural ectoderm. Development. 1995;121:2099–106. doi: 10.1242/dev.121.7.2099. [DOI] [PubMed] [Google Scholar]
- Eckert D, Buhl S, Weber S, Jager R, Schorle H. The AP-2 family of transcription factors. Genome Biol. 2005;6:246. doi: 10.1186/gb-2005-6-13-246. [DOI] [PMC free article] [PubMed] [Google Scholar]
- Fritzsch B, Northcutt RG. Cranial and spinal nerve organization in amphioxus and lampreys: evidence for an ancestral craniate pattern. Acta Anat (Basel) 1993;148:96–109. doi: 10.1159/000147529. [DOI] [PubMed] [Google Scholar]
- Harris JA, Cheng AG, Cunningham LL, MacDonald G, Raible DW, Rubel EW. Neomycin-induced hair cell death and rapid regeneration in the lateral line of zebrafish (Danio rerio) J Assoc Res Otolaryngol. 2003;4:219–34. doi: 10.1007/s10162-002-3022-x. [DOI] [PMC free article] [PubMed] [Google Scholar]
- Hernandez-Lagunas L, Choi IF, Kaji T, Simpson P, Hershey C, Zhou Y, et al. Zebrafish narrowminded disrupts the transcription factor prdm1 and is required for neural crest and sensory neuron specification. Dev Biol. 2005;278:347–57. doi: 10.1016/j.ydbio.2004.11.014. [DOI] [PMC free article] [PubMed] [Google Scholar]
- Hilger-Eversheim K, Moser M, Schorle H, Buettner R. Regulatory roles of AP-2 transcription factors in vertebrate development, apoptosis and cell-cycle control. Gene. 2000;260:1–12. doi: 10.1016/s0378-1119(00)00454-6. [DOI] [PubMed] [Google Scholar]
- Holzschuh J, Barrallo-Gimeno A, Ettl AK, Durr K, Knapik EW, Driever W. Noradrenergic neurons in the zebrafish hindbrain are induced by retinoic acid and require tfap2a for expression of the neurotransmitter phenotype. Development. 2003;130:5741–54. doi: 10.1242/dev.00816. [DOI] [PubMed] [Google Scholar]
- Hong CS, Saint-Jeannet JP. Sox proteins and neural crest development. Semin Cell Dev Biol. 2005;16:694–703. doi: 10.1016/j.semcdb.2005.06.005. [DOI] [PubMed] [Google Scholar]
- Hsieh YC, Chang MS, Chen JY, Yen JJ, Lu IC, Chou CM, Huang CJ. Cloning of zebrafish BAD, a BH3-only proapoptotic protein, whose overexpression leads to apoptosis in COS-1 cells and zebrafish embryos. Biochem Biophys Res Commun. 2003;304:667–75. doi: 10.1016/s0006-291x(03)00646-6. [DOI] [PubMed] [Google Scholar]
- Jacobson M. Developmental Neurobiology. Plenum Press; New York: 1991. [Google Scholar]
- Kelsh RN, Dutton K, Medlin J, Eisen JS. Expression of zebrafish fkd6 in neural crest-derived glia. Mech Dev. 2000;93:161–4. doi: 10.1016/s0925-4773(00)00250-1. [DOI] [PubMed] [Google Scholar]
- Kim HS, Hong SJ, LeDoux MS, Kim KS. Regulation of the tyrosine hydroxylase and dopamine beta-hydroxylase genes by the transcription factor AP-2. J Neurochem. 2001;76:280–94. doi: 10.1046/j.1471-4159.2001.00044.x. [DOI] [PubMed] [Google Scholar]
- Kimmel CB, Ballard WW, Kimmel SR, Ullmann B, Schilling TF. Stages of embryonic development of the zebrafish. Dev Dyn. 1995;203:253–310. doi: 10.1002/aja.1002030302. [DOI] [PubMed] [Google Scholar]
- Kimmel CB, Miller CT, Kruze G, Ullmann B, BreMiller RA, Larison KD, Snyder HC. The shaping of pharyngeal cartilages during early development of the zebrafish. Dev Biol. 1998;203:245–63. doi: 10.1006/dbio.1998.9016. [DOI] [PubMed] [Google Scholar]
- Kimmel CB, Warga RM, Schilling TF. Origin and organization of the zebrafish fate map. Development. 1990;108:581–94. doi: 10.1242/dev.108.4.581. [DOI] [PubMed] [Google Scholar]
- Knight RD, Javidan Y, Nelson S, Zhang T, Schilling T. Skeletal and pigment cell defects in the lockjaw mutant reveal multiple roles for zebrafish tfap2a in neural crest development. Dev Dyn. 2004;229:87–98. doi: 10.1002/dvdy.10494. [DOI] [PubMed] [Google Scholar]
- Knight RD, Javidan Y, Zhang T, Nelson S, Schilling TF. AP2-dependent signals from the ectoderm regulate craniofacial development in the zebrafish embryo. Development. 2005;132:3127–38. doi: 10.1242/dev.01879. [DOI] [PubMed] [Google Scholar]
- Knight RD, Nair S, Nelson SS, Afshar A, Javidan Y, Geisler R, et al. lockjaw encodes a zebrafish tfap2a required for early neural crest development. Development. 2003;130:5755–68. doi: 10.1242/dev.00575. [DOI] [PubMed] [Google Scholar]
- Kozlowski DJ, Whitfield TT, Hukriede NA, Lam WK, Weinberg ES. The zebrafish dog-eared mutation disrupts eya1, a gene required for cell survival and differentiation in the inner ear and lateral line. Dev Biol. 2005;277:27–41. doi: 10.1016/j.ydbio.2004.08.033. [DOI] [PubMed] [Google Scholar]
- Kudoh T, Concha ML, Houart C, Dawid IB, Wilson SW. Combinatorial Fgf and Bmp signalling patterns the gastrula ectoderm into prospective neural and epidermal domains. Development. 2004;131:3581–92. doi: 10.1242/dev.01227. [DOI] [PMC free article] [PubMed] [Google Scholar]
- Lewis JL, Bonner J, Modrell M, Ragland JW, Moon RT, Dorsky RI, Raible DW. Reiterated Wnt signaling during zebrafish neural crest development. Development. 2004;131:1299–308. doi: 10.1242/dev.01007. [DOI] [PubMed] [Google Scholar]
- Liem KF, Jr, Tremml G, Roelink H, Jessell TM. Dorsal differentiation of neural plate cells induced by BMP-mediated signals from epidermal ectoderm. Cell. 1995;82:969–79. doi: 10.1016/0092-8674(95)90276-7. [DOI] [PubMed] [Google Scholar]
- Lister JA, Robertson CP, Lepage T, Johnson SL, Raible DW. nacre encodes a zebrafish microphthalmia-related protein that regulates neural-crest-derived pigment cell fate. Development. 1999;126:3757–67. doi: 10.1242/dev.126.17.3757. [DOI] [PubMed] [Google Scholar]
- Luo T, Lee YH, Saint-Jeannet JP, Sargent TD. Induction of neural crest in Xenopus by transcription factor AP2alpha. Proc Natl Acad Sci U S A. 2003;100:532–7. doi: 10.1073/pnas.0237226100. [DOI] [PMC free article] [PubMed] [Google Scholar]
- Luo T, Matsuo-Takasaki M, Thomas ML, Weeks DL, Sargent TD. Transcription factor AP-2 is an essential and direct regulator of epidermal development in Xenopus. Dev Biol. 2002;245:136–44. doi: 10.1006/dbio.2002.0621. [DOI] [PubMed] [Google Scholar]
- Luo T, Zhang Y, Khadka D, Rangarajan J, Cho KW, Sargent TD. Regulatory targets for transcription factor AP2 in Xenopus embryos. Dev Growth Differ. 2005;47:403–13. doi: 10.1111/j.1440-169X.2005.00809.x. [DOI] [PubMed] [Google Scholar]
- Maconochie M, Krishnamurthy R, Nonchev S, Meier P, Manzanares M, Mitchell PJ, Krumlauf R. Regulation of Hoxa2 in cranial neural crest cells involves members of the AP-2 family. Development. 1999;126:1483–94. doi: 10.1242/dev.126.7.1483. [DOI] [PubMed] [Google Scholar]
- McPherson LA, Weigel RJ. AP2alpha and AP2gamma: a comparison of binding site specificity and trans-activation of the estrogen receptor promoter and single site promoter constructs. Nucleic Acids Res. 1999;27:4040–9. doi: 10.1093/nar/27.20.4040. [DOI] [PMC free article] [PubMed] [Google Scholar]
- Meulemans D, Bronner-Fraser M. Central role of gene cooption in neural crest evolution. J Exp Zoolog B Mol Dev Evol. 2005;304:298–303. doi: 10.1002/jez.b.21047. [DOI] [PubMed] [Google Scholar]
- Mitchell PJ, Timmons PM, Hebert JM, Rigby PW, Tjian R. Transcription factor AP-2 is expressed in neural crest cell lineages during mouse embryogenesis. Genes Dev. 1991;5:105–19. doi: 10.1101/gad.5.1.105. [DOI] [PubMed] [Google Scholar]
- Moens CB, Fritz A. Techniques in neural development. Methods Cell Biol. 1999;59:253–72. doi: 10.1016/s0091-679x(08)61829-4. [DOI] [PubMed] [Google Scholar]
- Monsoro-Burq AH, Wang E, Harland R. Msx1 and Pax3 cooperate to mediate FGF8 and WNT signals during Xenopus neural crest induction. Dev Cell. 2005;8:167–78. doi: 10.1016/j.devcel.2004.12.017. [DOI] [PubMed] [Google Scholar]
- Moser M, Ruschoff J, Buettner R. Comparative analysis of AP-2 alpha and AP-2 beta gene expression during murine embryogenesis. Dev Dyn. 1997;208:115–24. doi: 10.1002/(SICI)1097-0177(199701)208:1<115::AID-AJA11>3.0.CO;2-5. [DOI] [PubMed] [Google Scholar]
- Moury JD, Jacobson AG. The origins of neural crest cells in the axolotl. Dev Biol. 1990;141:243–53. doi: 10.1016/0012-1606(90)90380-2. [DOI] [PubMed] [Google Scholar]
- Nasevicius A, Ekker SC. Effective targeted gene ‘knockdown’ in zebrafish. Nat Genet. 2000;26:216–20. doi: 10.1038/79951. [DOI] [PubMed] [Google Scholar]
- O’Brien EK, d’Alencon C, Bonde G, Li W, Schoenebeck J, Allende ML, et al. Transcription factor Ap-2alpha is necessary for development of embryonic melanophores, autonomic neurons and pharyngeal skeleton in zebrafish. Dev Biol. 2004;265:246–61. doi: 10.1016/j.ydbio.2003.09.029. [DOI] [PubMed] [Google Scholar]
- Okuda Y, Yoda H, Uchikawa M, Furutani-Seiki M, Takeda H, Kondoh H, Kamachi Y. Comparative genomic and expression analysis of group B1 sox genes in zebrafish indicates their diversification during vertebrate evolution. Dev Dyn. 2006;235:811–25. doi: 10.1002/dvdy.20678. [DOI] [PubMed] [Google Scholar]
- Oulad-Abdelghani M, Bouillet P, Chazaud C, Dolle P, Chambon P. AP-2.2: a novel AP-2-related transcription factor induced by retinoic acid during differentiation of P19 embryonal carcinoma cells. Exp Cell Res. 1996;225:338–47. doi: 10.1006/excr.1996.0184. [DOI] [PubMed] [Google Scholar]
- Phillips BT, Kwon HJ, Melton C, Houghtaling P, Fritz A, Riley BB. Zebrafish msxB, msxC and msxE function together to refine the neural-nonneural border and regulate cranial placodes and neural crest development. Dev Biol. 2006;294:376–90. doi: 10.1016/j.ydbio.2006.03.001. [DOI] [PubMed] [Google Scholar]
- Reyes R, Haendel M, Grant D, Melancon E, Eisen JS. Slow degeneration of zebrafish Rohon-Beard neurons during programmed cell death. Dev Dyn. 2004;229:30–41. doi: 10.1002/dvdy.10488. [DOI] [PubMed] [Google Scholar]
- Roy S, Ng T. Blimp-1 specifies neural crest and sensory neuron progenitors in the zebrafish embryo. Curr Biol. 2004;14:1772–7. doi: 10.1016/j.cub.2004.09.046. [DOI] [PubMed] [Google Scholar]
- Sahly I, Andermann P, Petit C. The zebrafish eya1 gene and its expression pattern during embryogenesis. Dev Genes Evol. 1999;209:399–410. doi: 10.1007/s004270050270. [DOI] [PubMed] [Google Scholar]
- Sauka-Spengler T, Bronner-Fraser M. Development and evolution of the migratory neural crest: a gene regulatory perspective. Curr Opin Genet Dev. 2006;16:360–6. doi: 10.1016/j.gde.2006.06.006. [DOI] [PubMed] [Google Scholar]
- Schilling TF, Piotrowski T, Grandel H, Brand M, Heisenberg CP, Jiang YJ, et al. Jaw and branchial arch mutants in zebrafish I: branchial arches. Development. 1996;123:329–44. doi: 10.1242/dev.123.1.329. [DOI] [PubMed] [Google Scholar]
- Schorle H, Meier P, Buchert M, Jaenisch R, Mitchell PJ. Transcription factor AP-2 essential for cranial closure and craniofacial development. Nature. 1996;381:235–8. doi: 10.1038/381235a0. [DOI] [PubMed] [Google Scholar]
- Selleck MA, Bronner-Fraser M. Origins of the avian neural crest: the role of neural plate-epidermal interactions. Development. 1995;121:525–38. doi: 10.1242/dev.121.2.525. [DOI] [PubMed] [Google Scholar]
- Smith M, Hickman A, Amanze D, Lumsden A, Thorogood P. Trunk neural crest origin of caudal fin mesenchyme in the zebrafish Brachydanio rerio. Proc R Soc Lond. 1994;256:137–145. [Google Scholar]
- Solomon KS, Fritz A. Concerted action of two dlx paralogs in sensory placode formation. Development. 2002;129:3127–36. doi: 10.1242/dev.129.13.3127. [DOI] [PubMed] [Google Scholar]
- Steventon B, Carmona-Fontaine C, Mayor R. Genetic network during neural crest induction: from cell specification to cell survival. Semin Cell Dev Biol. 2005;16:647–54. doi: 10.1016/j.semcdb.2005.06.001. [DOI] [PubMed] [Google Scholar]
- Thisse B, Pflumio S, Furthauer M, Loppin B, Heyer V, Degrave A, et al. Expression of the zebrafish genome during embryogenesis. ZFIN Direct Data Submission, NIH RO1 RR15402 2001 [Google Scholar]
- Thisse C, Thisse B, Postlethwait JH. Expression of snail2, a second member of the zebrafish snail family, in cephalic mesendoderm and presumptive neural crest of wild-type and spadetail mutant embryos. Dev Biol. 1995;172:86–99. doi: 10.1006/dbio.1995.0007. [DOI] [PubMed] [Google Scholar]
- Wanner R, Zhang J, Henz BM, Rosenbach T. AP-2 gene expression and modulation by retinoic acid during keratinocyte differentiation. Biochem Biophys Res Commun. 1996;223:666–9. doi: 10.1006/bbrc.1996.0952. [DOI] [PubMed] [Google Scholar]
- Werling U, Schorle H. Transcription factor gene AP-2 gamma essential for early murine development. Mol Cell Biol. 2002;22:3149–56. doi: 10.1128/MCB.22.9.3149-3156.2002. [DOI] [PMC free article] [PubMed] [Google Scholar]
- Westerfield M. The Zebrafish Book. University of Oregon Press; Eugene, OR: 1993. [Google Scholar]
- Williams JA, Barrios A, Gatchalian C, Rubin L, Wilson SW, Holder N. Programmed cell death in zebrafish rohon beard neurons is influenced by TrkC1/NT-3 signaling. Dev Biol. 2000;226:220–30. doi: 10.1006/dbio.2000.9860. [DOI] [PubMed] [Google Scholar]
- Winger Q, Huang J, Auman HJ, Lewandoski M, Williams T. Analysis of transcription factor AP-2 expression and function during mouse preimplantation development. Biol Reprod. 2006;75:324–33. doi: 10.1095/biolreprod.106.052407. [DOI] [PubMed] [Google Scholar]
- Yan YL, Willoughby J, Liu D, Crump JG, Wilson C, Miller CT, et al. A pair of Sox: distinct and overlapping functions of zebrafish sox9 co-orthologs in craniofacial and pectoral fin development. Development. 2005;132:1069–83. doi: 10.1242/dev.01674. [DOI] [PubMed] [Google Scholar]
- Zhang J, Hagopian-Donaldson S, Serbedzija G, Elsemore J, Plehn-Dujowich D, McMahon AP, et al. Neural tube, skeletal and body wall defects in mice lacking transcription factor AP-2. Nature. 1996;381:238–41. doi: 10.1038/381238a0. [DOI] [PubMed] [Google Scholar]
- Zhang Y, Luo T, Sargent TD. Expression of TFAP2beta and TFAP2gamma genes in Xenopus laevis. Gene Expr Patterns. 2006;6:589–95. doi: 10.1016/j.modgep.2005.11.011. [DOI] [PubMed] [Google Scholar]
Associated Data
This section collects any data citations, data availability statements, or supplementary materials included in this article.
Supplementary Materials
A PCR-based genotype assay of tfap2c MO-injected tfap2a mutant embryos. The low mutation introduces a Blp1 restriction site into exon 5 of tfap2a cDNA (Knight et al., 2003). tfap2c e3i3 MO was injected into 31 embryos derived from tfap2a heterozygous mutant parents. PCR on genomic DNA harvested from individual embryos revealed that all embryos with the strong phenotype harbored two copies of the Blp1-sensitive allele of tfap2a, while embryos with normal phenotype harbored 1 or 0 copies of this allele. All 31 embryos were assayed; this gel shows results from all 7 embryos with the strong phenotype (lanes 1–7) and 6 embryos with normal morphology. M, 100 bp ladder. B, C Lateral views of live embryos at 30 hpf. In B, a wild-type embryo injected with tfap2c i3e4 MO (hereafter, control embryo) with normal morphology and pigmentation. In C, a wild-type embryo injected with tfap2a e2i2 MO and tfap2c e3i3 MO, with no visible pigmentation, an absence of yolk extension, a poorly extended tail, and edema ventral to the hindbrain.
Gene expression characteristic of neural crest is absent, but of pre-placodal region is present in tfap2a/c deficient embryos. A, B Dorsal views of flat-mounted, 11 hpf embryos processed to reveal sox9b expression. sox9b expression that is characteristic of premigratory neural crest (pnc) cells is absent in the tfap2aMO/cMO embryos (31 of 31 tfap2aMO/cMO embryos). C, D Dorsal views of flat-mounted, 11 hpf embryos processed to reveal eya1 expression. Expression of eya1 in the preplacodal region (ppr) appears normal in the tfap2aMO/cMO embryos (40 of 40 tfap2aMO/cMO embryos). Scale bars: 100 microns.
Cells from tfap2a/c deficient donors do not give rise to melanophores in mitf/nacre homozygous host embryos. A Lateral view of a 48 hpf chimera derived from a wild-type donor and a mitf/nacre homozygous host embryo nacre mutants have neural crest but lack melanophores because of a cell autonomous requirement for MITF in the melanophore lineage(Lister et al., 1999). A′ A close-up view reveals that the melanophores found in the embryo contain biotin and thus are donor-derived (13 transplanted embryos, at least 5 donor-derived melanophores were found in each of them). B Lateral view of a 48 hpf chimera derived from a tfap2aMO/cMO donor and a mitf/nacre homozygous host embryo. Despite the presence of biotin-labeled donor-derived cells in the dorsal neural tube, no melanophores are visible in this embryo (0 melanophores were found in 18 transplanted embryos which had donor-derived cells in the dorsal neural tube). Scale bars: A, B, 100 microns; A′, 50 microns.
Injection of RNA encoding full-length Tfap2a into tfap2a/c deficient embryos efficiently rescued foxd3 expression in premigratory neural crest (pnc). A–C Dorsal views of flat-mounted embryos at 11 hpf, anterior to the left. foxd3 is expressed in pnc cells in A, a uninjected wild-type embryo, and this expression is absent in B, a tfap2aMO/cMO embryo. C In tfap2aMO/cMO embryo also co-injected with tfap2a and lacZ mRNAs, foxd3 expression in pnc cells is visible on the injected side, marked by X-gal stain (light blue) (36 of 43 tfap2a mRNA injected tfap2aMO/cMO embryos). Scale bars: 100 microns.