Abstract
We have measured by flow cytometry the ability of subsets of CD8+ CD3+ lymphocytes within mononuclear cell preparations to make intracellular cytokines (IL-2, tumour necrosis factor-alpha (TNF-α) and IFN-γ) on stimulation in vitro with phorbol myristate acetate (PMA) and ionomycin for 16 h. These CD8+ subsets were defined by the presence or absence of CD28 or HLA-DR. Subsets of normal CD8+ cells were compared with cells from the antibody deficiency disease common variable immunodeficiency (CVID). In CVID there was a significant increase in the production of IFN-γ in the CD8+ CD28+ subset (‘cytotoxic’). This reflects a shift in this disease towards an excessive Th1 response away from B cell help. Paradoxically, some CVID patients also showed a reduction in IFN-γ production in the CD8+ CD28− subset (‘suppressor’) which was associated with a failure of these cells to maintain a state of activation after a stimulus in vitro. The B cell problem in this disease is known to be related to a failure of T cell help shown by an inability to produce the antigen-specific CD4+ memory T cells needed for successful B cell maturation. The two pathological CD28 subsets of CD8+ cells we have found in CVID may both be detrimental to a normal CD4-dependent immune response. The CD28− suppressor subset expands and is unable to maintain activation and cytokine secretion, and the CD28+ cytotoxic subset is over-producing the Th1 cytokine IFN-γ.
Keywords: common variable immunodeficiency, CD8+ cells, CD28 subsets of CD8+ cells, interferon-gamma, T cell activation
INTRODUCTION
Common variable immunodeficiency (CVID) is a disease characterized by the failure of antibody production by B cells with low serum levels of all isotypes of immunoglobulin [1]. This B cell problem relates to a failure of T cell help due an inability to produce the antigen-specific CD4+ memory T cells [2] needed for successful B cell maturation in germinal centres [3]. Work on the CD8+ T cell has been neglected since the early report [4] (never substantiated) that CVID is due to an excess of ‘T suppressor activity’. We have previously shown, however, that CD8+ cells in CVID are abnormal, e.g. there is an increase in the size of the CD28− subset [5]. A similar expansion of the CD28− cells occurs in the immunodeficiency associated with HIV infection [6].
In CD8+ cells, it is well known that separated CD8+ CD28− cells are functionally suppressive and the CD8+ CD28+ cells are principally cytotoxic [7–10] and that human T suppressor clones lack CD28 [11]. Our current aim is to focus on subsets of the CD8+ T lymphocyte in CVID to see if they play a role in the abrogation of the normal function of CD4+ cells which leads to the B cell antibody immunodeficiency. Our hypothesis is that changes in the cytokine network due to the subsets of CD8+ lymphocytes in CVID do not affect B cell function directly, but indirectly through an effect on CD4+ T helper cells.
Abnormal immune function is reflected not only in relative subset sizes, but also in imbalances in the cytokine and activation network of lymphocytes [12, 13]. Andersson's group [14] initiated techniques to measure by flow cytometry the capacity of identified cell subsets to make intracellular cytokines. These use the powerful stimulation by phorbol ester and ionomycin in vitro to express cytokines within the cells. This powerful stimulus is only used to develop the inherent potential of the cells to produce cytokines and thus allows a comparative assessment of the maximal potential capacity of cells from different donors to produce cytokines. Monensin is also present in the culture to help retain the induced cytokine within the cell [15]. We have modified and simplified this method and have already reported that using a 12-h stimulation with phorbol myristate acetate (PMA) and ionomycin in vitro there is an abnormal increase in IFN-γ production and HLA-DR expression in both CD4+ and CD8+ cells from some CVID patients [16]. This provides evidence for a shift towards a Th1 pattern in this disease, suggesting less help for B cells. Another indication for the involvement of the CD8+ cell in CVID is the high levels of soluble CD8 we have reported in the circulation of severely affected patients [17]. We now extend this work, comparing CVID patients with normal donors to look at the differential production of cytokines by subsets of CD8+ cells.
MATERIALS AND METHODS
Donors
Blood (25 ml) was taken from normal volunteer donors (n = 6; two male, four female; mean age 42 years, range 15–58 years) and CVID patients (n = 11; seven male, four female; mean age 52 years, range 22–75 years) attending the clinic and collected into lithium heparin monovette tubes. Informed consent and ethical permission were obtained.
Cell preparation
The procedure was similar to that in our previous report [16]. Mononuclear cells were separated by Ficoll–Paque sedimentation (Pharmacia, St Albans, UK). Cells were washed twice, then resuspended in RPMI 1640 with 10% fetal calf serum (FCS) at a concentration of 2 × 10⁶ /ml. Aliquots (0·5 ml) of the cell suspension were dispensed into 24-well flat-bottomed tissue culture plates (Falcon; Marathon Supplies Ltd, London, UK). The wells had either monensin added in 0·5 ml of RPMI with 10% FCS to give a final concentration of 3 μmol/l (unstimulated control), or a 0·5-ml cocktail of PMA, ionomycin and monensin to give final concentrations in culture of 5 ng/ml, 2 μmol/l and 3 μmol/l, respectively (stimulated sample). All these reagents were from Calbiochem (Nottingham, UK). The final culture volume was 1 ml. After preliminary kinetic experiments, we stimulated peripheral blood mononuclear cells (PBMC) with PMA and ionomycin for 16 h, with an assessment of differential cytokine production in CD8+ subsets defined by CD28 or HLA-DR positivity or negativity. The cells were cultured in an humidified atmosphere of 5% CO2 in air. At the end of the culture period, the cells were harvested, pooling replicate cultures. The volume of the culture wells and the concentration of cells cultured were those giving established optimal conditions, but two or three replicate wells were needed to be pooled to provide enough cells for the staining procedure. The cells were washed once with PBS containing 0·2% bovine serum albumin (BSA) and 0·02% sodium azide (PBS–A–A). The cells were then fixed and permeabilized using Cytoperm (solutions A and B; Serotec, Kidlington, UK) according to the manufacturer's instructions.
Staining of cells
Antibodies for CD8 PE, CD69 PE, CD28 PE, HLA-DR PE and CD4 PerCP were obtained from Becton Dickinson (Oxford, UK); aliquots (10 μl) were dispensed into 6-ml round-bottomed tubes (12 × 75 mm) suitable for use on a Becton Dickinson FACScan. Antibodies for the intracellular cytokines (Serotec) directly conjugated with FITC were as follows: IL-2 (clone B-G5), tumour necrosis factor-alpha (TNF-α) (clone B-D9) and IFN-γ (clone B-B1), all at 100 μg/ml. These were added to the tubes in 2-μl aliquots. As soon as the washed fixed cells had been resuspended in the appropriate volume of Cytoperm (solution B, the permeabilizing reagent), 50-μl aliquots of cells (each containing ≈ 5 × 10⁵ cells) were added to the tubes containing the various cocktails of MoAbs. The cells were then incubated in the dark at room temperature for 30 min, after which the cells were washed once in PBS–A–A. Paraformaldehyde (0·5% in PBS, 100 μl) was added to the cell pellet, the cells were gently resuspended and stored at 4°C. Acquisition (20 000 events) was done within 24 h using Lysis II software on a Becton Dickinson FACScan flow cytometer. List mode files were analysed using Winlist 3·0 software (Verity, Topsham, MN). The analysis was similar to but modified from that previously described [16]. A ‘tight’ lymphocyte region (R1) was obtained from a plot of forward against side light scatter to gate two-dimensional dot plots of bright CD8+ cells against the subset marker (e.g. CD28). Regions were drawn for CD8+ bright cells (R2) and the subset marker, e.g. CD28 (R3). Control experiments showed that all of the CD8+ bright cells were CD3+. Single-parameter histograms for the numbers of cells expressing intracellular cytokine within the required subset were determined by gating on combined regions, e.g. R1 AND R2 AND R3 for CD8+ CD28+ cells and R1 AND R2 NOT R3 for the CD8+ CD28− population. Cells positive for cytokine in each subset were distinguished by drawing a region (R4) whose location was set on the unstimulated control for comparison with the stimulated sample. Regions R1, R2 and R3 were adjusted between the unstimulated and stimulated samples, but the region (R4) discriminating between the cytokine positive and negative cells was not. Cytokine-positive cells were expressed as a percentage of the cell population or subset.
RESULTS
Kinetics of cytokine production on stimulation with PMA and ionomycin
Figure 1 illustrates with a single normal donor that the IFN-γ content of CD8+ cells is still at a plateau level after 16 h of stimulation with PMA and ionomycin in the presence of monensin. It also shows the differential between the CD28+ and CD28− subsets of CD8+ cells in the induction of IFN-γ. Similar kinetic data were obtained for the other cytokines and for CVID patients (not shown). The time course for IL-2 was slower than for the other cytokines, but was at a plateau value at 16 h. In all subsequent experiments, the time of culture was fixed at 16 h. Interestingly, in CD8+ cells from some CVID patients after 16 h stimulation there was a fall-off in the expression of the activation antigen CD69 in comparison with normal cells (data not shown). We observed normal levels of CD69 expression in CVID after 2 h or 12 h stimulation with PMA and ionomycin (unpublished data). This failure in maintaining activation over a prolonged period is confined to a particular subpopulation of CD8+ lymphocytes (CD28− cells) and is described later.
Fig. 1.
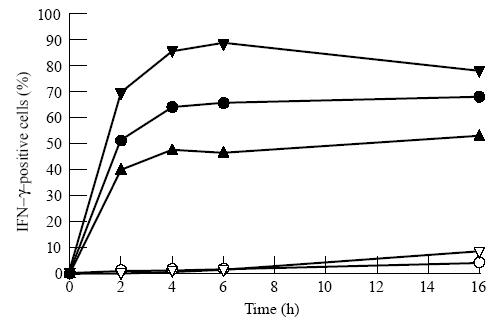
Kinetics of cytokine production induced by phorbol myristate acetate (PMA), ionomycin and monensin. Effect of time of stimulation with PMA and ionomycin on the proportion of CD8+ cells (•), CD8+ CD28+ cells (▴) and CD8+ CD28− cells (▾) making IFN-γ. Culture without PMA and ionomycin but with monensin is depicted with open symbols. Data are for a single normal donor.
Cytokine production in CD8+ cells
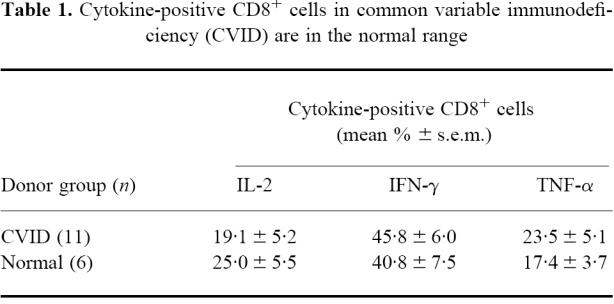
The overall production of the three cytokines IL-2, IFN-γ and TNF-α in CD8+ cells is normal in CVID using the 16 h conditions of culture (Table 1). Using Student's t-test (unpaired), there were no significant differences (P< 0·05) between the normal and CVID donor groups. In both donor groups, about twice the number of CD8+ cells made IFN-γ compared with the two other cytokines.
Table 1.
Cytokine-positive CD8+ cells in common variable immunodeficiency (CVID) are in the normal range
Altered sizes of subsets within CD8+ in CVID
Figure 2 shows that in CVID compared with normals under the 16-h conditions of stimulation there was a significant increase in the mean proportion of CD8+ T cells negative for CD28. The proportion of HLA-DR+ CD8+ cells was, however, normal.
Fig. 2.
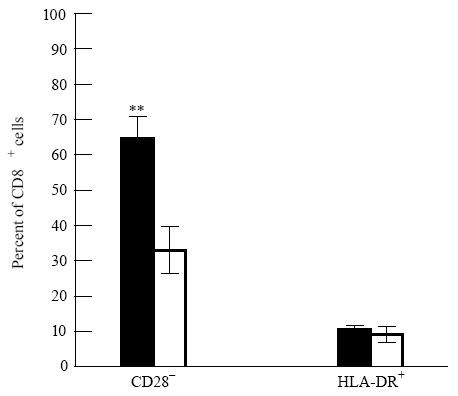
Altered sizes (mean percentage, ± s.e.m.) of subsets of CD8+ cells in common variable immunodeficiency (CVID). In CVID (▪, n = 11) there was a significant increase (**P< 0.005) in the mean proportion of CD28− CD8+ cells compared with normal donors (□, n = 6) but normal proportions of HLA-DR+ CD8+ cells.
Cytokine production and activation status (CD69) in HLA-DR-positive and -negative subsets of CD8+ cells
There was a markedly higher production of cytokines, especially IFN-γ, in the small HLA-DR+ subset within CD8+ cells compared with the HLA-DR− subset (Table 2). However, using the t-test as with Table 1, no statistical differences appear between the CVID and normal donor groups in the production of the three cytokines by the HLA-DR+ and HLA-DR− subsets.
Table 2.
Cytokine-positive CD8+ cells in common variable immunodeficiency (CVID) are in the normal range within both HLA-DR+ and HLA-DR− subsets
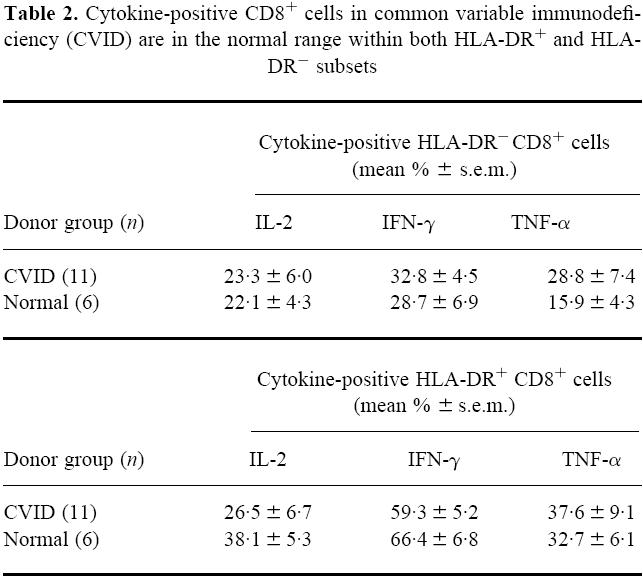
Figure 3 illustrates that following the 16 h of culture with PMA and ionomycin the proportion of CD69+ activated cells was significantly reduced in CVID compared with normal in both the HLA-DR+ and HLA-DR− CD8 subsets.
Fig. 3.
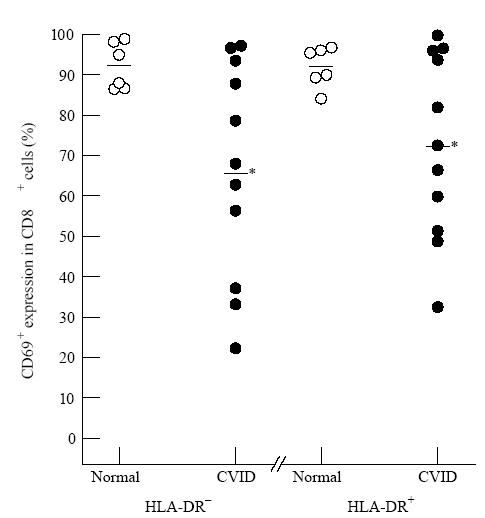
Reduced activation (defined by reduction in CD69 positivity) in common variable immunodeficiency (CVID) within CD8+ HLA-DR+ or CD8+ HLA-DR− subsets. After 16 h phorbol myristate acetate (PMA) and ionomycin, the CD8+ cells of CVID patients (•) were significantly reduced in activation (CD69 positivity) in both the HLA-DR+ (*P< 0.05) and HLA-DR− (*P< 0.05) subsets compared with normal donors (○). In this and subsequent Figures, each symbol represents a separate donor.
Cytokine production and activation status (CD69) in CD28-positive or -negative subsets of CD8+ cells
Table 3 shows that there was a markedly higher production of IL-2 and TNF-α in the CD28+ subset within CD8+ cells compared with the CD28− subset. For the production of these two cytokines, there were again no significant differences between the CVID and normal donor groups in either the CD28+ or CD28− subsets. The t-test was used as with the previous Tables. However, when IFN-γ is considered, as shown in Fig. 4, an obvious and significant difference appears between the CVID and normal groups. There is no known cause for the position of the outlying point in one donor of the normal data of CD28+ CD8+ cells positive for IFN-γ shown in Fig. 4. However, this did not affect the clear establishment of a significant difference between the groups. In CVID the ability to make IFN-γ was greatly increased compared with normals, but this phenomenon was confined to the CD28+ subset within the CD8+ T cells. The cellular activation status as measured by CD69 goes the opposite way to IFN-γ production, but Fig. 5 shows that a significant reduction in the maintenance of cell activation (% CD69+ cells) in CVID was confined to the CD28− subset within the CD8 lymphocytes.
Table 3.
IL-2 and TNF-α-positive CD8+ cells in common variable immunodeficiency (CVID) are in the normal range both in the diminished CD28+ subset and in the expanded CD28− subset
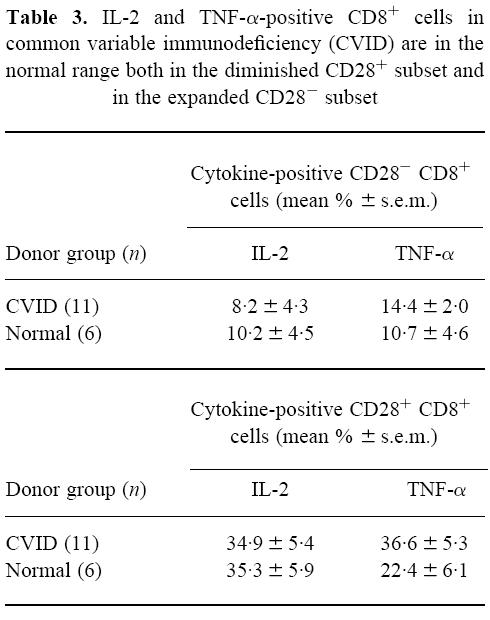
Fig. 4.
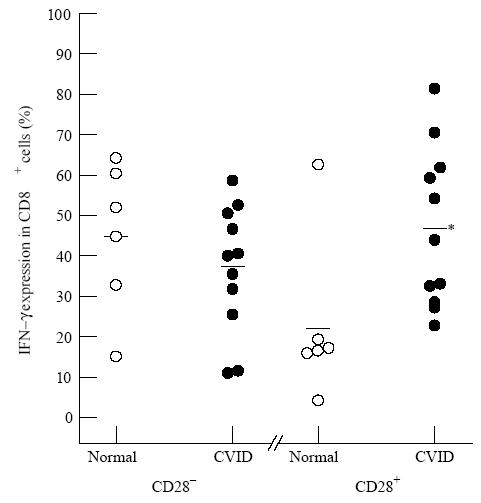
Increased production in common variable immunodeficiency (CVID) of IFN-γ in the CD28+ subset of CD8+ cells. After 16 h phorbol myristate acetate (PMA) and ionomycin with monensin, there was a significant increase (*P< 0.05) in the proportion of IFN-γ+ CD8+ cells from the CVID patients (•) compared with normal donors (○), but only within the CD28+ subset.
Fig. 5.
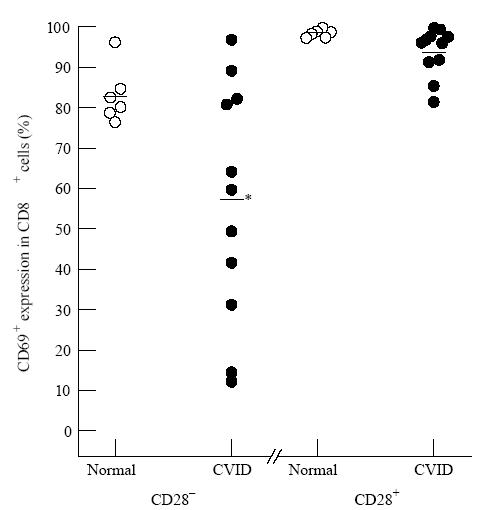
The decreased activation (CD69+ cells) in common variable immunodeficiency (CVID) CD8+ cells is confined to the CD28− subset. After 16 h phorbol myristate acetate (PMA) and ionomycin with monensin, the significant failure (*P< 0.05) to maintain the proportion of CD69+ CD8+ cells in the CVID patients (•) compared with normal donors (○) was observed only in the CD28− subset.
Finally, Fig. 6 shows that in these 16-h cultures the reduced level of CD69+ activation in the CD28− subset of CD8+ cells in CVID was associated with reduced IFN-γ production in that subset. This is despite the finding (Fig. 4) that in CVID IFN-γ is raised in the CD28+ CD8+ subset.
Fig. 6.
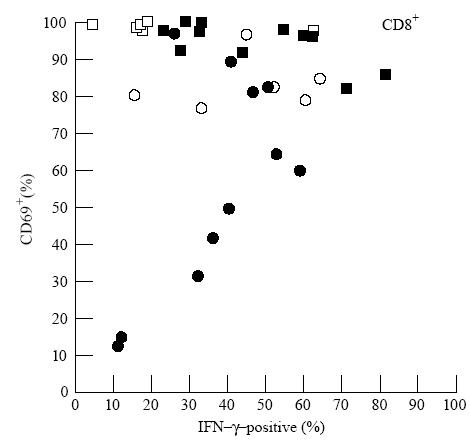
Plot of cell activation (CD69 positivity, ordinate) against production of IFN-γ (abscissa) in CD8+ cell subsets defined by CD28. CD8+ cells in individual common variable immunodeficiency (CVID) patients (CD28+ (▪) and CD28− (•)) and normal donors (CD28+ (□) and CD28− (○)). The low CD69 activation within the CD28− CD8+ subset in some CVID patients appears to limit the production of IFN-γ.
DISCUSSION
In several diseases, disturbed cytokine profiles are known to affect immune responses [18–24]. These disturbed profiles can be confined to one or more minority subsets of lymphocytes. The recent methods for measuring intracellular cytokines by flow cytometry allow the state of cytokines within these subsets to be accurately defined, and also allow the potential for cytokines within a specific subset to be associated with other markers (e.g. the CD69 antigen for cell activation).
We have already reported abnormally high levels of cells able to make IFN-γ in CVID in both CD4+ and CD8+ lymphocytes [16], and we have now extended the study to subsets of CD8+ cells. The subdivision of CD8+ cells into CD28+ (mainly cytotoxic cells) and CD28− mainly suppressor [7–11] was a fundamental advance. There is an expansion of the CD8+ CD28− subset reported in several diseases, including multiple sclerosis [25], rheumatoid arthritis [26], HIV infection [27, 28] and in our own report on CVID [5]. Clearly, the differing cytokine profiles in these distinct functional subsets will be important in elucidating the mechanism of the dysfunction within each disease.
The kinetics of the cytokine-producing potential developed using PMA and ionomycin in vitro will vary with different cell subpopulations and cytokines. Our original report for CVID involved a culture time of 12 h [16]. In the present study, we have validated the longer culture time of 16 h with a time course experiment showing that the cytokine production is maintained. The reduction in CD8 expression on stimulation of protein kinase C (PKC) with phorbol ester was minimal and did not interfere with the unequivocal characterization of CD8+ cells by flow cytometry. This contrasts with the profound down-regulation in CD4 antigen expression on stimulation with phorbol ester [29].
Interestingly, unlike our data with 12-h stimulation, the present data (with 16-h stimulation) showed no difference looking at CD8 cells overall between the CVID and control groups for all three cytokines (IL-2, TNF-α and IFN-γ). Nevertheless, this finding hid significant differences in IFN-γ production between CVID and normal CD8+ cells within the CD28 defined CD8+ subsets. Another difference with 16-h stimulation is that the increase in HLA-DR+ cells in CVID seen in circulating cells at 12 h [16] was not sustained. However, the cytokine profile appears not to differ between the HLA-DR− and HLA-DR+ subsets. It is important to comment that the data in this study were obtained from CD8+ cells gated on bright fluorescence. Control experiments showed that these cells and their subsets were totally CD3+ (data not shown), which excludes the complex populations of natural killer (NK) cells which are dimly positive for CD8.
Effects within the CD28 subsets of CD8+ cells seem to be important. The increase in the size of the CD28− subset of circulating CD8 cells in CVID above normal levels [5] was maintained after the 16-h culture with PMA and ionomycin. We also have evidence that the amount of CD28 per cell is reduced in normals on stimulation of the lymphocytes by PMA and ionomycin, but that this does not occur in the already reduced CD28+ subset in CVID (data not shown). Although for TNF-α and IL-2 there was no discrimination between CD28+ or CD28− subsets, the principal finding in the present study is that the raised propensity for CVID cells to make IFN-γ is confined to the proportionally reduced CD28+ subset rather than to the expanded CD28− (‘suppressor’) subset. In addition, a depressed level of activation (judged by low CD69 positivity) was observed in some CVID patients only in this expanded CD28− subset. Comparison of the CD69 data with the IFN-γ expression for each of the CVID donors suggests that the impaired CD69+ activation observed in the CD28− subset correlates with a reduced production of IFN-γ in that subset. By contrast, the raised IFN-γ in the CD28+ subset in CVID occurred under conditions of a high level of cell activation (CD69 positivity).
At present, we can only speculate on the mechanisms that link these profound dysfunctions in the CD8 cells in CVID with the failure of CD4+ cells to produce antigen-specific memory cells and the subsequent B cell antibody deficiency. Clearly, there are two possible areas that may contribute to this effect. First, an increase in the CD28− ‘suppressor’ subset will be detrimental to normal antigen-specific immune responses. Second, since for CD4+ cells the provision of the costimulatory signal though CD28 in the CD28+ cells has been shown to be vital for the expression of CD40 ligand which is essential for B cell help, it is possible that a decline in the numbers and function of CD28+ CD8 cells may also affect CD40 ligand function and thus be detrimental to B cell help.
We have thus found that the increase in IFN-γ production in CD8+ cells in CVID is confined to the CD28+ subset, and also that there is a relative failure in vitro in the maintenance of CD8+ cell activation (as assessed by the expression of the CD69 antigen) in the CD28− subset of CD8+ cells. We conclude that in CVID there is a profound disturbance of the CD8+ T cell subsets and cytokine production which may be linked with the shift towards Th1 in the ‘cytotoxic’ CD28+ population and a failure of activation and IFN-γ production in the ‘suppressor’ CD28− population. This profound phenotypic and functional shift in the CD8+ cells may lead to the failure of CD4+ T cells to respond to antigen, causing the antibody deficiency seen in this disease.
References
- 1.WHO Scientific Group. Primary immunodeficiency diseases. Clin Exp Immunol. 1995;99:1–24. [PMC free article] [PubMed] [Google Scholar]
- 2.Kondratenko I, Amlot PL, Webster ADB, Farrant J. Lack of specific antibody response in common variable immunodeficiency (CVID) associated with failure in production of antigen specific memory T cells. Clin Exp Immunol. 1997;108:9–13. doi: 10.1046/j.1365-2249.1997.d01-993.x. [DOI] [PMC free article] [PubMed] [Google Scholar]
- 3.Gray D. Immunological memory. Ann Rev Immunol. 1993;11:49–77. doi: 10.1146/annurev.iy.11.040193.000405. [DOI] [PubMed] [Google Scholar]
- 4.Waldmann TA, Durm M, Broder S, Blackman M, Blaese RM, Strober W. Role of suppressor T cells in pathogenesis of common variable hypogammaglobulinaemia. Lancet. 1974;2:609–13. doi: 10.1016/s0140-6736(74)91940-0. [DOI] [PubMed] [Google Scholar]
- 5.North ME, Akbar AN, Borthwick N, et al. Co-stimulation with anti-CD28 (Kolt-2) enhances DNA synthesis by defective T cells in common variable immunodeficiency. Clin Exp Immunol. 1994;95:204–8. doi: 10.1111/j.1365-2249.1994.tb06511.x. [DOI] [PMC free article] [PubMed] [Google Scholar]
- 6.Saukkonen JJ, Kornfeld H, Berman JS. Expansion of a CD8+ CD28− cell population in the blood and lung of HIV-positive patients. J AIDS. 1993;6:1194–204. [PubMed] [Google Scholar]
- 7.Lum LG, Orcutt-Thordarson N, Seigneuret MC, Hansen JA. In vitro regulation of immunoglobulin synthesis by T-cell subpopulations defined by a new human T-cell antigen (9·3) Cell Immunol. 1982;72:122–9. doi: 10.1016/0008-8749(82)90289-1. [DOI] [PubMed] [Google Scholar]
- 8.Koide J, Engleman EG. Differences in surface phenotype and mechanism of action between alloantigen-specific CD8+ cytotoxic and suppressor T cell clones. J Immunol. 1990;144:32–40. [PubMed] [Google Scholar]
- 9.Freedman MS, Ruijs TC, Blain M, Antel JP. Phenotypic and functional characteristics of activated CD8+ cells: a CD11b− CD28− subset mediates noncytolytic functional suppression. Clin Immunol Immunopathol. 1991;60:254–67. doi: 10.1016/0090-1229(91)90068-l. [DOI] [PubMed] [Google Scholar]
- 10.Azuma M, Phillips JH, Lanier LL. CD28− T lymphocytes. Antigenic and functional properties. J Immunol. 1993;150:1147–59. [PubMed] [Google Scholar]
- 11.Li SG, Ottenhoff TH, Van den Elsen P, et al. Human suppressor T cell clones lack CD28. Eur J Immunol. 1990;20:1281–8. doi: 10.1002/eji.1830200613. [DOI] [PubMed] [Google Scholar]
- 12.Romagnani S. Lymphokine production by human T cells in disease states. Ann Rev Immunol. 1994;12:227–57. doi: 10.1146/annurev.iy.12.040194.001303. [DOI] [PubMed] [Google Scholar]
- 13.Del Prete G, Maggi E, Romagnani S. Human Th1 and Th2 cells: functional properties, mechanisms of regulation, and role in disease. Lab Invest. 1994;70:299–306. [PubMed] [Google Scholar]
- 14.Sander B, Andersson J, Andersson U. Assessment of cytokines by immunofluorescence and the paraformaldehyde-saponin procedure. Immunol Rev. 1991;119:65–93. doi: 10.1111/j.1600-065x.1991.tb00578.x. [DOI] [PubMed] [Google Scholar]
- 15.Jung T, Schauer U, Heusser C, Neumann C, Rieger C. Detection of intracellular cytokines by flow cytometry. J Immunol Methods. 1993;159:197–207. doi: 10.1016/0022-1759(93)90158-4. [DOI] [PubMed] [Google Scholar]
- 16.North ME, Ivory K, Funauchi M, Webster ADB, Lane AC, Farrant J. Intracellular cytokine production by human CD4+ and CD8+ T cells from normal and immunodeficient donors using directly conjugated anti-cytokine antibodies and three-colour flow cytometry. Clin Exp Immunol. 1996;105:517–22. doi: 10.1046/j.1365-2249.1996.d01-795.x. [DOI] [PMC free article] [PubMed] [Google Scholar]
- 17.North ME, Spickett GP, Webster AD, Farrant J. Raised serum levels of CD8, CD25 and beta 2-microglobulin in common variable immunodeficiency. Clin Exp Immunol. 1991;86:252–5. doi: 10.1111/j.1365-2249.1991.tb05805.x. [DOI] [PMC free article] [PubMed] [Google Scholar]
- 18.Inoue Y, Kondo N, Motoyoshi F, Inoue R, Orii T. Interleukin-2 and interferon-gamma production by peripheral blood lymphocytes of patients with common variable immunodeficiency. J Invest Allergol. Clin Immunol. 1994;4:122–5. [PubMed] [Google Scholar]
- 19.Maggi E, Mazzetti M, Ravina A, et al. Ability of HIV to promote a TH1 to TH0 shift and to replicate preferentially in TH2 and TH0 cells. Science. 1994;265:244–8. doi: 10.1126/science.8023142. [DOI] [PubMed] [Google Scholar]
- 20.Lester MR, Hofer MF, Gately M, Trumble A, Leung DY. Down-regulating effects of IL-4 and IL-10 on the IFN-gamma response in atopic dermatitis. J Immunol. 1995;154:6174–81. [PubMed] [Google Scholar]
- 21.Ghalib HW, Whittle JA, Kubin M, et al. IL-12 enhances Th1-type responses in human Leishmania donovani infections. J Immunol. 1995;154:4623–9. [PubMed] [Google Scholar]
- 22.Chensue SW, Warmington KS, Ruth J, Lincoln PM, Kunkel SL. Cross-regulatory role of interferon-gamma (IFN-gamma), IL-4 and IL-10 in schistosome egg granuloma formation: in vivo regulation of Th activity and inflammation. Clin Exp Immunol. 1994;98:395–400. doi: 10.1111/j.1365-2249.1994.tb05503.x. [DOI] [PMC free article] [PubMed] [Google Scholar]
- 23.Zhang M, Gong J, Iyer DV, Jones BE, Modlin RL, Barnes PF. T cell cytokine responses in persons with tuberculosis and human immunodeficiency virus infection. J Clin Invest. 1994;94:2435–42. doi: 10.1172/JCI117611. [DOI] [PMC free article] [PubMed] [Google Scholar]
- 24.Romagnani S. Human TH1 and TH2 subsets: “eppur si muove”. European Cytokine Network. 1994;5:7–12. [PubMed] [Google Scholar]
- 25.Crucian B, Dunne P, Friedman H, Ragsdale R, Pross S, Widen R. Alterations in levels of CD28− /CD8+ suppressor cell precursor and CD45RO+ /CD4+ memory T lymphocytes in the peripheral blood of multiple sclerosis patients. Clin Diagn Lab Immunol. 1995;2:249–52. doi: 10.1128/cdli.2.2.249-252.1995. [DOI] [PMC free article] [PubMed] [Google Scholar]
- 26.Sfikakis PP, Zografou A, Viglis V, et al. CD28 expression on T cell subsets in vivo and CD28-mediated T cell response in vitro in patients with rheumatoid arthritis. Arthritis Rheum. 1995;38:649–54. doi: 10.1002/art.1780380512. [DOI] [PubMed] [Google Scholar]
- 27.Vingerhoets JH, Vanham GL, Kestens LL, et al. Increased cytolytic T lymphocyte activity and decreased B7 responsiveness are associated with CD28 down-regulation on CD8+ T cells from HIV-infected subjects. Clin Exp Immunol. 1995;100:425–33. doi: 10.1111/j.1365-2249.1995.tb03717.x. [DOI] [PMC free article] [PubMed] [Google Scholar]
- 28.Zanussi S, Simonelli C, D'Andrea M, et al. CD8+ lymphocyte phenotype and cytokine production in long-term non-progressor and in progressor patients with HIV-1 infection. Clin Exp Immunol. 1996;105:220–4. doi: 10.1046/j.1365-2249.1996.d01-746.x. [DOI] [PMC free article] [PubMed] [Google Scholar]
- 29.Hoxie JA, Matthews DM, Callahan KJ, Cassel DL, Cooper RA. Transient modulation and internalization of T4 antigen induced by phorbol esters. J Immunol. 1986;137:1194–201. [PubMed] [Google Scholar]


