Abstract
Immunoenzymatic assays were developed for the measurement of antibodies against mycobacterial lipoarabinomannan (LAM), a cell-free proteic extract (CFX) of Mycobacterium leprae, and the 38-kD protein antigen of M. tuberculosis. Sera from 108 leprosy patients, belonging to all clinical–immunological forms of the spectrum, and 81 patients with localized or disseminated tuberculosis (TB) were tested for antibodies of the four IgG subclasses. Standard calibration curves were used to allow comparisons between results of different isotypes and specificities. Mean concentrations of total IgG antibodies were higher in the overall leprosy population than in TB patients. In leprosy, levels of anti-CFX increased from tuberculoid toward lepromatous forms, with a clear switch from IgG1 to IgG2 subclass predominance. A similar IgG1 to IgG2 conversion was observed in anti-LAM antibodies, although total levels of anti-LAM were similar in patients with tuberculoid and lepromatous forms. In TB, antibodies against polysaccharide and protein antigens were both predominantly of IgG1 subclass, whatever the patient's clinical status, although lower in disseminated forms, probably due to concomitant HIV infection. A hypergammaglobulinaemia was also found in most leprosy and TB patients. In TB this was due to increased IgG1 and IgG3, especially in HIV co-infected patients. Based on the current knowledge of the influence of T cell-secreted cytokines on human immunoglobulin isotype expression, these results do not fit with a putative role of Th1 (such as found in TB and tuberculoid leprosy (TT)) and Th2 (such as found in leprosy lepromatous (LL) leprosy) environment in the isotypy of antibody responses in mycobacterial infections. Nor do variations of isotypy according to pathological conditions seem to be related to the biochemical nature of antigens, since antibodies to LAM and protein antigens had comparable evolutions of their subclass distribution. Other factors are to be investigated in order to understand better the significance and possible roles of antibodies in mycobacterial diseases.
Keywords: leprosy, tuberculosis, IgG subclasses
INTRODUCTION
The humoral immune response is characterized by an isotypic diversity of antibodies with different effector functions, in particular complement activation and binding to phagocytic and killer cells through Fc receptors. Antibodies of the IgG class are the predominant components of mature humoral responses in most infections. They include four subclasses, which differ by their effector functions and metabolic properties [1, 2]. Efficient humoral responses require a cooperation between B cells and specific T helper (Th) cells. In mice, and to a lesser extent in humans, Th cells may be divided into two distinct subpopulations according to the cytokines they secrete and their effector functions. Th1 cells mainly produce IL-2, interferon-gamma (IFN-γ), and tumour necrosis factor-beta (TNF-β), and they stimulate a cellular DTH response. In contrast, Th2 cells produce IL-4, IL-5, IL-10 and IL-13, and they are mostly involved in B cell help. Cytokines and B cell activators influence the expression of certain immunoglobulin isotypes [3]. Some cytokines stimulate the expansion of B cells precommitted to a given isotype: thus, IFN-γ was shown to induce the secretion of human IgG2 by IgG2-bearing B cells in vitro [4]. Other cytokines are real switch inducers: IL-4 and IL-13 induce an isotype switch towards IgG4 and IgE antibodies [5–7], and IL-10 is a switch factor for IgG1 and IgG3 [8].
In addition, the isotypic restriction of antibodies is correlated with the biochemical nature of antigens: most antibodies against proteins are of IgG1 and IgG3 isotypes, while in those against carbohydrates IgG2 is over-represented. This is reflected in vivo where, for instance, antibody responses to viral proteins are mainly of IgG1 and IgG3 subclasses [9]. In contrast, bacteria carbohydrates usually induce a type 2 T-independent response, mainly of IgG1 and IgG2 isotypes [10, 11].
The respective roles of the cytokine microenvironment and the antigenic nature in determining the isotype profile of humoral responses in vivo are still unclear. In this respect, studies in Mycobacterium leprae infections may be particularly revealing because of the clear Th1–Th2 dichotomy [12, 13]. Leprosy is a spectral disease, where the clinical presentations correlate with the level of cell-mediated immunity. At one end of the spectrum, patients present with a resistant and localized form (tuberculoid leprosy), associated with a strong and efficient cell-mediated immune response driven by IFN-γ. At the opposite end of this spectrum, patients present with a susceptible and disseminated form (lepromatous leprosy) associated with the absence of cell-mediated response and the predominance of a non-protective humoral response induced by IL-4. In between these two extremes are various intermediate clinical–immunological forms known as borderline leprosy. This dichotomy has not been demonstrated in infection by M. tuberculosis [14]. Although the localized forms of the disease are associated with a strong IFN-γ response [15], the disseminated forms are found to have a IFN-γ decrease, but no elevated IL-4 production [16]. The other attractive feature that mycobacteria offer for our purpose is that they elicit an antibody response against a variety of antigenic determinants. Mycobacteria have a cell wall made of lipids and polysaccharides, and during multiplication they secrete proteins.
In this study, we analyse the isotypic distributions of antibodies directed to mycobacteria antigens of different biochemical nature, namely proteins (38-kD M. tuberculosis antigen, and a cell-free extract (CFX) from M. leprae) and a polysaccharide (lipoarabinomannan (LAM)), in sera obtained from leprosy and tuberculosis (TB) patients presenting with localized and disseminated forms of disease. Analyses of antibody IgG subclasses by conventional indirect ELISA methods do not allow precise comparisons of immunoglobulin concentrations. Serum samples are often tested at a single dilution, while antibody levels are highly variable and unpredictable. Also, anti-subclass MoAbs display very different affinities [17], which prevent direct comparisons of the signals obtained for each isotype. In the current study, we develop ELISA tests in which calibration curves, derived from known concentrations of monoisotypic immunoglobulin, convert optical densities (OD) to putative antibody concentrations that may be compared with each other.
MATERIALS AND METHODS
The study population
The study population consisted of 189 patients with active mycobacterial infections. All patients were clinically examined, and sera were collected upon bacterial confirmation or during the first week of treatment. One hundred and eight patients (44 females, 64 males, age 4–85 years, mean 31 years) presented with active leprosy disease. The different forms of leprosy were defined by the Ridley & Jopling classification [18] according to clinical symptoms, bacteriological results, histopathological examination of skin biopsy, and intradermal reaction with lepromin (Mitsuda test). The leprosy population included 36 patients with tuberculoid leprosy (TT), 21 borderline tuberculoid (BT), 25 borderline borderline (BB), 15 borderline lepromatous (BL), and 11 leprosy lepromatous (LL) forms of leprosy. All patients were HIV seronegative. Eighty-one patients (16 females, 65 males, age 1–93 years, mean 40 years) had TB. All were clinically ill and had positive cultures from sputa, and/or extrapulmonary sites. Forty-eight patients presented with pulmonary TB. In addition, there were 33 cases of disseminated or extrapulmonary forms of TB, including eight with mycobacteraemia, seven pleuritis, five tuberculous lymphadenitis, four laryngeal TB, three meningitis, three miliary TB, two kidney TB and one intestinal TB. Forty-one of the TB patients were HIV+.
Serum total IgG subclass level
Serum total IgG subclass levels were measured with competitive immunenzymatic assays (ELISA), using MoAbs as described in detail previously [19]. Briefly, 96-well polystyrene plates (Nunc, Roskilde, Denmark) were coated by overnight incubation at 4°C with 200 μl/well of 5 μg/ml polyclonal human IgG (for IgG1 and IgG2), 0·25 μg/ml purified myeloma IgG3, or 0·5 μg/ml of purified IgG4 in 0·1 m sodium carbonate buffer pH 9·6. Test sera were incubated for 18 h at 4°C with the corresponding anti-subclass MoAbs. The working dilutions were 10−4 for anti-IgG1 (clone NL16; Unipath, Bedford, UK) and anti-IgG2 (clone GOM2; Unipath), 10−6 for anti-IgG3 (clone ZG4; Unipath), and 2·5 × 10−5 for anti-IgG4 (clone RJ4; Unipath). The bound fraction was revealed with a peroxidase-conjugated rabbit anti-mouse IgG antibody (Jackson Immunochemicals, West Grove, PA). All samples were tested in triplicate at least twice in independent assays, and results were analysed in comparison with previously established normal values [20].
Specific IgG subclass antibodies
Specific IgG subclass antibodies against mycobacterial antigens were evaluated by indirect ELISA assays designed for quantitative measurements in weight:volume, using standard curves derived from calibrated myeloma immunoglobulins of the relevant subclass captured by solid-phase anti-F(ab′)2. Sera collected from leprosy patients were tested against a CFX of M. leprae (batch no. 228 [21], kindly provided by J. Colston, London, through the IMMLEP programme of WHO) and LAM (gift from P. Brennan, Colorado). Sera from TB patients were tested against 38-kD recombinant protein [22] and LAM antigens. Immulon 4 plates (Dynatech, Chantilly, VA) were coated overnight at 4°C with antigens diluted in 0·1 m carbonate buffer pH 9·6 at concentrations of 1 μg/ml, 10 μg/ml and 5 μg/ml for LAM, 38-kD and CFX, respectively.
Optimal working dilutions of the test sera were determined in preliminary experiments. Serial five-fold dilutions of each serum sample in 0·15 m NaCl 10 mm PBS pH 7·4 with 2% bovine serum albumin (PBS–BSA) were incubated for 3 h at room temperature in a plate coated with the corresponding antigen. After washing, bound IgG was revealed by sequential probing for 1 h at room temperature with an anti-γ MoAb (clone GG7; Sigma, St Louis, MO), and peroxidase-conjugated rabbit anti-mouse IgG antibody preabsorbed with cross-reacting human serum proteins (Jackson Immunochemicals). Dilutions yielding OD at 70% of the plateau were chosen for further isotype-specific antibody level determinations, in order to ensure that solid-phase antigen was in excess. When no plateau was evident at a dilution of 1:5, samples were further tested at 1:10 dilution.
In the antibody quantification experiments, each assay included a calibration curve obtained with either purified polyclonal IgG (for IgG1 determination), or IgG2, IgG3, or IgG4 myeloma proteins previously calibrated by spectrophotometry at 280 nm. For the standard curve, 12 wells were coated with 50 μl/well of goat antibodies specific for the human IgG F(ab′)2 fragment (Sigma) at 1·7 μg/ml in 0·1 m sodium carbonate buffer pH 9·6, at 4°C overnight, and the remaining wells in the plate were coated with the bacterial antigens for the test samples.
All samples were diluted in PBS–BSA, and 50 μl were incubated for 3 h at room temperature in triplicates in antigen-coated wells for the samples. Standard IgG proteins were incubated in duplicates in anti-F(ab′)2 antibody-coated wells. Concentrations of standard immunoglobulin were 10, 50, 250, 1250 and 6250 ng/ml polyclonal IgG (corresponding to 8–5000 ng/ml IgG1) for IgG1, 1·6, 8, 40, 200 and 1000 ng/ml for IgG2, 0·8, 4, 20, 100 and 500 ng/ml for IgG3, and 0·24, 1·2, 6, 30 and 150 ng/ml for IgG4. After washing five times with PBS–0·5% Tween 20, 50 μl/well of IgG subclass-specific MoAbs anti-IgG1 (clone NL16; Unipath), anti-IgG2 (clone HP6014; Sigma), anti-IgG3 (clone ZG4; Unipath), or anti-IgG4 (clone RJ4; Unipath) were added at 1:5000, 1:3000, 1:10 000 and 1:3000 dilutions, respectively, in PBS–BSA. Following overnight incubation at 4°C, plates were washed as before and revealed for 1 h at room temperature by a horseradish peroxidase (HRP)-conjugated goat anti-mouse IgG antibody (Caltag, Burlingame, CA) diluted 1:2000 in PBS–BSA. Substrate solution (200 μl) consisting of 0·33 mg/ml o-phenylenediamine (Sigma), 0·01% hydrogen peroxide in 0·1 m sodium citrate pH 5 was added to each well and the reaction was stopped after 15 min with 50 μl/well of 4 n sulphuric acid. ODs were recorded at 490 nm. Concentrations of specific antibodies for each sample were calculated using the corresponding standard curve after blank subtractions, using program Biolise (Life Science Int., Cergy-Pontoise, France).
Correlations were analysed by linear regression, and mean values were compared using the Mann–Whitney test, or the Wilcoxon's test for paired series. Categoric valuables were compared by the χ2 test with the Yates' correction when at least one of the calculated figures was < 5.
RESULTS
Total serum IgG and IgG subclasses
Fifty-seven percent of all leprosy patients had total IgG levels > 14 mg/ml, which is the upper limit of normal values by this assay method [20]. The elevation was particularly notable in IgG1 (Fig. 1). When categorized by disease forms, significantly elevated levels of IgG were present in 100% of LL patients and only 53% of patients presenting other forms of leprosy (χ2c = 7·27, P < 0·01). The difference between the tuberculoid and lepromatous forms was mainly in the IgG2 (mean values 2·77 mg/ml and 4·72 mg/ml, respectively) and IgG3 (0·45 mg/ml and 0·92 mg/ml, respectively) (Fig. 1). Between IgG2 and IgG3 a positive correlation was found (r = 0·39, P < 0·0001), although all IgG subclass mean levels were above values found in a normal population [20].
Fig. 1.
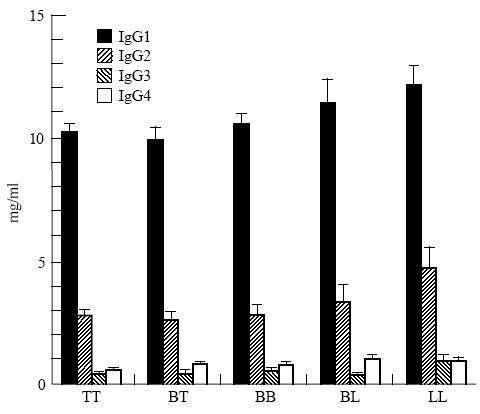
Total serum IgG subclass levels in leprosy patients (means and s.e.m.), according to pathological forms of disease. TT, tuberculoid leprosy; BT, borderline tuberculoid; BB, borderline borderline; BL, borderline lepromatous; LL, lepromatous leprosy.
Forty-eight percent of TB patients also had elevated total IgG levels, mainly due to increased IgG1 and IgG3. This was more pronounced among the HIV+ population, where mean IgG1 and IgG3 were significantly higher and IgG2 levels were lower than among the HIV− population (Table 1). Patients with disseminated forms of TB also had higher mean IgG1 (18·5 mg/ml in disseminated versus 12·0 mg/ml in non-disseminated forms, P < 0·02) and lower IgG2 (1·12 mg/ml in disseminated versus 2·30 mg/ml in non-disseminated forms, P < 0·03) levels (Fig. 2). This might be explained by the fact that all patients with disseminated TB were HIV+. Indeed, IgG subclass concentrations in patients with disseminated TB were not significantly different from those of HIV+ patients with localized forms of disease (data not shown).
Table 1.
Comparison of total, anti-lipoarabinomannan (LAM) and anti-38-kD antigen IgG subclass levels among tuberculosis patients with and without HIV infection (mean ± s.d.)
Fig. 2.
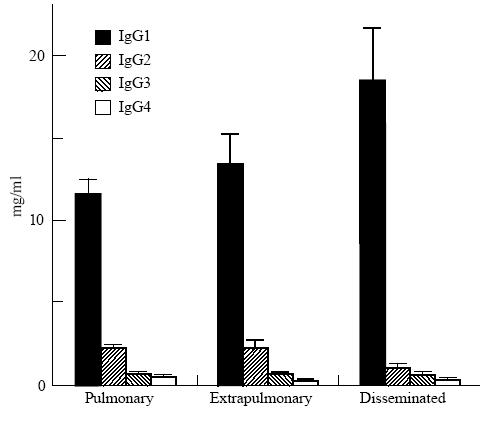
Total serum IgG subclass levels in tuberculosis patients (means and s.e.m.) according to clinical presentations. Pulmonary, pulmonary tuberculosis; extrapulmonary, tuberculosis other than pulmonary or disseminated; disseminated, disseminated tuberculosis.
Specific responses to LAM and CFX antigens in leprosy patients
Mean levels of antibodies to CFX were significantly more elevated than anti-LAM antibodies (P < 0·001) in the overall leprosy population. This difference was also observed in all individual subclasses. Levels of anti-LAM and anti-CFX antibodies were significantly correlated (r = 0·38, P < 0·0001), indicating parallel humoral responses of both specificities (Fig. 3). A correlation was also found between anti-CFX antibodies and total IgG levels (r = 0·28, P = 0·002), but not between anti-LAM and total IgG.
Fig. 3.
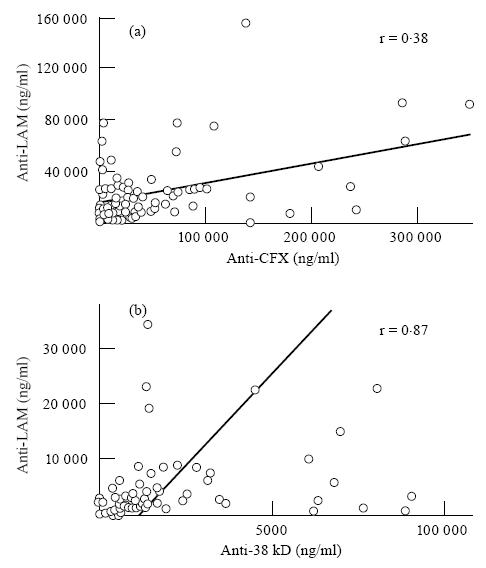
Linear regression analysis of the correlations between anti-lipoarabinomannan (LAM) and anti-cell-free proteic extract (CFX) antibody levels in leprosy patients (a), and between anti-LAM and anti-38-kD antibodies in tuberculosis patients (b). Because of a high dispersion of figures, values > 160 000 and 40 000 ng/ml for anti-LAM in (a) and (b), respectively, 350 000 ng/ml for anti-CFX and 12 000 ng/ml for anti-38 kD are not represented.
The serum mean concentration of IgG antibodies against CFX antigen varied according to the different immunopathological categories (Fig. 4). It was very prominent in the BL and the LL groups. By comparison, a moderate level of anti-LAM antibodies was maintained throughout all pathological groups.
Fig. 4.
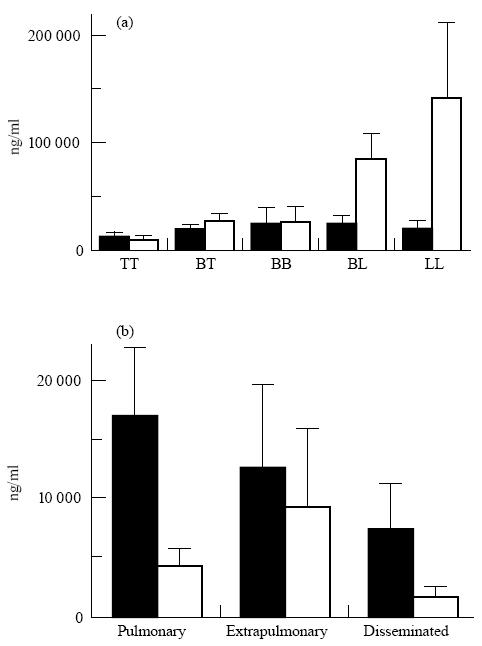
Mean values and s.e.m. of specific anti-lipoarabinomannan (LAM; ▪) and anti-protein antigens (CFX and 38-kD antigen; □) IgG (sum of subclasses) antibody levels in leprosy (a) and tuberculosis (b) patients according to pathological forms. TT, tuberculoid leprosy; BT, borderline tuberculoid; BB, borderline borderline; BL, borderline lepromatous; LL, lepromatous leprosy.
IgG1 was the predominant isotype in antibodies against both antigens and among all pathological forms, except for the LL group, where IgG2 predominated (Fig. 5). Antibodies against both antigens progressively switched from IgG1 in TT and borderline groups to IgG2 predominance in LL patients. Tables 2 and 3 sum up analyses of correlation between levels of different isotypes of the same specificity, and between subclass levels of specific antibodies and total serum IgG.
Fig. 5.
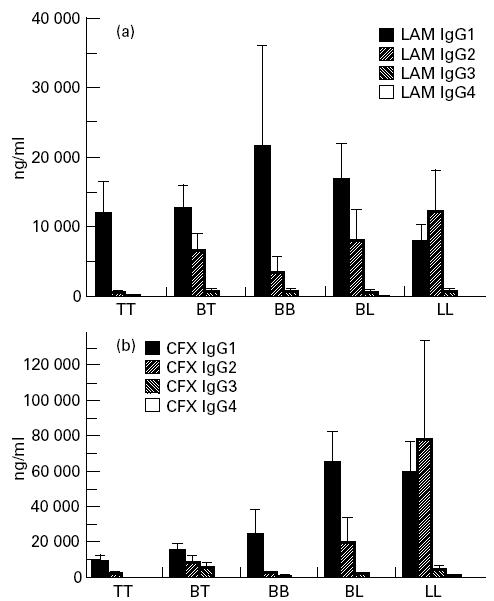
Mean values and s.e.m. of anti-lipoarabinomannan (LAM) (a) and anti-cell-free proteic extract (CFX) (b) antibody IgG subclasses in leprosy patients, according to pathological forms.
Table 2.
Correlations between IgG subclass levels of antibodies of each specificity in leprosy and tuberculosis (TB) patients
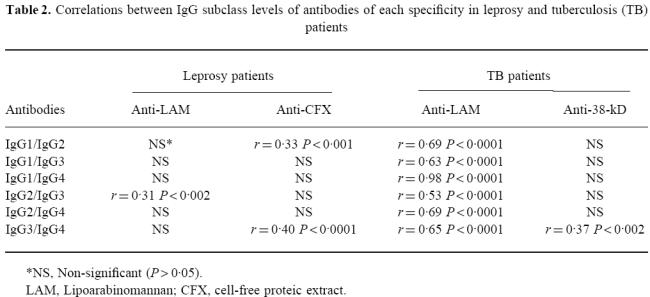
Table 3.
Correlations between specific antibody and total IgG serum levels of each subclass in leprosy and tuberculosis (TB) patients
Specific responses to LAM and 38-kD antigens in TB patients
Although the mean values of anti-LAM levels were more than three-fold lower in TB compared with leprosy patients (P < 10−4), they were over two-fold higher than those of anti-38-kD antibodies (P = 0·002), contrasting with leprosy, where the anti-CFX antibody response predominated. In individual patients a strong correlation was detected between anti-LAM and anti-38-kD antibody concentrations (Fig. 3) (r = 0·87, P < 0·0001).
IgG1 was the predominant isotype in both anti-LAM and anti-38-kD antibody responses; the latter was almost restricted to this isotype (Fig. 6). Linear regression analyses showed a highly significant correlation between all subclass levels of anti-LAM antibodies (r = 0·53–0·98, P < 0·0001 for all combinations); no such link was evident in anti-38-kD antibodies, which were almost completely restricted to IgG1.
Fig. 6.
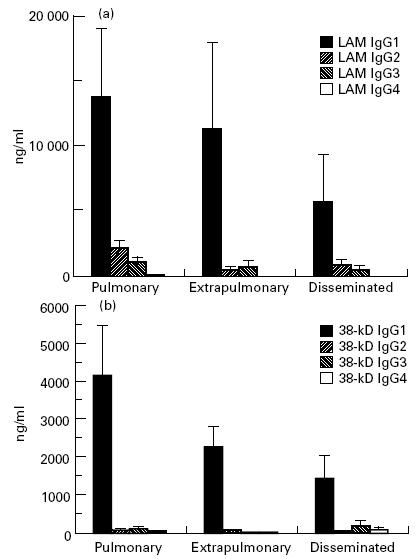
Mean values and s.e.m. of anti-lipoarabinomannan (LAM) (a) and anti-38-kD antigen (b) antibody IgG subclasses in tuberculosis patients, according to pathological forms.
Specific antibody subclass levels were generally lower in HIV+ individuals; however, due to their high degree of variability, the difference was only statistically significant for anti-LAM IgG3 and IgG4, and for anti-38-kD IgG2 (Table 1). Among the HIV+ population, no correlation was found between the number of CD4 cells and levels of anti-38-kD or anti-LAM antibodies for total IgG or any IgG subclass (data not shown). All subclass levels of anti-LAM antibodies were significantly correlated to each other, while no correlation was found between subclass levels of anti-LAM, anti-38-kD antibodies and total serum IgG (Tables 2 and 3).
DISCUSSION
In some infectious diseases, such as leishmaniasis [23] and leprosy in humans [24], associations between the clinical–immunological spectrum and the Th1–Th2 dichotomy are well established, although the regulation of IgG subclass switch by cytokines in these conditions remains unclear. In vitro studies have demonstrated that certain cytokines may either stimulate the expansion of B cells precommitted to a given isotype [4] or induce a real isotype switching of IgM-bearing B lymphocytes [5–8]. It is thus expected that isotype distribution of antibodies at the different poles of the leprosy immune spectrum is influenced by the cytokine dominance. Our results show that IgG1 is the predominant antibody isotype present in tuberculoid and borderline forms of leprosy, and IgG2 is the predominant isotype in lepromatous forms. Similarly, in TB, where the specific pattern of cytokines is Th1, the prevalent antibody subclass is IgG1 for all forms of disease, regardless of patient HIV status, although its levels are significantly decreased in extrapulmonary and disseminated forms. These observations suggest that IgG1 is the dominant isotype in a Th1 cytokine response, as observed in TT and borderline forms of leprosy and in all forms of TB, and the subclass profile switches to IgG2 predominance when the cytokine environment shifts to Th2, as observed in lepromatous leprosy. In the light of current knowledge, this switch from IgG1 to IgG2 in localized versus disseminated forms of leprosy can not be explained by the increased IL-4 nor by the decreased IFN-γ production, and thus remains to be elucidated.
Besides the cytokine environment, other factors may influence the antibody isotypic distribution, such as the nature of antigens. Indeed, it has been demonstrated that antigens of different biochemical natures determine the production of different IgG subclasses [2]. Here, we observed that although some antibody responses are restricted to certain isotypes, such as the 38-kD restriction to IgG1, the overall profile of antibody subclasses does not change as a function of the antigen nature. The IgG2 prevalence observed among lepromatous patients was maintained in both responses to polysaccharide and protein antigens, and the IgG1 profile found in all other forms of leprosy and in the TB patients was also maintained in response to both polysaccharide and protein antigens. These observations rule out a possible dominance of the antigen nature in the isotype distribution, as well as the hypothesis that the dominant antigens in a Th1 response might be of protein origin, while in a Th2 environment the response might be determined by LAM. In fact, the increased humoral responses observed in the lepromatous pole of leprosy were essentially related to anti-protein antibodies.
Other studies focused on the IgG subclass distribution of anti-mycobacterial antibodies found contradictory results. In disseminated forms of leprosy, Hussain et al. found mainly IgG1- and IgG3-specific antibodies against M. leprae sonicate [25], while according to Dhandayuthapani et al. [26] IgG2 was the predominant isotype against both sonicate and LAM antigens. In TB, Da Costa et al. [27] observed that the predominant isotype against LAM was IgG2, regardless of the association with HIV co-infection, although in patients with concomitant HIV infection the levels of IgG1 and IgG4 were increased, relative to HIV− patients. The major cause of this confusion is that the basic design of most assays performed in these studies only allowed comparisons between samples for a given isotype, but not from one isotype to another. Indeed, subclass-specific MoAbs display extremely different affinities [17]. In order to calculate approximate values expressed in w:v, we set up ELISA tests including calibration curves, in which standard immunoglobulins are captured by the Fab part, thus mimicking antibody–antigen binding. Exposure of epitopes recognized by the second antibody is expected to be comparable to that of antibodies bound to solid-phase antigens. In addition, dilution experiments were performed for every single sample and dilutions yielding 70% of the plateau were chosen for the specific antibody assays. This previous precaution ensured that coated antigens were never saturated with the patients' antibodies, a necessary condition for quantitative comparisons. Although our method still remains prone to certain bias, such as possible different binding rates of standard immunoglobulin to the solid-phase anti-Fab antibody according to subclasses, it should allow acceptable comparisons of results between isotypes and antigenic specificities. Antibodies specific for human IgG2 subclass were demonstrated to be prone to certain pitfalls. Thus, antibody HP6014 may react more strongly with λ-type molecules; however, such bias is only significant in fluid-phase antigen–antibody reactions, and not when IgG2 antibodies are bound to a solid surface [28].
In leprosy, the level of total antibody responses is clearly different from one pathological group to another. It has been demonstrated previously that higher levels of antibodies to LAM and a crude bacterial sonicate [26] featured borderline and lepromatous forms. This pattern is even more striking in our series for anti-CFX response.
In all forms of leprosy disease, anti-CFX antibody levels are more elevated than anti-LAM antibodies, while in TB anti-LAM antibodies are higher than anti-38-kD antibodies. While CFX is a crude protein extract from M. leprae, 38 kD is a recombinant protein of M. tuberculosis, which is a possible explanation for the differences encountered. However, it is worth noting that anti-LAM antibodies are more elevated in leprosy than in TB.
The magnitude of elevation in total serum IgG concentration suggests that the effect of mycobacteriosis is not restricted to production of specific antibodies, but may also involve a non-specific polyclonal B cell activation. Indeed, even patients with low specific antibody levels, such as in the TT leprosy group, had high total serum IgG concentrations. It is conceivable that cytokines produced after most types of T cell activation, such as IL-2 and IL-6, may be partially responsible for increased IgG levels, as demonstrated in vitro [4] and after IL-2 infusion to patients [29].
In TB, no correlation could be demonstrated between IgG level and the corresponding specific antibody subclass levels. Although HIV− patients also have elevated IgG1, an increase in IgG1 and IgG3 is more important in HIV+ patients, and IgG levels do not differ between patients with localized and disseminated forms of TB among the HIV− population. As previously described [30], HIV-infected patients have higher IgG1 and IgG3 and lower IgG2 and IgG4 concentrations, a situation frequently encountered in individuals with chronic infections and T cell deficiencies [31]. In contrast, in leprosy patients all subclasses of IgG are increased and most specific antibody levels are significantly correlated to total serum IgG1, IgG2 and IgG4 subclasses for anti-LAM, and IgG1 and IgG4 for anti-CFX. Thus, in contrast to TB patients, the hypergammaglobulinaemia observed in leprosy patients might be partially explained by the presence of higher concentrations of antibodies. Likewise, the slightly more pronounced elevation of total serum IgG in the LL group may account for the increased IgG2 antibodies. Although IgG2 and IgG4 serum levels are typically lower in children, in our study the presence of some children does not affect our conclusions: indeed, among TB patients only three are less than 16 years of age and all are HIV−; in the leprosy population, distributions of the 23 children in all groups of the spectrum are not significantly different. Thus, the increased serum IgG2 in LL form of leprosy and its decrease in HIV+ TB patients cannot be accounted for by different proportions of children.
Our observations suggest that factors related to the clinical–immunological spectrum of mycobacterial infections clearly influence the isotypic distribution of the IgG antibody responses, in a way which may be explained by neither the single Th1 and Th2 cytokine profiles, nor the biochemical nature of antigens. Since antibody levels are higher in patients with more severe forms, with the exception of HIV-infected immunodeficient individuals, it is conceivable that this humoral response results from yet undetermined mechanisms more or less independent of the cellular events occurring in the lesions.
References
- 1.Burton DR, Gregory L, Jefferis R. Aspects of the molecular structure of IgG subclasses. Monogr Allergy. 1986;19:7–35. [PubMed] [Google Scholar]
- 2.Normansell DE. Human immunoglobulin subclasses. Diagn Clin Immunol. 1987;5:115–28. [PubMed] [Google Scholar]
- 3.Snapper CM, Marcu K, Zelazowski P. The immunoglobulin class switch: beyond ‘accessibility’. Immunity. 1997;6:217–23. doi: 10.1016/s1074-7613(00)80324-6. [DOI] [PubMed] [Google Scholar]
- 4.Kawano Y, Noma T. Role of interleukin-2 and interferon-γ in inducing production of IgG subclasses in lymphocytes of human newborns. Immunol. 1996;88:40–48. doi: 10.1046/j.1365-2567.1996.d01-634.x. [DOI] [PMC free article] [PubMed] [Google Scholar]
- 5.Gauchat JF, Lebman DA, Coffman RL, Gascan H, de Vries JE. Structure and expression of germline ε transcripts in human B cells induced by interleukin 4 to switch to IgE production. J Exp Med. 1990;172:463–73. doi: 10.1084/jem.172.2.463. [DOI] [PMC free article] [PubMed] [Google Scholar]
- 6.King CL, Nutman TB. IgE and IgG subclass regulation by IL-4 and IFN-γ in human helminth infections. J Immunol. 1993;151:458–65. [PubMed] [Google Scholar]
- 7.Punnonen J, Aversa G, Cocks BG, McKenzie AN, Menon S, Zurawski G, de Waal Malefyt R, de Vries JE. Interleukin 13 induces interleukin 4-independent IgG4 and IgE synthesis and CD23 expression by human B cells. Proc Natl Acad Sci USA. 1993;90:3730–4. doi: 10.1073/pnas.90.8.3730. [DOI] [PMC free article] [PubMed] [Google Scholar]
- 8.Brière F, Servet-Delprat C, Bridon JM, Saint-Rémy JM, Banchereau J. Human interleukin 10 induces naive surface immunoglobulin D+ (sIgD+) B cells to secrete IgG1 and IgG3. J Exp Med. 1994;179:757–62. doi: 10.1084/jem.179.2.757. [DOI] [PMC free article] [PubMed] [Google Scholar]
- 9.Skvaril F. IgG subclasses in viral infections. Monogr Allergy. 1986;19:134–43. [PubMed] [Google Scholar]
- 10.Freijd A, Hammarström L, Persson MAA, Smith CIE. Plasma anti-pneumococcal antibody activity of the IgG class and subclasses in otitis prone children. Clin Exp Immunol. 1984;56:233–8. [PMC free article] [PubMed] [Google Scholar]
- 11.Shackelford PG, Granoff DM, Nelson SJ, Scott MG, Smith DS, Nahm MH. Subclass distribution of human antibodies to Haemophilus influenzae type b capsular polysaccharide. J Immunol. 1987;138:587–92. [PubMed] [Google Scholar]
- 12.Yamamura M, Uyemura K, Deans R, Weinberg K, Rea T, Bloom B, Modlin R. Defining protective responses to pathogens: cytokine profiles in leprosy lesions. Science. 1991;254:277–9. doi: 10.1126/science.254.5029.277. [DOI] [PubMed] [Google Scholar]
- 13.Misra N, Murtaza A, Walker B, et al. Cytokine profile of circulating T cells of leprosy patients reflects both indiscriminate and polarized T-helper subsets: T-helper phenotype is stable and uninfluenced by related antigens of Mycobacterium leprae. Immunol. 1995;86:97–103. [PMC free article] [PubMed] [Google Scholar]
- 14.Surcel HM, Troye-Blomberg M, Paulie S, Anderson G, Moreno C, Pasvol G. Th1/Th2 profiles in tuberculosis based on proliferation and cytokine response of peripheral blood lymphocytes to mycobacterial antigens. Immunol. 1994;81:171–6. [PMC free article] [PubMed] [Google Scholar]
- 15.Barnes PF, Lu S, Abrams J, Wang E, Yamamura M, Modlin R. Cytokine production at the site of disease in human tuberculosis. Infect Immun. 1993;61:3482–9. doi: 10.1128/iai.61.8.3482-3489.1993. [DOI] [PMC free article] [PubMed] [Google Scholar]
- 16.Zhang M, Gong J, Iyer DV, Jones BE, Modlin RL, Barnes PF. T cell cytokine responses in persons with tuberculosis and human immunodeficiency virus infections. J Clin Invest. 1994;94:2435–42. doi: 10.1172/JCI117611. [DOI] [PMC free article] [PubMed] [Google Scholar]
- 17.Jefferis R, Reimer C, Skvaril F, et al. Evaluation of monoclonal antibodies having specificity for human IgG sub-classes: results of an IUIS/WHO collaborative study. Immunol Letters. 1987;10:223–52. doi: 10.1016/0165-2478(85)90082-3. [DOI] [PubMed] [Google Scholar]
- 18.Ridley DS, Jopling WH. Classification of leprosy according to immunity. A five group system. Int J Leprosy. 1966;34:255–73. [PubMed] [Google Scholar]
- 19.Aucouturier P, Danon F, Daveau M, et al. Measurement of serum IgG4 levels by a competitive immunoenzymatic assay with monoclonal antibodies. J Immunol Methods. 1984;74:151–62. doi: 10.1016/0022-1759(84)90376-4. [DOI] [PubMed] [Google Scholar]
- 20.Aucouturier P, Mounir S, Preud'homme JL. Distribution of IgG subclass levels in normal adult sera as determined by a competitive enzyme immunoassay using monoclonal antibodies. Diagn Immunol. 1985;3:191–6. [PubMed] [Google Scholar]
- 21.Ibrahim MA, Lamb FI, Colston MJ. Analysis of variation in batches of armadillo-derived Mycobacterium leprae by immunoblotting. Int J Leprosy. 1990;58:73–77. [PubMed] [Google Scholar]
- 22.Singh M, Andersen A, McCarthy J, Rohde M, Schütte H, Sanders E, Timmis K. The Mycobacterium tuberculosis 38-kDa antigen: overproduction in Escherichia coli, purification and characterization. Gene. 1992;117:53–60. doi: 10.1016/0378-1119(92)90489-c. [DOI] [PubMed] [Google Scholar]
- 23.Pirmez C, Yamamura M, Uyemura KM, Paes-Oliveira M, Conceição-Silva F, Modlin RL. Cytokine patterns in the pathogenesis of human leishmaniasis. J Clin Invest. 1993;91:1390–5. doi: 10.1172/JCI116341. [DOI] [PMC free article] [PubMed] [Google Scholar]
- 24.Modlin RL. Th1-Th2 paradigm: insights from leprosy. J Invest Dermatol. 1994;102:828–32. doi: 10.1111/1523-1747.ep12381958. [DOI] [PubMed] [Google Scholar]
- 25.Hussain R, Kifayet A, Chiang TJ. Immunoglobulin G1 (IgG1) and IgG3 antibodies are markers of progressive disease in leprosy. Infect Immun. 1995;63:410–5. doi: 10.1128/iai.63.2.410-415.1995. [DOI] [PMC free article] [PubMed] [Google Scholar]
- 26.Dhandayuthapani S, Izumi S, Anandan D, Bhatia VN. Specificity of IgG subclass antibodies in different clinical manifestations of leprosy. Clin Exp Immunol. 1992;88:253–7. doi: 10.1111/j.1365-2249.1992.tb03069.x. [DOI] [PMC free article] [PubMed] [Google Scholar]
- 27.Da Costa Ctka, Khanolkar-Young S, Elliot AM, Wasunna KMA, McAdam Kpwj. Immunoglobulin G subclass responses to mycobacterial lipoarabinomannan in HIV-infected and non-infected patients with tuberculosis. Clin Exp Immunol. 1993;91:25–29. doi: 10.1111/j.1365-2249.1993.tb03348.x. [DOI] [PMC free article] [PubMed] [Google Scholar]
- 28.Aucouturier P, Lacombe C, Preud'homme JL. Methodological pitfalls in serum IgG2 level measurements by immunoenzymatic assays with monoclonal antibodies. J Clin Lab Anal. 1992;6:12–16. doi: 10.1002/jcla.1860060104. [DOI] [PubMed] [Google Scholar]
- 29.Aucouturier P, Preud'homme JL, Fridman WH, Mathiot C. Recombinant interleukin-2 infusions and serum IgG subclass levels. Blood. 1996;87:841–3. [PubMed] [Google Scholar]
- 30.Aucouturier P, Couderc LJ, Gouet D, et al. Serum immunoglobulin G subclass dysbalances in the lymphadenopathy syndrome and acquired immune deficiency syndrome. Clin Exp Immunol. 1986;63:234–40. [PMC free article] [PubMed] [Google Scholar]
- 31.Preud'homme JL, Hanson LA. IgG subclass deficiency. Immunodefic Rev. 1990;2:129–49. [PubMed] [Google Scholar]


