

Abstract
The activated form of vitamin D, 1,25(OH)2D3, and its analogues can prevent type I diabetes in NOD mice. Protection is achieved without signs of systemic immunosuppression and is associated with a restoration of the defective immune regulator system of the NOD mice. The aim of the present study was to investigate whether this restoration of regulator cell function is the only mechanism in the prevention of diabetes by 1,25(OH)2D3. We tested therefore if 1,25(OH)2D3 could prevent cyclophosphamide-induced diabetes, since diabetes occurring after cyclophosphamide injection is believed to be due to an elimination of suppresser cells. NOD mice treated with 1,25(OH)2D3 (5 μg/kg every 2 days) from the time of weaning were clearly protected against diabetes induced by cyclophosphamide (200 mg/kg body wt at 70 days old) (2/12 (17%) versus 36/53 (68%) in control mice, P < 0.005). By co-transfer experiments it was demonstrated that cyclophosphamide had indeed eliminated the suppresser cells present in 1,25(OH)2D3-treated mice. Since cyclophosphamide injection did not break the protection offered by 1,25(OH)2D3, it was clear that diabetogenic effector cells were affected by 1,25(OH)2D3 treatment as well. This was confirmed by the finding that splenocytes from 1,25(OH)2D3-treated mice were less capable of transferring diabetes in young, irradiated NOD mice, and by the demonstration of lower Th1 cytokine levels in the pancreases of 1,25(OH)2D3-treated, cyclophosphamide-injected mice. This better elimination of effector cells in 1,25(OH)2D3-treated mice could be explained by a restoration of the sensitivity to cyclophosphamide-induced apoptosis in both thymocytes and splenocytes, in normally apoptosis-resistant NOD mice. Altogether, these data indicate that the protection against diabetes offered by 1,25(OH)2D3 may be independent of the presence of suppresser cells, and may involve increased apoptosis of Th1 autoimmune effector cells.
Keywords: NOD, prevention, vitamin D, apoptosis
INTRODUCTION
In previous work we have demonstrated that NOD mice treated with 1,25-dihydroxyvitamin D3 (1,25(OH)2D3) were protected against insulitis and diabetes [1,2]. This protection was achieved without signs of systemic immunosuppression and was associated with a restoration of the defective immune regulator system of the NOD mice. Whether this restoration of regulator cells was the only mechanism in the prevention of diabetes by 1,25(OH)2D3 remained to be proven. To address this question and to acquire more information about the immune effects of 1,25(OH)2D3 in general, we evaluated in the present study the effects of 1,25(OH)2D3 on cyclophosphamide (CY)-induced diabetes in the NOD mouse.
Diabetes occurring after CY administration is believed to be due to a preferential action on rapidly dividing regulator cells that suppress autoimmunity [3–5]. The time needed for recovery of the immune cells after injection of a high dose of CY differs between various T cell populations. Long-lived effector T cells seem to recover more promptly than short-lived suppresser or regulator cells, as reflected by the high levels of Th1 cytokines locally in the pancreas [6–8]. Hence, if an immune therapy protects against diabetes by increasing the action of regulator/suppresser cells, this protection should be broken by CY. Indeed, in models such as those involving bacille Calmette–Guérin (BCG) or Freund's complete adjuvant (FCA) treatment where suppresser cells have definitely been proved to be the key mechanism, protection could be broken by injecting CY, an agent believed to eliminate suppresser cells [9,10]. In contrast, if a therapy has resulted in a decrease of effector cells, protection against diabetes should not be altered by the injection of CY [11].
The first aim of the present study was to examine the effect of CY on the 1,25(OH)2D3-induced protection against diabetes in NOD mice. If CY was not able to interrupt this protection, this would suggest that the suppresser cells induced by 1,25(OH)2D3 were not the only protection mechanism and that 1,25(OH)2D3 also had an effect on autoimmune effector cells.
Recently, it has been demonstrated that autoimmune diseases are often characterized by a resistance to apoptosis [12]. The autoimmunity-prone lpr and gld mouse strains display defective apoptosis due to mutations in Fas (CD95) and Fas ligand, respectively [13,14]. Transgenic mice expressing bcl-2, an apoptosis-inhibiting gene, have impaired apoptosis which leads to the development of an autoimmune phenomenon depending on their genetic background [15–19]. Also, NOD lymphocytes appear to be resistant to apoptotic signals, such as CY and dexamethasone [20–23], and it might be hypothesized that this mechanism is involved in the accumulation of autoimmune effector cells in NOD mice. Since it is known that 1,25(OH)2D3 can induce apoptosis in phytohaemagglutinin (PHA)-stimulated lymphocytes, HL60 leukaemic cells and MCF 7 breast cancer cells [24–26], the protection against diabetes in NOD mice by 1,25(OH)2D3 might also involve a better elimination of autoimmune effector cells by increasing their sensitivity to apoptosis. To test this hypothesis, the effect of 1,25(OH)2D3 on the susceptibility of NOD lymphocytes to develop apoptosis after CY was investigated in vivo.
MATERIALS AND METHODS
Animals
NOD mice, originally obtained from Professor C. Y. Wu (Beijing, China), were bred in our animalium (Proefdierencentrum Leuven, Belgium) and kept under conventional conditions. Animals were fed a low-calcium, vitamin D-replete diet (0.2% calcium, 1% phosphate, 2000 U vitamin D/kg; Hope Farms, Woerden, The Netherlands). Spontaneous diabetes incidence in stock mice at the age of 200 days at the moment of the study was 82% in female and 26% in male mice. After the age of 200 days, the further increase of diabetes incidence in the colony was < 0.2%. In this study only male NOD mice were used. C57Bl/6 mice were purchased from Charles River (Wiga, Sulzfeld, Germany).
Treatment regimen
For evaluation of diabetes incidence after CY the animals were randomly assigned to two different treatment groups: in both groups the treatment with 1,25(OH)2D3 was started on day 21, the time of weaning, but in group 1 therapy was stopped on day 50 and in group 2 on day 69. These two groups were included as we wanted to investigate whether short-term treatment with 1,25(OH)2D3 resulted in a long-lasting protection and if the protective effect would still persist 3 weeks after interruption of treatment. All mice received a single CY injection of 200 mg/kg body wt at 70 days old. For each group an appropriate control group, receiving arachis oil instead of 1,25(OH)2D3 for the same period, was included. As there were no significant differences between the results of these various control groups (diabetes incidence in control groups 1 and 2, 73% (16/22) and 65% (20/31) (NS)), they were pooled and considered as one group for statistical analysis (diabetes incidence 68%, 36/53).
In the apoptosis and cytokine experiments all mice were injected with CY (200 mg/kg body wt) at 70 days old. There were three groups of mice used: C57Bl/6 controls, control NOD mice treated with arachis oil and NOD mice treated with 1,25(OH)2D3 from day 21 until day 69.
For transfer experiments, some NOD mice were treated for a longer period (from day 21 until day 200) with arachis oil or 1,25(OH)2D3.
1,25(OH)2D3 was kindly provided by J.P. Van de Velde (Solvay, Weesp, The Netherlands) and CY (Endoxan) was purchased from ASTA MEDICA (Brussels, Belgium). 1,25(OH)2D3 was administered intraperitoneally every 2 days at a dose of 5 μg/kg. Arachis oil was used as the treatment vehicle.
Evaluation of disease and insulitis
Diabetes and insulitis were evaluated as described previously [2]. Briefly, mice were weighed weekly and glucosuria was tested 3 times a week starting from 1 week before CY administration using Clinistix (Bayer Diagnostics, Basingstoke, UK). Glycaemia was determined with a Glucocard (Menarini, Firenze, Italy). Diabetes was diagnosed in mice with positive glucosuria and glycaemia above 250 mg/dl on 2 consecutive days. At the time of diagnosis of diabetes or in case of normoglycaemia, 30 days after CY injection, mice were killed by ether inhalation and cervical dislocation. Pancreases were removed and fixed in Bouin's solution. Haematoxylin and eosin-stained serial sections were evaluated for insulitis by two independent investigators as described previously [2]. Any degree of lymphocytic infiltration of the islets was scored as positive.
Transfer and co-transfer experiments
Co-transfer experiments were performed to detect possible suppresser cells. Naive 6–8-week-old male NOD mice were sublethally (7.5 Gy) irradiated and received, 48 h later, 20 × 106 splenocytes intravenously obtained from overtly diabetic NOD mice [2]. In co-transfer experiments, 20 × 106 splenocytes from test mice were injected intravenously, 24 h before the transfer of the diabetogenic cells. Test mice were either control NOD mice (1 week after CY administration) or 1,25(OH)2D3-treated (day 21 until day 69) mice, from which splenocytes were obtained just before or 1 week after CY administration.
In order to explore the recovery of effector cells after CY and the effect of 1,25(OH)2D3 on effector cells, transfer experiments were performed. Naive 6–8-week-old male NOD mice were sublethally (7.5 Gy) irradiated and 48 h later received 20 × 106 splenocytes intravenously. In a first experiment, these splenocytes were obtained from control or 1,25(OH)2D3-treated (day 21 until day 69) NOD mice, that had received CY 2 weeks earlier, while in a second experiment the splenocytes were taken from 200-day-old control or 1,25(OH)2D3-treated NOD mice. Mice were tested for glucosuria twice weekly and were considered diabetic following the criteria described above.
Cytokine analysis by quantitative reverse transcriptase-polymerase chain reaction
Total RNA was extracted from fresh pancreatic tissue (free of lymph nodes) taken from control and 1,25(OH)2D3-treated NOD mice, either before, 2 or 9 days after CY, by the acid guanidinium thiocyanate-phenol-chloroform method [27]. Pancreases rather than isolated islets were examined to minimize artefacts by ex vivo manipulation on cytokine profiles.
A constant amount of 4 μg of target RNA was reverse transcribed with Superscript II RT (Gibco BRL Life Technologies, Merelbeke, Belgium) at 42°C for 80 min in the presence of random primers.
For IL-2, IL-4, IL-10, IL-12, interferon-gamma (IFN-γ), transforming growth factor-beta (TGF-β) and β-actin, real time quantitative polymerase chain reaction (PCR) was performed [28,29]. PCR reactions were performed in the ABI Prism 7700 Sequence Detector, which contains a Gene-Amp PCR System 9600 (Perkin Elmer, Nieuwerkerke a/d Ijssel, The Netherlands). Reaction conditions were programmed on a Power Macintosh 7200, linked directly to the 7700 Sequence Detector. The assay uses the 5′ nuclease activity of Taq polymerase to cleave a non-extendible hybridization probe during the extension phase of PCR. The approach uses dual-labelled fluorogenic hybridization probes. One fluorescent dye serves as a reporter (FAM or TET) and its emission spectra are quenched by the second fluorescent dye, TAMRA. The nuclease degradation of the hybridization probe releases the quenching of the FAM fluorescent emission, resulting in an increase in peak fluorescent emission at 518 nm. The use of a sequence detector (ABI Prism) allows measurement of fluorescent spectra of all 96 wells of the thermal cycler continuously during PCR amplification. Therefore, the reactions are monitored in real time. The Model 7700 software constructs amplification plots from the extension phase fluorescent emission data collected during the PCR amplification. CT (threshold) values are calculated by determining the point at which the fluorescence exceeds a threshold limit (usually 10 times the standard deviation of the base line). Primers were chosen with the assistance of the computer program Primer Express (Perkin Elmer) and were always located in two different exons (Table 1). Amplification reactions (25 μl) contained 1 μl cDNA sample, 2.5 μl 10 × TaqMan buffer A, 200 μm dATP, dCTP, dGTP and 400 μm dUTP, 7 mm MgCl2, 0.625 U AmpliTaq Gold, 0.25 U AmpErase uracil N-glycosylase (UNG) and 150 nm of each primer. The reactions also contained the corresponding detection probe (100 nm) (Table 1). For the generation of standard curves, plasmid clones containing a partial cDNA sequence of IL-2, IL-4, IL-10, IL-12, IFN-γ, TGF-β or β-actin were constructed. Briefly, total RNA was extracted from spleens and cytokine cDNA fragments were generated by reverse transcriptase (RT)-PCR, using the same PCR primers as described above. The amplicons were cloned into pGEM-TEasy (Promega, Leiden, The Netherlands). The length of the amplicons was confirmed by restriction analysis. Serial dilutions from the resulting plasmid clones were used as standard curves, each containing a known amount of template copy number [30]. The CT values of each cytokine were plotted on these standard curves to obtain the amount of copies present in the initial cDNA sample. Each PCR amplification was performed in quadruplicate, using the following conditions: 2 min at 50°C and 10 min at 95°C, followed by a total of 40 two-temperature cycles (15 s at 95°C and 1 min at 60°C). A normalization to β-actin (housekeeping gene) was performed for each sample. Gel electrophoresis was performed to confirm the correct size of the amplicons.
Table 1.
Primer and probe sequences of β-actin and the different cytokines used

Detection of apoptosis
Apoptosis induction in thymocytes and splenocytes by CY was tested 16 h after i.p. injection of CY (200 mg/kg) following the protocol of a kinetic study by Colluci et al. that demonstrated that the most significant difference in apoptosis sensitivity between NOD and C57Bl/6 mice was seen at that time point [23]. Apoptosis was determined by the TUNEL (terminal deoxynucleotidyl transferase (TDT)-mediated FITC-dUTP nick end labelling) reaction. Briefly, spleens and thymi were isolated from C57Bl/6, control NOD and 1,25(OH)2D3-treated NOD mice, before and 16 h after CY administration. The organs were gently teased apart and pressed through a steel mesh. Cell numbers were counted and afterwards fixed for 30 min at room temperature in 2% paraformaldehyde in PBS, permeabilized with 0.1% saponin in PBS for 2 min and incubated for 1 h at 37°C with TdT and FITC-conjugated dUTP (Boehringer, Brussels, Belgium). Cells were then washed and analysed with a FACSort (Becton Dickinson, Erembodegem, Belgium). Apoptosis is expressed as percentage TUNEL-positive cells. In addition, differences in cell numbers before and after CY administration are expressed as percentage remaining living cells (after CY/before CY).
Statistical analysis
The following statistical tests were used: for diabetes incidence and transfer/co-transfer data the χ2 test, for the cytokine analysis the TUNEL test, and for cell numbers in spleen and thymus the anova test and the unpaired Student's t-test. Significance was defined at the 0.05 level.
RESULTS
Effect of 1,25(OH)2D3 on CY-induced diabetes and insulitis
Administration of 1,25(OH)2D3 (5 μg/kg intraperitoneally every 2 days), starting from the time of weaning, significantly (P < 0.005) reduced the incidence of diabetes after CY injection at the age of 70 days (Fig. 1). While 68% (36/53) of control mice subsequently developed diabetes, only 19% (3/16, P < 0.005) of mice treated with 1,25(OH)2D3 from day 21 until day 50 (group 1) and 17% (2/12, P < 0.005) of those treated from day 21 until day 69 developed diabetes. Prolonging treatment to 30 days after CY did not further increase the degree of protection (data not shown).
Fig. 1.
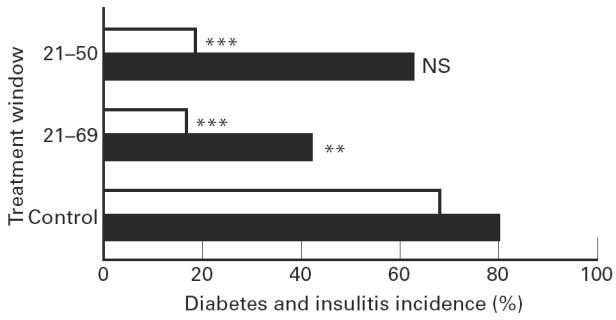
Incidence of cyclophosphamide-induced diabetes and insulitis. A significant protection against diabetes was present in all groups receiving 1,25(OH)2D3 from the time of weaning (□). While 36 of 53 control mice developed diabetes, only three of 16 mice treated with 1,25(OH)2D3 from day 21 until day 50 (group 1) and two of 12 mice treated from day 21 until day 69 (group 2) developed diabetes. The incidence of insulitis was investigated as well (▪): five of 12 mice in group 2 developed insulitis in contrast to the control group, where 42 of the 53 animals had insulitis (P < 0.01). In group 1, 10 of 16 animals developed insulitis (NS compared with controls). ***P < 0.005; **P < 0.01.
The effect of 1,25(OH)2D3 on the incidence of insulitis after CY injection was investigated as well. Interestingly, here the duration of treatment was important: only 42% (5/12) of mice in group 2, receiving 1,25(OH)2D3 from day 21 until day 69, developed insulitis in contrast to the control group, where 79% (42/53) of the animals presented with insulitis (P < 0.01). In group 1, where 1,25(OH)2D3 was stopped 20 days before CY administration, no significant protection against the occurrence of insulitis was found, since a similarly high percentage (63%, 10/16) of animals developed insulitis (NS compared with controls).
Transfer and co-transfer experiments
In co-transfer experiments splenocytes were used from untreated and 1,25(OH)2D3-treated animals, taken 1 week after CY administration, and also from age-matched 1,25(OH)2D3-treated mice that did not receive CY. As previously described, splenocytes from 1,25(OH)2D3-treated mice that did not receive CY significantly (P < 0.05) suppressed transfer of diabetes by splenocytes from recently diabetic NOD mice, compared with mice receiving only the diabetogenic splenocytes (Fig. 2) [2]. No suppression of diabetes transfer was observed if splenocytes were taken from age-matched control animals or from 1,25(OH)2D3-treated mice that had received CY 1 week earlier. These co-transfer experiments thus confirm that 1,25(OH)2D3 induced suppresser cells in NOD mice and that CY was able to eliminate these cells.
Fig. 2.
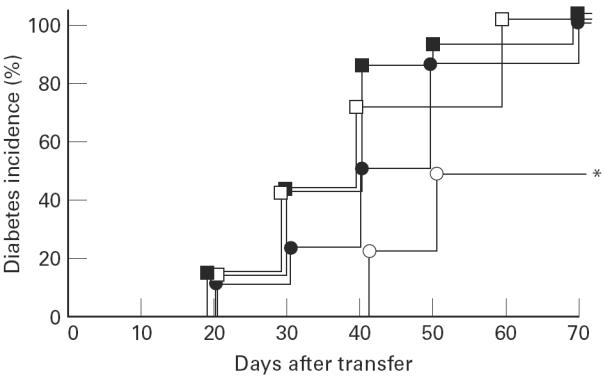
Incidence of diabetes after cell transfer. Mice (6–8 weeks, irradiated with 7.50 Gy) receiving only splenocytes from overtly diabetic NOD mice developed diabetes (100%, 6/6, □). A clear protective effect was seen when a co-transfer was performed with 20 × 106 splenocytes from 1,25(OH)2D3-treated (day 21 until day 69) mice (○, 4/8, P < 0.05, *). No protective effect was seen when a co-transfer was performed with 20 × 106 splenocytes from control or 1,25(OH)2D3-treated mice that received cyclophosphamide (▪ (8/8) and • (11/11), respectively).
These results, together with the previous data showing protection by 1,25(OH)2D3 despite CY injection, suggest that 1,25(OH)2D3 was also active on effector cells.
To explore this, splenocytes from CY-injected mice were transferred into irradiated recipients. Transfer of splenocytes from control or 1,25(OH)2D3-treated NOD mice, injected with CY 14 days earlier, transferred diabetes in 50% (5/10) and 29% (2/7) of the cases, respectively. This suggests that 1,25(OH)2D3 treatment also resulted in an important decrease of effector cells, able to transfer diabetes. This elimination of effector cells was even clearer when treatment with 1,25(OH)2D3 was prolonged until 200 days old: splenocytes from control mice transferred diabetes in 92% (11/12) while splenocytes from 1,25(OH)2D3-treated mice transferred diabetes in only 7% (1/16, P < 0.0001).
Cytokine mRNA detection
Before CY, no differences in pancreatic mRNA levels of IL-2, IL-4, IL-10, IL-12, IFN-γ or TGF-β were seen between control and 1,25(OH)2D3-treated NOD mice (Fig. 3). After CY we not only observed an increase in Th1-like mRNA levels, as described by Rothe et al., but also an increase in other cytokines, as seen by Faulkner-Jones et al. [7,8,31]. 1,25 (OH)2D3 treatment was able to significantly suppress this Th1-like cytokine mRNA production after CY. Indeed, 2 and 9 days after CY injection, the expression of IL-12 and IFN-γ was lower in mice treated with 1,25(OH)2D3 compared with control mice. This difference was not significant yet at 2 days, but became significant after 9 days (P < 0.05 for both IL-12 and IFN-γ). No significant differences were noticed for IL-10 and TGF-β after CY, and the mRNA levels of IL-2 and IL-4 were very low in both groups (data not shown).
Fig. 3.
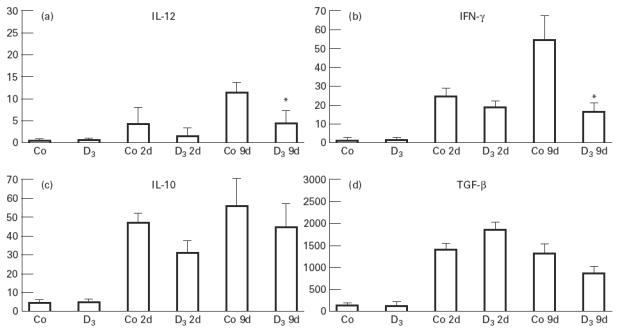
Pancreatic mRNA levels of IL-10, IL-12, IFN-γ and transforming growth factor-beta (TGF-β) before and 2 and 9 days after cyclophosphamide (CY) treatment both in control (Co, Co2d, Co9d) and 1,25(OH)2D3-treated mice (D3, D32d, D39d). Cytokine mRNA levels of IL-12 and IFN-γ were lower in mice treated with 1,25(OH)2D3 compared with control mice (Fig. 3a,b). This difference became significant 9 days after CY. No significant differences were seen for IL-10 and TGF-β (Fig. 3c,d). Cytokine mRNA levels are expressed relative to the β-actin polymerase chain reaction (PCR) product amplified from the same sample ((cytokine copies/β-actin copies) × 10 000). Mean ± s.e.m. values are shown for each group. *P < 0.05.
Effect of 1,25(OH)2D3 on the induction of apoptosis in splenocytes and thymocytes after CY injection
Confirming previous observations, a clear resistance against CY-induced apoptosis was seen in splenocytes of control NOD mice compared with C57Bl/6 mice [23]. This appeared first, using the crude method of cell number counting. In the spleen 55% of the cells survived CY injection in NOD mice versus 26% in C57Bl/6 mice (P < 0.05, Fig. 4a). Since in cell number counting no strict difference can be made between necrosis and apoptosis, we proceeded to use the more specific TUNEL method (Fig. 4b): apoptosis was detected in 17% in NOD mice compared with 35% in C57Bl/6 mice (P < 0.00001). Interestingly, treatment with 1,25(OH)2D3 from day 21 until 1 day before CY administration (day 70) increased the sensitivity to CY-induced apoptosis. This appeared from a trend to a lower percentage of splenocytes surviving the CY injection (46% remaining cells in 1,25(OH)2D3-treated mice versus 55% in control NOD mice, NS, Fig. 4a), but especially from a significant difference as demonstrated by the more reliable TUNEL technique (25% apoptosis in 1,25(OH)2D3-treated mice versus 17% in control NOD mice, P < 0.001, Fig. 4b).
Fig. 4.
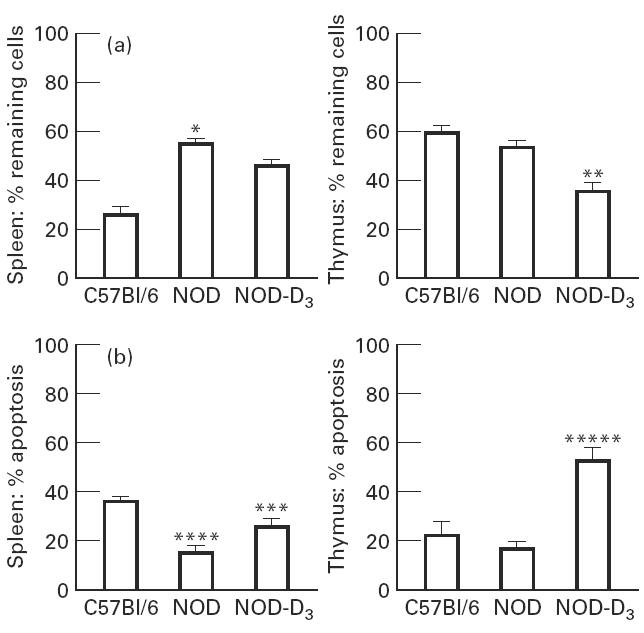
A mean of 20 mice were analysed for cell number in spleen and thymus. Cyclophosphamide (CY) was injected intraperitoneally 16 h before analysis. The percentage of remaining cells compared with the untreated controls is indicated (a). Splenocytes and thymocytes were harvested 16 h after CY injection and stained with the terminal deoxynucleotidyl transferase (TDT)-mediated FITC-dUTP nick end labelling (TUNEL) reaction. Apoptosis is expressed as percentage TUNEL-positive cells (b). *P < 0.05 versus C57Bl/6; **P < 0.05 versus NOD; ***P < 0.001 versus NOD; ****P < 0.0001 versus C57Bl/6; *****P < 0.00001 versus NOD.
Similar results were found in the thymus. As already described, apoptosis induction by CY in the thymus was limited both in C57Bl/6 and NOD mice, as demonstrated by both techniques (Fig. 4a,b) [23]. Nevertheless, in the thymus also, 1,25(OH)2D3 treatment clearly increased the percentage of apoptotic cells, as confirmed by cell counting (36% remaining cells in 1,25(OH)2D3-treated mice versus 54% in control NOD mice, P < 0.05, Fig. 4a) and the TUNEL technique (52% in 1,25(OH)2D3-treated mice versus 16% in control NOD mice, P < 0.00001, Fig. 4b). Figure 5 shows representative histograms of these data.
Fig. 5.
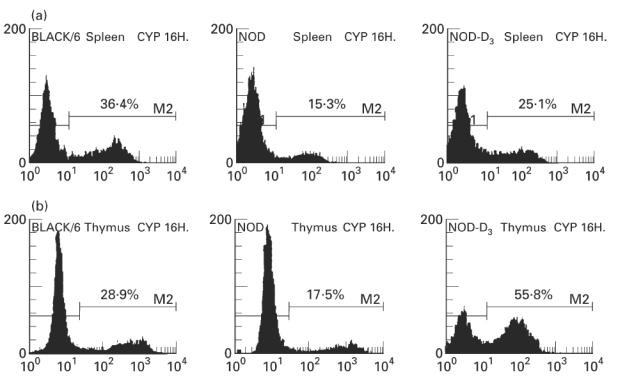
Flow cytometry of representative cyclophosphamide (CY)-treated mice. The upper histograms show apoptosis levels in splenocytes (a) from C57Bl/6 mice (left), NOD control (centre) and NOD mice treated with 1,25(OH)2D3 (right). The lower histograms show apoptosis levels in thymocytes (b) from C57Bl/6 mice (left), NOD control (centre) and NOD mice treated with 1,25(OH)2D3 (right). Apoptotic cells are detected in the FL1 channel (FITC-dUTP). The histograms shown are representative of separate experiments (n ≥ 8).
DISCUSSION
Both the active form of vitamin D, 1,25(OH)2D3, as well as its non-calcaemic structural analogues are effective in preventing spontaneous insulin-dependent diabetes mellitus (IDDM) in the NOD mouse model [1,2,32]. Previously, we explored the immune system of NOD mice treated with 1,25(OH)2D3 or analogues. The major difference between treated and control animals was a restored regulator cell system in mice treated with 1,25(OH)2D3 or its analogues [2,32]. It remained, however, unclear whether the induction of these suppresser cells was the only mechanism responsible for the 1,25(OH)2D3-induced protection. Therapeutic interventions that are believed to act via the induction of suppressor T cells, but that have no effect on autoimmune effector cells, such as FCA or BCG, were indeed very sensitive to CY [9,10]. On the other hand, CY could not break the protection against diabetes in animals treated with the streptococcal preparation, OK-432, a substance believed to prevent diabetes by inhibiting the generation of effector cells responsible for β cell destruction [11].
We clearly demonstrate in the present study that CY indeed eliminated the suppressor cells present in 1,25(OH)2D3-treated mice. Despite this elimination of suppressor cells, CY could not break the protection against insulitis or diabetes achieved by 1,25(OH)2D3. Hence, suppressor cells induced by 1,25(OH)2D3 do not seem to be essential for protection. We therefore hypothesize that also potential autoimmune effector cells were influenced by 1,25(OH)2D3 treatment.
The persistence of autoimmune effector cells after CY injection in NOD mice might be partly due to a resistance of NOD lymphocytes to apoptosis. It has already been shown that NOD lymphocytes are highly resistant to various apoptotic signals, such as CY and dexamethasone [20–23]. A resistance and/or earlier recovery of effectors after CY in the NOD model probably explains the diabetogenic potential of CY. 1,25(OH)2D3 treatment clearly increased the sensitivity of NOD lymphocytes to CY-induced apoptosis, both peripherally in the spleen and centrally in the thymus. Moreover, transfer experiments demonstrated that the effector cells were indeed eliminated by 1,25(OH)2D3 treatment. This elimination of effector cells was especially clear when treatment with 1,25(OH)2D3 was prolonged until 200 days old: splenocytes from control mice transferred diabetes in 92% (11/12) while splenocytes from 1,25(OH)2D3-treated mice transferred diabetes in only 7% (1/16, P < 0.0001).
Cytokine levels in the pancreases of control and 1,25(OH)2D3-treated NOD mice after CY also revealed that local effector cells were significantly suppressed in 1,25(OH)2D3-treated NOD mice, as demonstrated by the lower mRNA levels for IL-12 and IFN-γ, in contrast to the higher levels in control NOD mice. High levels of these Th1-like cytokines after CY have also been demonstrated in control NOD mice in two independent studies [7,8,31]. Data on Th2 cytokines after CY are less concordant: Rothe et al. found that IL-4 mRNA levels remained relatively constant after CY [7], while Faulkner-Jones et al. described a rise in IL-4 mRNA levels [31]. In the present study we saw a diminished increase in Th1-like mRNA levels in 1,25(OH)2D3-treated NOD mice compared with controls after CY, but no significant differences in Th2-like cytokines after CY. Therefore, we can summarize that 1,25(OH)2D3 treatment decreased effector cells but did not induce a Th1-to-Th2 shift.
In conclusion, 1,25(OH)2D3 treatment prevents not only spontaneous diabetes, but also CY-induced diabetes in NOD mice. 1,25(OH)2D3 has multiple effects that can explain this protection against diabetes. First, there is the effect on the β cell: 1,25(OH)2D3 influences β cell calcium metabolism and eventually insulin secretion [33–35], and it has been described that 1,25(OH)2D3 protects against IL-1β-induced β cell dysfunction [36]. Second, 1,25(OH)2D3 has clear effects on the immune system. We have previously shown that suppressor cells are induced by 1,25(OH)2D3, and from the present study it is clear that 1,25(OH)2D3 treatment also decreases effector cells. This may be related to the apoptosis-enhancing effect of 1,25(OH)2D3 on NOD lymphocytes, leading to a better elimination of autoimmune effector cells.
Acknowledgments
This work was supported by the Flemish Research Foundation (FWO grants 3.0046.94 and Levenslijn 7.0006.96), a Flemish Foundation for Scientific Research Fellowship for K.C. and a postdoctoral FWO fellowship for C.M.
References
- 1.Mathieu C, Laureys J, Sobis H, Vandeputte M, Waer M, Bouillon R. 1,25-Dihydroxyvitamin D3 prevents insulitis in NOD mice. Diabetes. 1992;41:1491–5. doi: 10.2337/diab.41.11.1491. [DOI] [PubMed] [Google Scholar]
- 2.Mathieu C, Waer M, Laureys J, Rutgeerts O, Bouillon R. Prevention of type I diabetes in NOD mice by 1,25-dihydroxyvitamin D3. Diabetologia. 1994;37:552–8. doi: 10.1007/BF00403372. [DOI] [PubMed] [Google Scholar]
- 3.Harada M, Makino S. Promotion of spontaneous diabetes in non-obese diabetes-prone mice by cyclophosphamide. Diabetologia. 1984;27:604–6. doi: 10.1007/BF00276978. [DOI] [PubMed] [Google Scholar]
- 4.Yasunami R, Bach JF. Anti-suppressor effect of cyclophosphamide on the development of spontaneous diabetes in NOD mice. Eur J Immunol. 1988;18:481–4. doi: 10.1002/eji.1830180325. [DOI] [PubMed] [Google Scholar]
- 5.Mitsuoka A, Baba M, Morikawa S. Enhancement of delayed hypersensitivity by depletion of suppressor T cells with cyclophosphamide in mice. Nature. 1976;262:77–78. doi: 10.1038/262077a0. [DOI] [PubMed] [Google Scholar]
- 6.Charlton B, Bacelj A, Slattery R, Mandel T. Cyclophosphamide-induced diabetes in NOD/WEHI mice: evidence for suppression in spontaneous autoimmune diabetes mellitus. Diabetes. 1989;38:441–7. doi: 10.2337/diab.38.4.441. [DOI] [PubMed] [Google Scholar]
- 7.Rothe H, Faust A, Schade U, Kleemann R, Bosse G, Hibino T, Martin S, Kolb H. Cyclophosphamide treatment of female NOD mice causes enhanced expression of inducible nitric oxide synthase and interferon-gamma, but not of interleukin-4. Diabetologia. 1994;37:1154–8. doi: 10.1007/BF00418380. [DOI] [PubMed] [Google Scholar]
- 8.Rothe H, Burkart V, Faust A, Kolb H. Interleukin-12 gene expression is associated with rapid development of diabetes mellitus in non-obese diabetic mice. Diabetologia. 1996;39:119–22. doi: 10.1007/BF00400422. [DOI] [PubMed] [Google Scholar]
- 9.Qin HY, Sadelain M, Hitchon C, Lauzon J, Singh B. Complete Freund's adjuvant-induced T cells prevent the development and adoptive transfer of diabetes in nonobese diabetic mice. J Immunol. 1993;150:2072–80. [PubMed] [Google Scholar]
- 10.Lakey J, Singh B, Warnock G, Elliott J, Rajotte R. Long-term survival of syngeneic islet grafts in BCG-treated diabetic NOD mice can be reversed by cyclophosphamide. Transplantation. 1995;59:1751–3. doi: 10.1097/00007890-199506270-00023. [DOI] [PubMed] [Google Scholar]
- 11.Shintani S, Satoh J, Seino H, Goto Y, Toyota T. Mechanism of action of a streptococcal preparation (OK-432) in prevention of autoimmune diabetes in NOD mice. J Immunol. 1990;144:136–41. [PubMed] [Google Scholar]
- 12.Mountz J, Wu J, Cheng J, Zhou T. Autoimmune disease: a problem of defective apoptosis. Arthritis Rheum. 1994;37:1415–20. doi: 10.1002/art.1780371002. [DOI] [PubMed] [Google Scholar]
- 13.Watanabe-Fukunaga R, Brannan C, Copeland N, Jenkins N, Nagata S. Lymphoproliferation disorder in mice explained by defects in Fas antigen that mediates apoptosis. Nature. 1992;356:314–7. doi: 10.1038/356314a0. [DOI] [PubMed] [Google Scholar]
- 14.Takahashi T, Tamaka M, Brannan C, Jenkins N, Copeland N, Suda T, Nagata S. Generalised lymphoproliferative disease in mice, caused by a point mutation in the fas ligand. Cell. 1994;76:969–76. doi: 10.1016/0092-8674(94)90375-1. [DOI] [PubMed] [Google Scholar]
- 15.McDonnel T, Deane N, Platt F, Nunez G, Jaeger U, McKearn J, Korsmeyer S. Bcl-2-immunoglobulin transgenic mice demonstrate extended B cell survival and follicular lymphoproliferation. Cell. 1989;57:79–88. doi: 10.1016/0092-8674(89)90174-8. [DOI] [PubMed] [Google Scholar]
- 16.Strasser A, Whittingham S, Vaux D, Bath M, Adams J, Cory S, Harris H. Enforced bcl-2 expression in B-lymphoid cells prolongs antibody responses and elicits autoimmune disease. Proc Natl Acad Sci USA. 1991;88:8861–5. doi: 10.1073/pnas.88.19.8661. [DOI] [PMC free article] [PubMed] [Google Scholar]
- 17.Strasser A, Harris A, Cory S. Bcl-2 transgene inhibits T cell death and perturbs thymic self-censorship. Cell. 1991;67:889–99. doi: 10.1016/0092-8674(91)90362-3. [DOI] [PubMed] [Google Scholar]
- 18.Sentman C, Shutter J, Hockenbery D, Kanagawa O, Korsmeyer S. Bcl-2 inhibits multiple forms of apoptosis but not negative selection in thymocytes. Cell. 1991;67:879–88. doi: 10.1016/0092-8674(91)90361-2. [DOI] [PubMed] [Google Scholar]
- 19.Cohen J, Duke R, Fadok V, Sellins K. Apoptosis and programmed cell death in immunity. Immunol Rev. 1992;10:267–93. doi: 10.1146/annurev.iy.10.040192.001411. [DOI] [PubMed] [Google Scholar]
- 20.Garchon H, Luan J, Eloy L, Bédossa P, Bach J. Genetic analysis of immune dysfunction in NOD mice: mapping of a susceptibility locus close to the Bcl-2 gene correlates with increased resistance of NOD T cells to apoptosis induction. Eur J Immunol. 1994;24:380–4. doi: 10.1002/eji.1830240217. [DOI] [PubMed] [Google Scholar]
- 21.Leijon K, Hammarström B, Holmberg D. NOD mice display enhanced immune responses and prolonged survival of lymphoid cells. Int Immunol. 1994;6:339–45. doi: 10.1093/intimm/6.2.339. [DOI] [PubMed] [Google Scholar]
- 22.Penha-Goncalves C, Leijon K, Persson L, Holmberg D. Type I diabetes and the control of dexamethasone-induced apoptosis in mice maps to the same region on chromosome 6. Genomics. 1995;28:398–404. doi: 10.1006/geno.1995.1167. [DOI] [PubMed] [Google Scholar]
- 23.Colucci F, Cilio C, Leijon K, Penha-Goncalves C, Bergman M, Holmberg D. Programmed cell death in the pathogenesis of murine IDDM: resistance to apoptosis induced in lymphocytes by cyclophosphamide. J Autoimmun. 1996;9:271–6. doi: 10.1006/jaut.1996.0034. [DOI] [PubMed] [Google Scholar]
- 24.Pintado C, Carracedo J, Rodriguez M, Perez-Calderon R, Ramirez R. 1α,25-dihydroxyvitamin D3 induces apoptosis in stimulated T cells through an IL-2-dependent mechanism. Cytokine. 1996;8:342–5. doi: 10.1006/cyto.1996.0047. [DOI] [PubMed] [Google Scholar]
- 25.Elstner E, Linker-Israeli M, Umiel T, et al. Combination of a potent 20-epi-Vitamin D3 analogue with 9-cis-retinoic acid irreversibly inhibits clonal growth, decreases bcl-2 expression, and induces apoptosis in HL-60 leukemic cells. Cancer Res. 1996;56:3570–6. [PubMed] [Google Scholar]
- 26.Welsh J. Induction of apoptosis in breast cancer cells in response to vitamin D and antiestrogens. Biochem Cell Biol. 1994;72:537–45. doi: 10.1139/o94-072. [DOI] [PubMed] [Google Scholar]
- 27.Chomczynski P, Sacchi N. Single step method of RNA isolation by acid guanidinium thiocyanate-phenol-chloroform extraction. Anal Biochem. 1987;162:156–9. doi: 10.1006/abio.1987.9999. [DOI] [PubMed] [Google Scholar]
- 28.Heid C, Stevens J, Livak K, Williams P. Real time quantitative PCR. Genome Res. 1996;6:986–94. doi: 10.1101/gr.6.10.986. [DOI] [PubMed] [Google Scholar]
- 29.Gibson U, Heid C, Williams P. A novel method for real time quantitative RT-PCR. Genome Res. 1996;6:995–1001. doi: 10.1101/gr.6.10.995. [DOI] [PubMed] [Google Scholar]
- 30.Fox C, Danska J. IL4 expression at the onset of islet inflammation predicts nondestructive insulitis in nonobese diabetic mice. J Immunol. 1997;158:2414–24. [PubMed] [Google Scholar]
- 31.Faulkner-Jones B, Dempsey-Collier M, Mandel T, Harrison L. Both Th1 and Th2 cytokine mRNAs are expressed in the NOD mouse pancreas in vivo. Autoimmunity. 1996;23:99–110. doi: 10.3109/08916939608995333. [DOI] [PubMed] [Google Scholar]
- 32.Mathieu C, Waer M, Casteels K, Laureys J, Bouillon R. Prevention of type 1 diabetes in NOD mice by non-hypercalcemic doses of a new structural analogue of 1,25 (OH)2D3, KH1060. Endocrinol. 1995;136:866–72. doi: 10.1210/endo.136.3.7867594. [DOI] [PubMed] [Google Scholar]
- 33.Clark S, Stumpf W, Sar M. Effects of 1,25 dihydroxyvitamin D3 on insulin secretion. Diabetes. 1981;30:382–6. doi: 10.2337/diab.30.5.382. [DOI] [PubMed] [Google Scholar]
- 34.Billaudel B, Faure A, Sutter B. Effects of 1,25 dihydroxyvitamin D3 on isolated islets from vitamin D3-deprived rats. Am J Physiol. 1990;258:E643–8. doi: 10.1152/ajpendo.1990.258.4.E643. [DOI] [PubMed] [Google Scholar]
- 35.Bourlon M, Faure-Dussert A, Billaudel B, Sutter B, Tramu G, Thomasset M. Relationship between calbindin-D28K levels in the A and B cells of the rat endocrine pancreas and the secretion of insulin and glucagon: influence of vitamin D3 deficiency and 1,25-dihydroxyvitamin D3. J Endocrinol. 1996;148:223–32. doi: 10.1677/joe.0.1480223. [DOI] [PubMed] [Google Scholar]
- 36.Sandler S, Buschard K, Bendtzen K. Effects of 1,25-dihydroxyvitamin D3 and the analogues MC903 and KH1060 on interleukin-1β-induced inhibition of rat pancreatic islet β-cell function in vitro. Immunol Letters. 1994;41:73–77. doi: 10.1016/0165-2478(94)90059-0. [DOI] [PubMed] [Google Scholar]