

Abstract
T cells are thought to play an important regulatory role in asthma, but little is known about the T cell repertoire of the human lung or whether asthma is associated with any specific repertoire changes. Flow cytometry and MoAbs to TCR VB (TCRBV) families were used to quantify bronchoalveolar lavage (BAL) and blood T cells from normal and atopic individuals. Clonality was then assessed by polymerase chain reaction (PCR) amplification of cDNA and gene scanning using consensus and family-specific TCRBV primers and confirmed by sequence analysis. In addition, blood and BAL T cell populations were studied pre- and post-allergen challenge in four patients with allergic asthma. The majority of TCRBV families detected in blood by MoAb staining were also represented in BAL. While differences between BAL and blood populations were evident in each individual studied, these differences were not consistent between individuals or between CD4+ and CD8+ T cell subpopulations. These results are in broad agreement with other published studies, but in contrast to previous work we found a consistent difference between TCRBV7 family usage in blood and BAL in all individuals studied, and a consistently increased proportion of CD4+ BAL T cells bearing BV5S2/3 in asthmatics only. After allergen challenge, the pattern of TCRBV gene usage was largely unchanged as judged by flow cytometry. Gene scanning of PCR products generated from consensus VB primers revealed polyclonal lymphocyte populations in blood and BAL from all seven atopic individuals: in one normal tested polyclonal populations were found in blood and oligoclonal populations in BAL. Selected families amplified with family-specific primers BV5S2/3, BV6 and BV7 (chosen because of their predominance in BAL compared with blood) were more variable and revealed predominant polyclonal populations in blood and polyclonal or oligoclonal populations in BAL. In one asthmatic patient a clonal BV5S2 family was found in BAL. Following allergen challenge there were no significant changes in polyclonality/oligoclonality/clonality in three cases, but in one case a clonal BV5S2 population was found after challenge, that had not been evident beforehand. The lung T cell repertoire is thus broadly representative of blood T cells, but shows population differences that may result from response to persistent exposure to airborne antigens common to normal and atopic individuals. Oligoclonal TCRBV family expansion appears to be primarily lung-specific but independent of atopic asthma, although our challenge data in one case support the concept that clonal populations may follow local allergen challenge. These data are consistent with selection and amplification of specific T cell families in the lung in response to local antigenic exposure.
Keywords: T cell receptor, genetics, T lymphocyte, bronchoalveolar lavage, asthma
INTRODUCTION
Although much has been learned about the causes of asthma in recent years, many details of its pathogenic mechanisms remain unclear. There is, however, a growing consensus that T lymphocytes may play an important part in regulating the immunological and inflammatory processes thought to underly asthma [1,2]. Convincing evidence has been presented for the role of the Th2-type cytokines IL-3, IL-4, IL-5 and IL-10 in controlling the key processes of IgE production, growth of mast cells and the differentiation and activation of mast cells and eosinophils [2–4]. Moreover, T cells obtained by biopsy or lavage from asthmatic airways are activated, as shown by expression of surface markers and the presence of mRNA for a range of cytokines [2,5–7]. T cells recognize allergens only after intracellular processing when specific peptides are presented on a cell surface in association with an MHC molecule. This peptide–MHC complex interacts with TCR, which recognize the complex and this in turn leads to the production of cytokines and downstream events. Only T cells can recognize and respond to processed allergens directly (rather than relying on surface-bound immunoglobulins such as IgE). Accordingly the T cells may play a crucial role in initiating and maintaining on-going immunologically driven chronic asthma, particularly in intrinsic asthma where the IgE response is absent or minimal.
The T lymphocytes in the lung are thought to form a compartmentalized lymphoid population [8] which is relatively resistant to proliferative signals [9]. By studying the TCR repertoire in the lung of atopic asthmatic patients it may be possible to obtain an insight into the forces that shape that repertoire and hence shed some light on the functionality of airway T cells. Furthermore, in individuals with atopic asthma, recurring and/or chronic exposure to antigen may result in the preferential expansion of antigen-specific T cells with a given TCR. This process may lead to oligoclonal expansion of airways T lymphocytes, reflecting the influence of the antigen [10]. Similarly, if superantigenic stimulation were operating one would expect to see expansion of individual TCRBV families independent of antigen specificity and hence without any evidence of clonality [11].
T cell repertoires have been studied in several diseases where it is known that T cells play a central role in disease, including rheumatoid arthritis, multiple sclerosis and pulmonary sarcoidosis [10,12–24]. These studies have been difficult to reproduce, and thus far, distortions in the TCR repertoire have not been consistent in any single disease. This may be due to a variety of reasons, including choice of patient populations, the stage of disease being studied, as well as the method of study. The two most common methods used to investigate TCR repertoires are quantitative polymerase chain reaction (PCR) and flow cytometry. In this study we have used available MoAbs to TCRBV families to stain lymphoid populations from lung and blood from normal and atopic individuals to assess differences between these lymphoid compartments and between individuals. These lymphoid populations were also assessed for T cell clonality or oligoclonality by PCR amplification of cDNA and gene scanning using consensus TCRBV and TCRBV family-specific primers.
SUBJECTS AND METHODS
Subjects
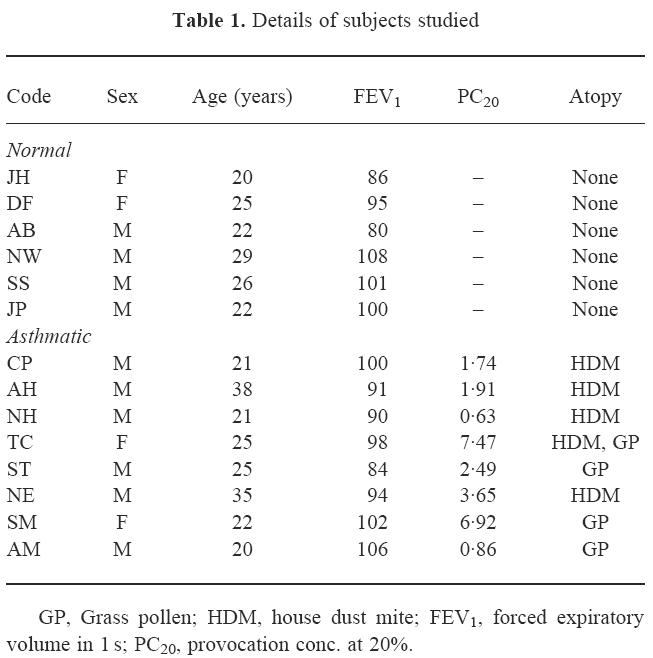
Eight mild atopic asthmatics and six non-atopic non-asthmatic subjects took part in this study (Table 1). The asthmatic subjects all met the American Thoracic Society criteria for asthma with variable airflow obstruction and bronchial hyperresponsiveness as defined by responsiveness to histamine. Atopy was confirmed by skin prick tests to a panel of common aeroallergens. Bronchoscopy was performed by a standard technique conforming to NHLBI guidelines [25]. Briefly, subjects were premedicated with nebulized albuterol (2.5 mg), i.v. atropine (0.6 mg) and midazolam (5–8 mg). Topical upper airway anaesthesia was achieved with 4% lidocaine spray. Supplementary oxygen was administered by nasal cannulae, while oxygen saturation and pulse rate were monitored throughout. The fibreoptic bronchoscope (Olympus BF-XT20 or BF-IT20) was introduced by the oral route and additional lidocaine (2%) given as required to achieve lower airway anaesthesia. Two bronchoalveolar lavages (BAL) were performed, first in the medial segment of the right middle lobe and then in the anterior segment of the right upper lobe. In each case, the bronchoscope was wedged in the segmental bronchus, 6 × 20 ml warm isotonic saline were injected and then aspirated by the suction channel.
Table 1.
Details of subjects studied
Endobronchial allergen challenge
Four of the atopic asthmatics underwent local, endobronchial allergen challenge. After confirming their suitability for inclusion in the study, subjects attended 2 days before bronchoscopy for spirometry and skin test titration to determine the allergen concentration to be used. The allergen extract chosen for local challenge was that which gave the largest wheal response on skin prick testing. The concentration selected for challenge was one-tenth of the dilution that evoked a wheal of 3 mm or less in the titration series. Venous blood was obtained for FACS analysis and then bronchoscopy was performed as described above. A baseline lavage sample was obtained from the lingula with 6 × 20 ml aliquots of prewarmed isotonic saline, aspirating the lavage fluid via the suction channel. The bronchoscope was then wedged in the anterior segment of the right upper lobe and 20 ml prewarmed isotonic saline were injected via the suction channel. After 20 s, the bronchoscope was resited in the medial segment of the right middle lobe and 20 ml prewarmed allergen solution were injected. After 20 s the bronchoscope was withdrawn to the right main bronchus and any excess fluid aspirated. The bronchoscope was then withdrawn and the subject allowed to recover. Twenty-four hours later, a further venous blood sample was obtained and bronchoscopy was repeated, using the same premedication and local anaesthesia. BAL was performed with 6 × 20 ml isotonic saline, initially in the saline-challenged segment and then in the allergen-challenged segment. The bronchoscope was then withdrawn and the subject allowed to recover.
The recovered BAL fluid was filtered through a 100-nm nylon sieve and centrifuged at 1500 g for 10 min. The cell pellet was resuspended in RPMI 1640 medium and adjusted to 1 × 10⁶ cells/ml. A 100-μl aliquot of cells was cytocentrifuged (Cytospin, Shandon Southern, Runcorn, UK), air-dried and stained with May–Grünwald–Giemsa to obtain differential cell counts. Peripheral blood analysis was performed on heparinized whole blood.
Phenotyping
BAL and whole blood were analysed concurrently by three-colour flow cytometry using a panel of 15 FITC-labelled MoAbs against TCRBV family gene products 2, 3, 5S1, 5S2/3, 6S7, 7S1, 8, 12S1, 13S1, 13S1/3, 14, 17, 20, 21S3 and 22. These MoAbs were obtained from Serotec (Oxford, UK), Immunotech (Luton, UK) and Professor A. Boylston (Leeds, UK). The second and third labels were PE-labelled CD4 or CD8 MoAbs and PerCP-labelled CD3. These and isotype-matched controls were purchased from Becton Dickinson (Oxford, UK). Samples were run on a FACScan analyser using the Lysis II program (Becton Dickinson). Ten thousand events were collected within a lymphocyte gate. T cells were identified by CD3 staining and then analysed for BV expression within the whole T cell population and in the CD4 and CD8 subsets. BV expression was normalized by summing the percentages of BV expression and then expressing the individual results as a percentage of total percentage stained by all the BV antibodies. This made it possible to compare relative expression in blood and BAL and allowed the selection for gene scanning and sequencing of families that showed over three-fold relative increase in BAL compared with peripheral blood.
Genotyping
Total RNA was prepared from fresh peripheral blood by extraction using RNAzol B (Tel-Tex) followed by cDNA synthesis using reverse transcriptase (RT) and an oligo dT primer (Not-l-d(T)18) (Pharmacia, St Albans, UK).
TCRB PCR amplification was performed essentially as described by Kneba et al. [26]. The PCR amplification was performed using a semi-nested approach using VBcon, JBI(2) and JBII(2) primers in the first round of amplification, and VBcon (fluorescently labelled), JBI(1) and JBII(1) primers for the second round of amplification. The PCR reaction mixture contained the following: 1 μl cDNA, 10 μm (first round)/3 μm (second round) primers, 3 mm (first round)/1.5 mm (second round) MgCl2, 200 μm of each dNTP and 1 U of Taq DNA polymerase (Boehringer Mannheim, Lewes, UK). Sterile water and 10 × PCR buffer were added to a total volume of 50 μl. Two percent volume of the first round PCR products were used for the second round of amplification. Samples were subjected to 40 first round PCR cycles (92°C for 1 min, 50°C for 40 s, 72°C for 30 s) and 30 second round cycles (92°C for 1 min, 56°C for 40 s, 72°C for 30 s). PCR products of about 255 bp (range 240–290 bp) were generated and analysed on a 2.5% agarose gel.
For analysis on the ABI automated gene sequencer, 1 μl of PCR product was mixed with 3 μl formamide and 0.5 μl of the internal size standard Genescan-2500 Rox (Applied Biosystems, Warrington, UK). PCR products were denatured for 3 min at 90°C and size separated on a high resolution polyacrylamide gel and analysed using the GENESCAN 672 software.
For TCRBV family-specific amplification, PCR was performed using three BV family-specific primers (BV5S2/3, BV6, BV7) and a 3′ BC primer (5′ fluorescently labelled). The specific PCR reaction mixture contained the following: 1–2 μl cDNA, 200 ng BV and BC primers, 200 μm of each dNTP and 2 U Taq DNA polymerase (Boehringer Mannheim). Sterile water and 10 × PCR buffer were added to a total of 50 μl. The samples were subjected to 33 cycles of PCR (94°C for 30 s, 55°C for 30 s, 72°C for 30 s) and analysed on the automated sequencer as detailed above.
Fluorescent PCR products are represented as electrophoregrams where relative fluorescence intensities are plotted as a function of PCR fragment size. Products from clonal cell populations were visualized as one or two sharp peaks of fluorescence corresponding to the PCR amplified clonal rearranged allele(s), while cDNA extracted from normal polyclonal peripheral blood was visualized as a fluorescence spectrum composed of polyclonal PCR fragments of different sizes in a normal Gaussian distribution with peaks spaced by 3 bp corresponding to selected in-frame rearrangements. Oligoclonal profiles were visualized as a modification of the Gaussian distribution where three or more distinct peaks appeared above the normal polyclonal background.
For sequence analysis, PCR products were run on a 3% Nusieve agarose gel, purified using the Geneclean II kit (Stratech Scientific, Luton, UK) and blunt-end ligated into pGEM-TA vector (Promega, Southampton, UK) and transformed into JM109 competent cells (Promega). Single-stranded DNA was prepared and sequenced by the dideoxy chain termination method using Sequenase version 2.0 (Amersharn International, Aylesbury, UK) and M13 primers. For each DNA sample 15–20 randomly chosen clones were sequenced. Sequence alignment analysis was performed using Genbank and current databases with MacVector 4.1.4 sequence analysis software to identify particular BV, BD and BJ gene segments and N region addition for each BVBC recombination.
RESULTS
Phenotyping
The TCR BV MoAb panel accounted for 49 ± 15% and 50 ± 7% of CD3, 53 ± 10% and 54 ± 10% of CD4, 42 ± 20% and 42 ± 8% of CD8+ T cells in peripheral blood, and 62 ± 19% and 55 ± 9% of CD3, 66 ± 15% and 67 ± 9% of CD4, 61 ± 19% and 55 ± 10% of CD8+ T cells in BAL, from normals and asthmatics, respectively. For peripheral blood and BAL from asthmatic patients, post-allergen challenge, TCR BV staining accounted for 54 ± 5% and 57 ± 6% of CD3, 60 ± 6% and 59 ± 12% of CD4, 44 ± 13% and 57 ± 17% of CD8+ T cells, respectively. TCR family relative representation in CD3+ T cell populations from blood and BAL of normal and atopic subjects is shown in Fig. 1. There was variation of TCRBV family expression within each individual and between individuals for both the blood and lung lymphocyte populations. However, differences between the lung and blood lymphoid usage of a given TCRBV family in each individual were less pronounced than the differences between individuals. Differences between TCRBV family expression were observed between blood and BAL both in normal and in atopic donors. A total of 20 significant differences, observed as a three-fold increase in BV expression in BAL compared with peripheral blood or vice versa, were identified: in nine cases a particular BV family was increased in blood and in 11 instances the family was increased in BAL. BV7S1 showed a consistent increase in BAL fluid compared with blood in both asthmatic and normal donors (Fig. 1). The differences observed between blood and BAL were also present in the CD4+ and CD8+ subpopulations, with the exception that BV5S2/3 was increased in BAL CD4+ cells compared with blood in the asthmatic patients (Fig. 2). This difference was not seen in the normal subjects where the BV usage in CD4+ cells reflected the pattern in CD3+ cells. Differences between CD8+ subpopulations from blood and lung from either the normal or asthmatic groups also reflected the situation in the total CD3+ populations, with no CD8+-specific variations.
Fig. 1.
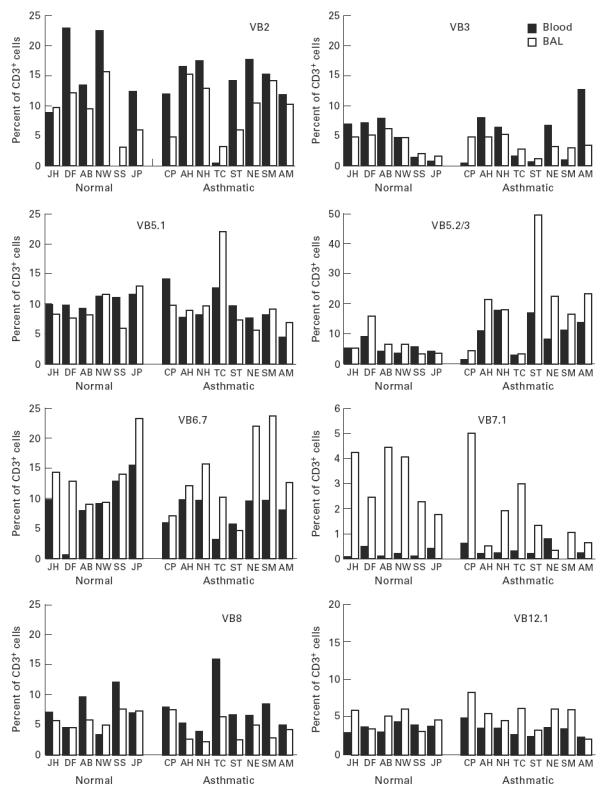
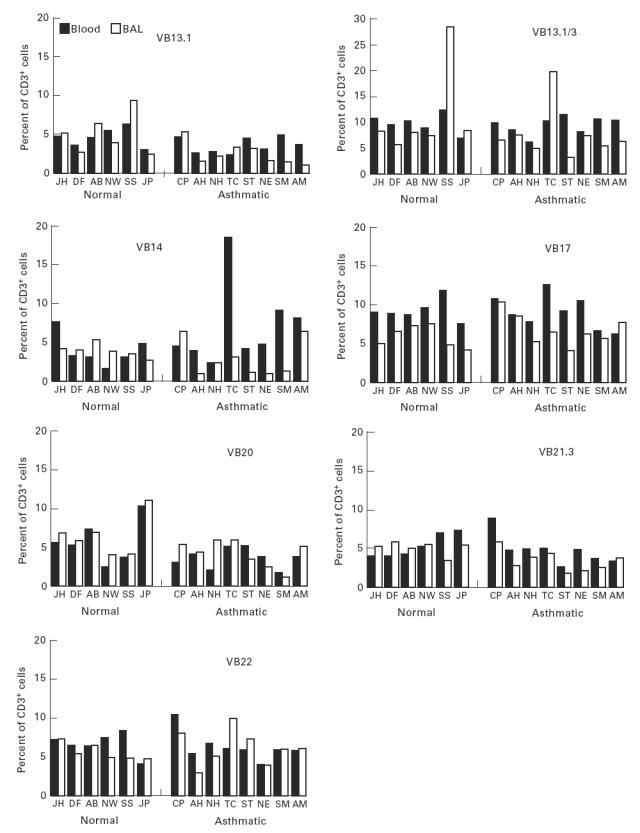
Proportions of peripheral blood and bronchoalveolar lavage (BAL) CD3+ T cells expressing each TCRBV family, as assessed by flow cytometry.
Fig. 2.
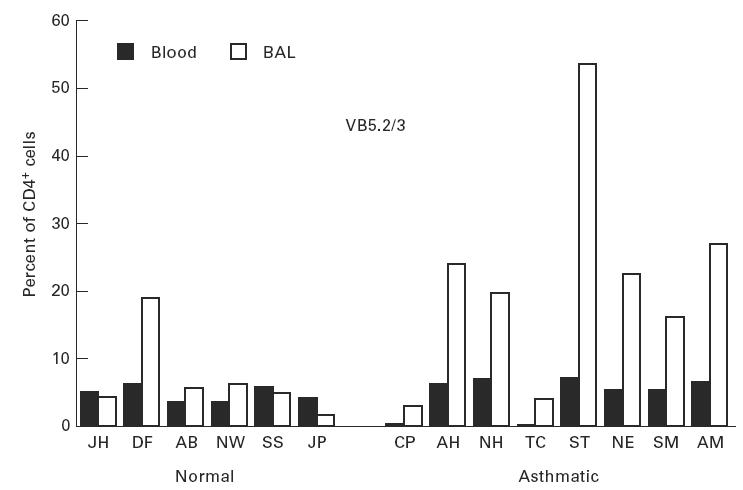
Proportion of peripheral blood and bronchoalveolar lavage (BAL) CD4+ T cells expressing BV5S2/3 as assessed by flow cytometry.
Allergen challenge
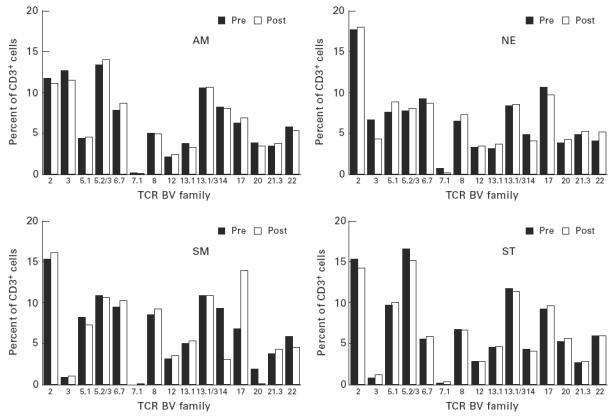
Four asthmatics were studied pre- and post-allergen challenge. There were no major changes in the relative proportions of T cells expressing each of the TCR BV families studied. The most striking change was a reduction in the proportion of CD3+ cells using BV5S2/3 in the individuals NE and ST who had shown the highest usage of this family. The reduction was seen in both the allergen- and the saline-challenged sites (Fig. 3). In the peripheral blood, the proportions of T cells expressing each family remained remarkably similar (Fig. 4).
Fig. 3.
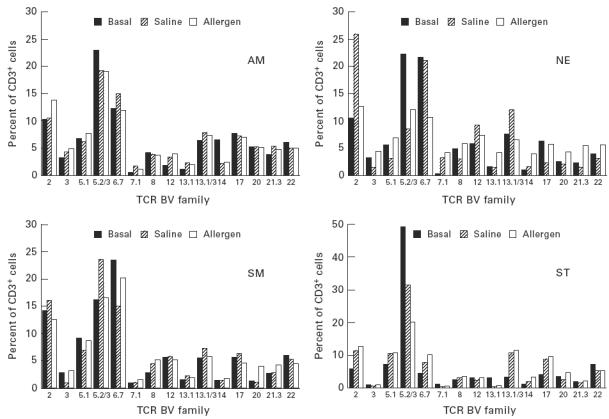
Proportions of bronchoalveolar lavage (BAL) CD3+ T cells expressing each TCRBV family before and after challenge with allergen or saline, as assessed by flow cytometry.
Fig. 4.
Proportions of peripheral blood CD3+ T cells expressing each TCRBV family before and after challenge.
Genotyping
The specificity of the fluorescent fragment analysis (gene scanning) was validated using cDNA extracted from lymphoma cases (previously shown to be clonal by TCRB Southern blot analysis and TCRB RT-PCR) and amplified with a specific BV family primer. Products from the clonal cell populations produced one or two sharp peaks of fluorescence corresponding to the PCR-amplified clonal rearranged allele, while DNA extracted from normal polyclonal peripheral blood lymphocytes produced a ‘fluorescence spectrum’ composed of polyclonal PCR fragments of different sizes. This fluorescence spectrum or spectratype shows a Gaussian distribution of PCR products; the peaks are discrete and spaced by 3 bp corresponding to selected in-frame rearrangements. To assess the sensitivity of this technique, a known BV7-positive clonal control was serially diluted with DNA from normal polyclonal blood lymphocytes and amplified using the fluorescently labelled BV7 primer. After gene scanning, the clonal peak could be detected at 6% clonal DNA in a backgound polyclonal fluorescent spectrum.
Scan profiles of normal healthy peripheral blood using BV consensus primer showed a normal Gaussian distribution of PCR products, but because the primer binds to varying nucleotide positions for each BV gene family, discrete peaks are not usually visible, whereas when specific BV family primers are used fluorescent peaks are spaced by 3 bp corresponding to selected in-frame rearrangements.
Peripheral blood from all asthmatic and one normal subject gave BV scans consistent with a normal Gaussian distribution of PCR product (polyclonal pattern) using the BV consensus primer (Table 2). Matched BAL samples from all asthmatics gave similar profiles showing a Gaussian distribution of PCR products consistent with polyclonal TCR families. However, the matched BAL from the normal donor DF gave a skewed scan profile in which one or two dominant peaks were observed above the normal Gaussian background, which we have termed an oligoclonal pattern (Table 2).
Table 2.
Clonality of TCR usage in blood and bronchoalveolar lavage (BAL) samples from a normal donor and asthmatic patients assessed using automated fluorescent gene scanning for BV consensus, BV5S2/3, BV6 and BV7 primers
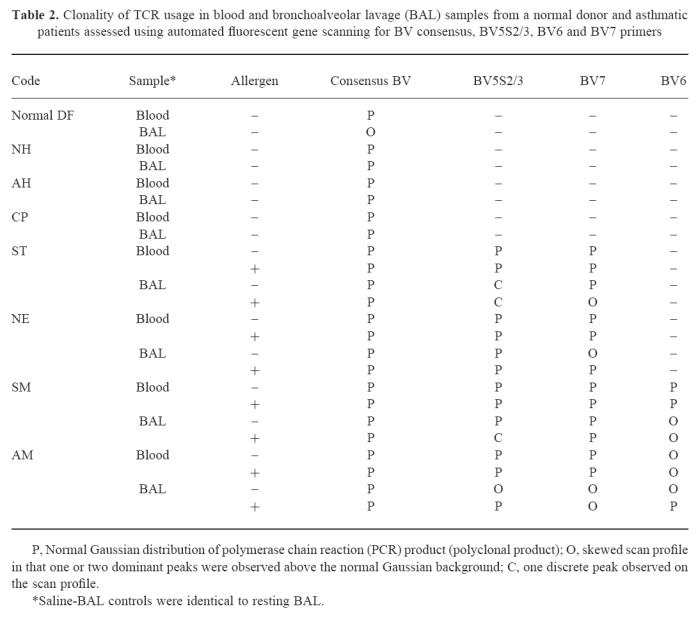
BV families (BV5S2/3, BV6S7, BV7S1) showing significant differences between blood and BAL by flow cytometry were amplified with family-specific primers and analysed by gene scanning. Gene scanning performed after BV5S2/3 amplification showed a clonal pattern with a predominant sharp single peak in asthmatic case ST (Fig. 5) in BAL before allergen challenge. In the other asthmatic cases, BV5S2/3, BV7 and BV6 amplifications either showed a normal Gaussian distribution (Fig. 5; Table 2) consistent with polyclonal PCR products of different CDR3 lengths, or a skewed distribution consistent with a restricted/oligoclonal pattern.
Fig. 5.
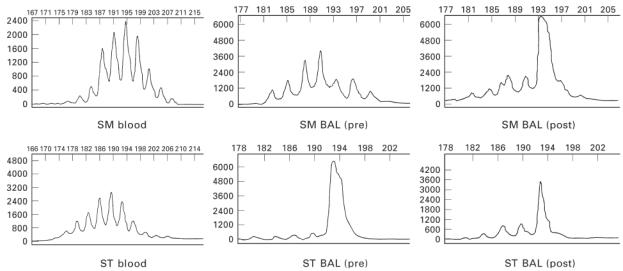
Electrophoretic profiles derived from automated gene scanning of cDNA polymerase chain reaction (PCR) products from peripheral blood and bronchoalveolar lavage (BAL) of asthmatic subjects. Relative fluorescence intensities (ordinate) are plotted as a function of PCR fragment size (abscissa). Top row: BV5S2/3 scan profiles for patient SM showing a normal Gaussian distribution of PCR products for blood and BAL (before challenge) and a clonal scan profile (one dominant fluorescent peak) for BAL (post-challenge). Bottom row: BV5S2/3 scan profiles for patient ST showing a normal Gaussian distribution of PCR products for blood and a clonal scan profile for BAL both pre- and post-allergen challenge.
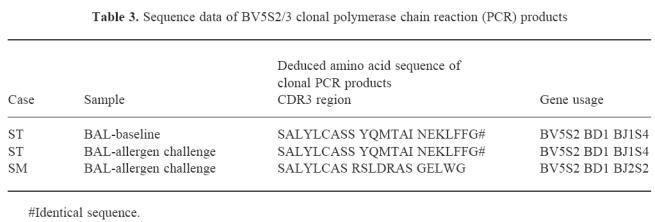
Four asthmatics (ST, NE, SM, AM) were studied post-allergen challenge and PCR products generated from family-specific primers and consensus primers were studied in these cases (Fig. 5; Table 2). All blood scans apart from AM (BV6) showed polyclonal usage reflecting the lack of gross detectable changes after allergen challenge. In AM the BV6 family was oligoclonal both before and after challenge. Populations in BAL showed several changes after allergen challenge, a clonal BV5S2/3 peak was observed in patient SM, a shift from oligoclonal to polyclonal scan patterns was observed in patients NE (BV7) and AM (BV6, BV5S2/3) and polyclonal to oligoclonal in patient ST (BV7). The clonal BV5S2/3 peak observed in ST before allergen challenge was also observed after challenge. Clonal BV5S2/3 PCR products from ST (BAL) pre- and post-challenge and from SM (BAL, post-challenge) were cloned and sequenced to confirm clonality. In patient ST, identical BV5S2/3 clonal sequences were identified in 7/7 and 8/10 sequences analysed in the pre- and post-challenge samples, respectively, and in patient SM identical BV5S2/3 sequences were identified in 9/15 sequences analysed. Sequences are shown in Table 3. No changes were seen in the saline-challenged control site.
Table 3.
Sequence data of BV5S2/3 clonal polymerase chain reaction (PCR) products
DISCUSSION
In this study we have examined the TCR repertoire of BAL T cells in normal and asthmatic subjects before and after allergen challenge.
The use of flow cytometry and antibodies specific for BV families provides a quantitative answer for those BV families against which antibodies are available. Differences were shown in TCRBV family expression between lung and blood in both normal and asthmatic subjects. In BAL from normal and atopic individuals, with the exception of subject NE, BV7S1 was increased compared with the matching blood. TCR BV5S2/3 families were increased in the BAL CD4+ T cell subset from all atopic individuals compared with normal subjects. The consistently low expression of BV7S1 for both normals and asthmatic individuals across all compartments and subsets for all subjects studied was notable, and in all cases BV7S1 was expressed at higher levels in the BAL than in blood. This suggests that T cells using the BV7S1 subfamily selectively accumulate in the lung independent of disease. In the peripheral blood of normal individuals, BV families 2, 6S7 and 13S1/3 were relatively over-represented and BVs 3, 13S1 and 14 were under-represented within the CD3+ population. This contrasts with other studies of peripheral blood, where a larger number of different families were over-represented. In three separate studies, BVs 4, 5, 6, 8 and 13, BVs 1, 4, 5S2/3 and 9, and BVs 2, 6, 7, 13S1 and 13S2 were reported to be the most abundant [27–29].
One recent study reported that the pattern of BV expression was broadly similar in BAL and peripheral blood in normal subjects, with over-representation of BVs 1–3 and 6–9 in both BAL and blood of normal individuals [30]. This is consistent with our findings, except for the BV7S1 results, and taken together these studies suggest that the BAL lymphocyte population may not be truly compartmentalized from the blood. While in normal and asthmatic subjects, BAL TCRBV expression followed blood BV expression, there was more variability in the BAL from asthmatics, especially in the CD8+ subset. In all asthmatics BV5S2/3 was expressed on a higher proportion of CD4+ T cells than on CD8+ T cells in BAL. Skewing of certain BV families has been noted before in normal peripheral blood [31–34], but has not been reported in BAL. Skewing of the BV repertoire and variability of expression within the CD4+ or CD8+ subsets in BAL may be due to selective accumulation of the BV family from blood in response to allergen(s) and/or infection such as viruses to which asthmatics are prone.
Phenotypic characterization of blood and BAL lymphocyte families post-allergen challenge revealed some shifts in the BAL TCRBV repertoire within individuals, but no consistent pattern across the group. The blood populations were remarkably consistent.
Differences between the normal and asthmatic TCRBV repertoires may be masked by non-specific recruitment of T cells to the sites of mucosal inflammation, thereby diluting any asthma-specific T cell responses. The diverse T cell response in asthma may also arise from different antigenic determinants being relevant in different individuals, dependent on the stage and duration of disease. In this study a high degree of inter-individual TCRBV variation was noted for both normal and asthmatic subjects. Inter-individual differences in TCR usage in affected organs have been noted in other diseases such as multiple sclerosis [15,16], rheumatoid arthritis [12,17,35] and sarcoidosis [23,36]. These differences could be due to inter-individual variation in antigen processing and presentation, environmental influences, differing genomic TCR repertoires, known effects of the MHC on the TCR repertoire disease duration and clinical status [10,37,38].
Automated gene scanning of the CDR3 sequences is a powerful technique which allows the detection of clonal or oligoclonal populations using particular TCRBV sequences [26]. The CDR3 sequence or junctional region of the TCRB chain is encoded by the V-D-J gene segments and is the part of the TCR which interacts directly with peptide bound by the MHC [39]. T cells with identical antigen specificities should share conserved CDR3 amino acid sequences, as they recognize the same epitope. An oligoclonal pattern of BV expression should thus be observed if antigen-driven stimulation causes clonal expansion, while a polyclonal pattern of BV expression would be expected if T cells are recruited to the lungs non-specifically. This technique is sensitive to 6% clonal DNA in a polyclonal background. Peripheral blood from all asthmatics and one normal subject gave BV scans consistent with polyclonal populations using the BV consensus primer. Matched BAL also gave polyclonal patterns, with the exception of an oligoclonal pattern from the normal donor (DF). These data suggest that TCRBV oligoclonal families may be found in both normal donors. Oligoclonal families have been previously identified in BAL from normal individuals with reproducibility of this pattern over time [30].
Recovery of cells from BAL is limited, and because of the numbers required for flow cytometric phenotyping, cell recovery for cDNA isolation and PCR amplification with family-specific primers was restricted to those TCR families predominant in resting BAL compared with blood from asthmatic individuals. PCR amplification with BV family-specific (BV5S2/3, BV6, BV7) primers revealed a clonal TCR BV5S2 population in the BAL from an asthmatic (ST), BV5S2/3, BV6, BV7 oligoclonal families in AM, oligoclonal BV6 families in SM and AM and oligoclonal BV7 in NE. Whether all TCR families contain oligoclonal families has not been investigated, and while we have been able to demonstrate that family representation was not significantly different between CD4+ and CD8+ T cell subpopulations, we were not able to determine whether the oligoclonality was present in one or both of these lymphocyte subpopulations. All TCRBV gene families in blood were polyclonal.
Peripheral blood and BAL from asthmatics following allergen challenge gave BV scans consistent with polyclonal populations using the BV consensus primer. These data suggest that gross changes in TCRBV patterns following challenge are not detectable. However, changes could be detected within individual TCRBV families in BAL, indicating subtle shifts in BAL T cell subpopulations in response to allergen challenge. The three BV families (BV5S2/3, BV6, BV7) chosen for detailed study were selected because they showed significant differences between blood and BAL by flow cytometry. Three patterns of TCR family usage followed allergen challenge. In the first there was no change in TCR family usage; this pattern was observed in most cases. In subject ST a clonal BV5S2 population was present before and after challenge. This indicates, first, that the clonal population was present in resting lung and could be found in more than one segment, and second, that allergen challenge did not bring in TCRBV5S2-bearing cells randomly from the blood, which would have resulted in dilution of the clonal peak and the emergence of a polyclonal background in the TCRBV profile. In two patients (AM and NE) oligoclonal families found prior to challenge were not detectable following allergen stimulation. This pattern has been observed previously and presumably reflects influx of reactive polyclonal lymphocytes from blood associated with inflammation at the site of challenge. This was not, however, true for all families tested, and in patients ST and SM oligoclonal BV7 and clonal BV5S2 families were found after challenge, respectively. In both subjects the oligoclonal and clonal populations were present after but not before challenge, indicating that selective recruitment had occurred following allergen challenge. Importantly, no such populations were seen in the saline-challenged site, demonstrating that this peak was related to allergen and not to the challenge procedure itself. The clonality of PCR products from patients ST and SM was confirmed by sequence analysis.
These data have several important implications. At the technical level, the data suggest that subtle changes following allergen challenge may not be evident in scans of PCR products derived from consensus BV primers. This technique is sensitive down to 6% clonal DNA in a polyclonal background and will not detect new clonal peaks which represent 1–3% of the total BAL population. On the other hand, using family-specific primers allows the detection of changes which represent < 6% of the cells expressing that particular TCRBV gene. Furthermore, in those families where oligoclonal (SM BAL BV6, AM BAL BV7) or clonal (ST BAL BV5S2) populations were found before and after challenge, this selected population reflects lymphoid populations in lung but may not be directly related to the allergen being used for challenge. On the other hand, the marked and segment-specific change in the BV5S2/3 scan pattern in subject SM and BV7 in subject ST suggests an allergen-specific T cell response. Such changes are more likely to result from recruitment of T cells from the circulation than expansion in the tissues over the 24-h period of the study.
Previous studies of the lung T cell repertoire have given contradictory results. Expanded BV gene families have been reported in the lung but not the peripheral blood of normal individuals [22,30] without any consistent pattern. One of these studies reported clonal populations in nearly all BV gene families in lungs of normal subjects [22], while the other found clonal expansions in a few BV families in BAL for each normal individual [30]. Clonal expansions were found more often within the CD8+ subset, reflecting previous reports of the blood CD8+ population being oligoclonal in nature [40,41]. These studies used electrophoresis of PCR products on high resolution polyacrylamide gels to detect PCR products of the same size similar to gene scanning methods employed in this study. Heteroduplex analysis of PCR products from lung found BV expansions in both blood and BAL T lymphocytes of normal subjects [42], but failed to reveal oligoclonal or clonal populations, but in the lungs of atopic individuals oligoclonal T cell expansions were found after antigen provocation of asthmatic airways [43].
While Burastero et al. [43] have reported oligoclonal expansion of T cells after antigen provocation, it is important to note that only one subject in the Burastero study was assessed before and after challenge. It is therefore unclear whether the oligoclones found in that study genuinely arose de novo or were present in the resting BAL, as we have demonstrated in three of the four asthmatic subjects studied here in confirmation of other published studies.
In conclusion, our findings suggest that (i) population phenotyping studies may fail to detect real changes in the lung following allergen challenge; (ii) analyses using a consensus TCRBV primer covering all families may not be sufficiently sensitive to reveal changes in particular TCR families; (iii) an approach using family-specific primers to search for the appearance of clonal populations may be a more appropriate method, especially if coupled with in vitro cultures to assess outgrowth of responding T cell populations. Sequence analysis of CDR3 regions of these responding clones/oligoclones may yield information relevant to allergen-specific recognition. Such studies, however, need to be performed both before and after allergen provocation to assess the relative contribution of T cells in the resting lung as opposed to a restricted study of T cells recruited as a direct and acute response to allergen exposure. Our bias is that clonal populations identified de novo after allergen challenge are more likely to be allergen-specific.
The majority of TCRBV families detected in blood by MoAb staining were also represented in BAL, and while differences between BAL and blood populations were evident in each individual studied, these differences were not consistent between individuals or between CD4+ and CD8+ T cell subpopulations. These results are in broad agreement with other published studies [22,30,42,43]. In contrast to previous work we found a consistent difference between TCR BV7 family expression in blood and BAL in all individuals studied. Furthermore, BV7 was demonstrated to be polyclonal in blood and either oligoclonal or polyclonal in BAL. Where oligoclonal or clonal TCR populations were found these were predominantly in BAL. These data are consistent with the selection and amplification of specific T cell families in the lung in response to local antigenic exposure. We conclude that the lung T cell repertoire is broadly representative of blood T cells, but shows oligoclonal expansion that may result from response to persistent exposure to airborne antigens common to normal and atopic individuals. Furthermore, allergen challenge induces subtle changes in lung TCR populations, but not in blood, consistent with this observation.
Acknowledgments
This work was supported by grants from the Wessex Medical Trust and the Medical Research Council UK.
References
- 1.Frew AJ, Kay AB. Eosinophils and T-lymphocytes in late phase allergic reactions. J Allergy Clin Immunol. 1990;85:533–9. doi: 10.1016/0091-6749(90)90090-q. [DOI] [PubMed] [Google Scholar]
- 2.Corrigan CJ, Kay AB. T cells and eosinophils in the pathogenesis of asthma. Immunol Today. 1992;13:501–7. doi: 10.1016/0167-5699(92)90026-4. [DOI] [PubMed] [Google Scholar]
- 3.Punnonen J, Aversa G, Cocks BG, De Vries JE. Role of IL-4 and IL-13 in synthesis of IgE and expression of CD23 by human B-cells. Allergy. 1994;49:576–86. doi: 10.1111/j.1398-9995.1994.tb00122.x. [DOI] [PubMed] [Google Scholar]
- 4.Saito H, Hatake K, Dvorak AM, Leiferman KM, Donnenberg AD, Arai N, Ishizaka K, Ishizaka T. Selective differentiation/proliferation of hematopoietic cells by recombinant human interleukins. Proc Natl Acad Sci USA. 1988;85:2288–92. doi: 10.1073/pnas.85.7.2288. [DOI] [PMC free article] [PubMed] [Google Scholar]
- 5.Azzawi M, Bradley B, Jeffery PK, et al. Identification of activated T lymphocytes and eosinophils in stable atopic asthma. Am Rev Respir Dis. 1990;142:1407–13. doi: 10.1164/ajrccm/142.6_Pt_1.1407. [DOI] [PubMed] [Google Scholar]
- 6.Wilson JW, Djukanovic R, Howarth PH, Holgate ST. Lymphocyte activation in bronchoalveolar lavage and peripheral blood in atopic asthma. Am Rev Respir Dis. 1992;145:958–60. doi: 10.1164/ajrccm/145.4_Pt_1.958. [DOI] [PubMed] [Google Scholar]
- 7.Robinson DS, Hamid Q, Ying S, et al. Predominant ‘TH2-like’ bronchoalveolar lavage T-lymphocyte population in atopic asthma. N Engi J Med. 1992;326:298–304. doi: 10.1056/NEJM199201303260504. [DOI] [PubMed] [Google Scholar]
- 8.Pabst R, Binns RM. Lymphocytes migrate from the bronchoalveolar space to regional bronchial lymph nodes. Am J Respir Crit Care Med. 1995;151:495–9. doi: 10.1164/ajrccm.151.2.7842212. [DOI] [PubMed] [Google Scholar]
- 9.Lecossier D, Valeyre D, Loiseau A, Cadranel J, Tazi A, Battesti JP, Hance AJ. Antigen-induced proliferative response of lavage and blood T-lymphocytes. Am Rev Respir Dis. 1991;144:861–8. doi: 10.1164/ajrccm/144.4.861. [DOI] [PubMed] [Google Scholar]
- 10.Marguerie C, Lunardi C, So A. PCR-based analysis of the TCR repertoire in human autoimmune diseases. Immunol Today. 1992;13:336–8. doi: 10.1016/0167-5699(92)90166-5. [DOI] [PubMed] [Google Scholar]
- 11.Kappler J, Kotzin B, Herron L, et al. V13-specific stimulation of human T-cells by staphylococcal toxins. Science. 1989;244:811–3. doi: 10.1126/science.2524876. [DOI] [PubMed] [Google Scholar]
- 12.Pluschke G, Rickens G, Taube H, Kroninger S, Melchers I, Peter HH, Eishmann K, Krawinkel U. Biased T-cell receptor Vα region repertoire in the synovial fluid of rheumatoid arthritis patients. Eur J Immunol. 1991;21:2749–54. doi: 10.1002/eji.1830211115. [DOI] [PubMed] [Google Scholar]
- 13.Maruyama T, Saito IS, Miyake S, Hashimoto H, Sato K, Yagita H, Okamura K, Miyasaka N. A possible role of two hydrophobic amino acids in antigen recognition by synovial T-cells in rheumatoid arthritis. Eur J Immunol. 1993;23:2059–65. doi: 10.1002/eji.1830230903. [DOI] [PubMed] [Google Scholar]
- 14.Zagon G, Tumang JR, Li Y, Friedman SM, Crow MK. Increased frequency of VB17-positive T-cells in patients with rheumatoid arthritis. Arthritis Rheum. 1994;37:1431–40. doi: 10.1002/art.1780371005. [DOI] [PubMed] [Google Scholar]
- 15.Oksenberg JR, Stuart S, Bejovich AB, Bell RB, Erlich HA, Steinman L, Bernard CA. Limited heterogeneity of rearranged T-cell receptor V-α transcripts in brains of multiple sclerosis patients. Nature. 1990;345:344–6. doi: 10.1038/345344a0. [DOI] [PubMed] [Google Scholar]
- 16.Vandevyver C, Mertens N, van den Elsen P, et al. Clonal expansion of myelin basic protein-reactive T-cells in patients with multiple sclerosis: restricted T-cell receptor V gene rearrangements and CDR3 sequences. Eur J Immunol. 1995;25:958–68. doi: 10.1002/eji.1830250416. [DOI] [PubMed] [Google Scholar]
- 17.Lunardi C, Marguerie C, So AK. An altered repertoire of T-cell receptor V gene expression by rheumatoid synovial fluid T-lymphocytes. Clin Exp Immunol. 1992;90:440–6. doi: 10.1111/j.1365-2249.1992.tb05865.x. [DOI] [PMC free article] [PubMed] [Google Scholar]
- 18.Bellocq A, Lecossier D, Pierre-Audiger C, Tazi A, Valeyre D, Hance AJ. T cell receptor repertoire of T-lymphocytes recovered from the lung and blood of patients with sarcoidosis. Am J Respir Crit Care Med. 1994;149:646–54. doi: 10.1164/ajrccm.149.3.7906994. [DOI] [PubMed] [Google Scholar]
- 19.Forrester JM, Wang Y, Ricalton N, Fitzgerald JE, Loveless J, Newman LS, King TE, Kotzin BL. TCR expression of activated T cell clones in the lungs of patients with pulmonary sarcoidosis. J Immunol. 1994;153:4291–302. [PubMed] [Google Scholar]
- 20.Forman JD, Klein JT, Silver RF, Liu MC, Greenlee JT, Moller DR. Selective activation and accumulation of oligoclonal VB-specific T-cells in active pulmonary sarcoidosis. J Clin Invest. 1994;94:1533–42. doi: 10.1172/JCI117494. [DOI] [PMC free article] [PubMed] [Google Scholar]
- 21.Grunewald J, Shigematsu M, Nagai S, Mikuniya T, Wigzell H, Izumi T, Eklund AG. T-cell receptor V gene expression in HLA-typed Japanese patients with sarcoidosis. Am J Respir Crit Care Med. 1995;151:151–6. doi: 10.1164/ajrccm.151.1.7812546. [DOI] [PubMed] [Google Scholar]
- 22.Dohi M, Yamamoto K, Masuko K, et al. Accumulation of multiple T-cell clonotypes in lungs of healthy individuals and patients with pulmonary sarcoidosis. J Immunol. 1994;152:1983–8. [PubMed] [Google Scholar]
- 23.Silver RF, Crystal RG, Moller DR. Limited heterogeneity of biased T-cell receptor VB gene usage in lung but not blood T-cells in active pulmonary sarcoidosis. Immunology. 1996;88:516–23. doi: 10.1046/j.1365-2567.1996.d01-683.x. [DOI] [PMC free article] [PubMed] [Google Scholar]
- 24.Jones CM, Lake RA, Wijeyekoon JB, Mitchell DM, du Bois RM, O'Hehir RE. Oligoclonal V gene usage by T-lymphocytes in bronchoalveolar lavage fluid from sarcoidosis patients. Am J Respir Cell Mol Biol. 1996;14:470–7. doi: 10.1165/ajrcmb.14.5.8624252. [DOI] [PubMed] [Google Scholar]
- 25.NHLBI workshop summary and guidelines. Investigative use of bronchoscopy, lavage and bronchial biopsies in asthma and other airway diseases. J Allergy Clin Immunol. 1991;88:808–14. doi: 10.1016/0091-6749(91)90189-u. [DOI] [PubMed] [Google Scholar]
- 26.Kneba M, Bolz I, Linke B, Hiddeman W. Analysis of rearranged T-cell receptor beta-chain genes by polymerase chain reaction (PCR) DNA sequencing and automated high resolution PCR fragmentation analysis. Blood. 1995;86:3930–7. [PubMed] [Google Scholar]
- 27.Guersen A, Skinner MA, Townsend LA, et al. Population study of T cell receptor VB gene usage in peripheral blood lymphocytes: differences in ethnic groups. Clin Exp Immunol. 1993;94:201–7. doi: 10.1111/j.1365-2249.1993.tb06001.x. [DOI] [PMC free article] [PubMed] [Google Scholar]
- 28.Hu HZ, de Weger RA, Bosboom-Kelsbeek K, Tilanus MGJ, Rozing J, Schuurman HJ. T cell receptor VB variable gene family expression in human peripheral blood lymphocytes at the mRNA and membrane protein level. Clin Exp Immunol. 1992;88:335–40. doi: 10.1111/j.1365-2249.1992.tb03083.x. [DOI] [PMC free article] [PubMed] [Google Scholar]
- 29.Malhotra V, Spielman R, Concannon P. Variability in T cell receptor VB gene usage in peripheral blood lymphocytes. J Immunol. 1992;149:1802–8. [PubMed] [Google Scholar]
- 30.Yurovsky VV, Bleecker ER, White B. Restricted T-cell antigen receptor repertoire in bronchoalveolar T-cells from normal humans. Hum Immunol. 1996;50:22–37. doi: 10.1016/0198-8859(96)00126-7. [DOI] [PubMed] [Google Scholar]
- 31.Molfino NA, Doherty PJ, Suurman IL, Yang SX, Kesten S, Chapman KR, Slutsky AS. Analysis of the T-cell receptor V gamma region gene repertoire in bronchoalveolar lavage and peripheral blood of atopic asthmatics and healthy subjects. Clin Exp Immunol. 1996;104:144–53. doi: 10.1046/j.1365-2249.1996.d01-645.x. [DOI] [PMC free article] [PubMed] [Google Scholar]
- 32.Grunewald J, Janson CH, Wigzell H. Biased expression of TcR V gene segments in CD4+ and CD8+ human peripheral blood T lymphocytes. Eur J Immunol. 1991;21:819–22. doi: 10.1002/eji.1830210342. [DOI] [PubMed] [Google Scholar]
- 33.Davey MP, Meyer MM, Munkirs DD. T cell receptor variable β genes show differential expression in CD4+ and CD8+ T-cells. Hum Immunol. 1991;32:194–202. doi: 10.1016/0198-8859(91)90056-f. [DOI] [PubMed] [Google Scholar]
- 34.McCoy JP, Overton WR, Schroeder K, Blumstein L, Donaldson MH. Immunophenotypic analysis of the T cell receptor VB repertoire in CD4+ and CD8+ lymphocytes from normal peripheral blood. Comm Clin Cytometry. 1996;26:148–53. doi: 10.1002/(SICI)1097-0320(19960615)26:2<148::AID-CYTO8>3.0.CO;2-C. [DOI] [PubMed] [Google Scholar]
- 35.Paliard X, West SG, Lafferty JA, Clements JR, Kappler JW, Marrack P, Kotzin BL. Evidence for the effects of a superantigen in rheumatoid arthritis. Science. 1991;253:325–9. doi: 10.1126/science.1857971. [DOI] [PubMed] [Google Scholar]
- 36.Usui Y, Kohsaka H, Eishi Y, Saito I, Marumo F, Miyasaka N. Shared amino acid motifs in T cell receptor β junctional regions of bronchoalveolar T-cells in patients with pulmonary sarcoidosis. Am J Respir Crit Care Med. 1996;54:5. doi: 10.1164/ajrccm.154.1.8680698. [DOI] [PubMed] [Google Scholar]
- 37.Gulwani-Akolkar B, Posnett DN, Janson CH, Grunewald J, Wigzell H, Akolkar PJ, Silver J. T cell receptor V segment frequencies in peripheral blood T cells correlate with human leukocyte antigen type. J Exp Med. 1991;74:1139–46. doi: 10.1084/jem.174.5.1139. [DOI] [PMC free article] [PubMed] [Google Scholar]
- 38.Moss PAH, Rosenberg WM, Zintaras E, Bell JI. Characterisation of the human T cell receptor α chain repertoire and demonstration of a genetic influence on Vα usage. Eur J Immunol. 1993;23:1153–9. doi: 10.1002/eji.1830230526. [DOI] [PubMed] [Google Scholar]
- 39.Davis MM, Bjorkman PJ. T-cell antigen receptor genes and T-cell recognition. Nature. 1988;334:395–402. doi: 10.1038/334395a0. [DOI] [PubMed] [Google Scholar]
- 40.Akolkar PN, Gulwani-Akolkar B, Pergolizzi R, Bigler RD, Silver J. Influence of HLA genes on T cell receptor V segment frequencies and expression levels in peripheral blood lymphocytes. J Immunol. 1993;50:2761–73. [PubMed] [Google Scholar]
- 41.Hingorani R, Choi IH, Akolkar P, Gulwani-Akolkar B, Pergolizzi R, Silver J, Gregersen PK. Clonal predominance of T cell receptors within the CD8+ CD45RO+ subset in normal human subjects. J Immunol. 1993;51:5762–9. [PubMed] [Google Scholar]
- 42.Burastero SE, Borgonovo B, Gaffi D, Frittoli E, Wack A, Rossi GA, Crimi E. The repertoire of T-lymphocytes recovered by BAL from healthy non-smokers. Eur Respir J. 1996;9:319–27. doi: 10.1183/09031936.96.09020319. [DOI] [PubMed] [Google Scholar]
- 43.Burastero SE, Crimi E, Balbo A, et al. Oligoclonality of lung T-lymphocytes following exposure to allergen in asthma. J Immunol. 1995;55:5836–46. [PubMed] [Google Scholar]