Abstract
A particular T cell population expressing NK cell markers, CD56 and CD57, exists in humans. Many CD56+ T and CD57+ T cells (i.e. NK T cells) exist in the liver and increase in number in the blood with ageing. They may be a human counterpart of extrathymic T cells, similar to NK1.1+ CD3int cells seen in mice. We investigate here the existence of such NK T cells in human cord blood and the in vitro expansion of these cells by the stimulation of human recombinant IL-2 (rIL-2). There were very small populations (< 1.0%) of CD56+ T cells, CD57+ T cells, and γδ T cells in cord blood. However, all of these populations increased in number after birth and with ageing. When lymphocytes in cord blood were cultured with rIL-2 (100 U/ml) for 14 days, CD56+ T cells expanded up to 25% of T cells. CD57+ T cells were never expanded by these in vitro cultures. The expansion of γδ T cells (mainly Vγ9− non-adult type) also occurred in the in vitro culture. A considerable proportion of CD56+ T cells was found to use Vα24 (i.e. equivalent to invariant Vα14 chain used by murine NK T cells) for TCR αβ. These results suggest that neonatal blood contains only a few NK T cells but CD56+ NK T cells and γδ T cells are able to expand in vitro.
Keywords: NK T cells, extrathymic T cells, CD56+ T cells, γδ T cells, Vα24+ cells
INTRODUCTION
In addition to T cells derived from the thymus, extrathymically differentiated T cells have been demonstrated in the liver [1–6] and intestine [7–10] of mice. Such extrathymic T cells also carry the surface markers of NK cells (i.e. NK T cells) and have the ability to mediate spontaneous cytotoxicity against tumour cells and rapidly proliferating self-cells [11,12]. Because of their intermediate (int) density of TCR–CD3 complex on the surface, they are termed TCRint cells [3–5]. They comprise double-negative (DN) CD4−8− cells as well as single-positive cells, contain a considerable proportion of γδ T cells, and express IL-2 receptor β-chain (IL-2Rβ) similar to NK cells [4,6]. TCRint cells consistently contain self-reactive forbidden T cell clones as estimated by using anti-Vβ MoAbs in conjunction with the Mls antigen system [5]. Morphologically, they are classified as large granular lymphocytes [6]. In human studies, T cells co-expressing NK cell markers CD56 and CD57, i.e. human NK T cells, were also found to exist in the peripheral blood [13,14]. They have characteristics similar to those ascribed to TCRint cells in mice, except for the expression of high density of TCR–CD3 complex on the surface. These CD56+ T and CD57+ T cells might be human counterparts of extrathymic T cells. CD56+ T and CD57+ T cells are preferentially present among tumour-infiltrating lymphocytes (TIL) and blood lymphocytes in cancer patients.
Attention has been focused on human umbilical cord blood, because of its high composition of haematopoietic stem cells [15–17]. Furthermore, the transplantation of cord blood stem cells is used as an alternative source in bone marrow transplantation or in peripheral blood stem cell transplantation for patients with leukaemia or malignant tumours who receive high doses of chemotherapy [18–20]. In the light of these findings, we investigated whether extrathymic T cells are present in human umbilical cord blood and whether CD56+ T and CD57+ T cells expand when cord blood cells are cultured with rIL-2 and rIL-12. IL-2 is known to be a factor for the differentiation and proliferation of T and NK cells [21,22]. On the other hand, IL-12 activates the cytotoxic function of T and NK cells [23,24]. It was demonstrated that rIL-2 alone induced the expansion of CD56+ T cells and γδ T cells in the cord blood, but that the addition of rIL-12 rather suppressed such expansion. These culture-induced T cells were found to share several properties ascribed to extrathymic T cells in mice, in terms of the phenotype, function, and morphology. Sorting experiments of CD3+CD56− and CD3−CD56− cells showed that both CD3+ and CD3− cells gave rise to CD56+ NK T cells. These results suggest that the cord blood comprises only a few NK T cells, but contains their precursor cells, including CD3+ cells and CD3− cells.
MATERIALS AND METHODS
Cell preparation
Samples of umbilical cord blood (n = 22) were kindly provided by Dr N. Watanabe (Department of Obstetrics and Gynaecology, Kameda Daiichi Hospital, Niigata, Japan). Mononuclear cells (MNC) were purified by Ficoll–Isopaque (1.077) gradient centrifugation and contaminating erythrocytes were lysed using NH4Cl buffer [13]. Peripheral blood mononuclear cells (PBMC) were also obtained from healthy human adults (29.6 ± 3.9 years old, n = l 6) and infants (2.5 ± 1.0 years old, n = 16). Informed consent was obtained from all individuals. The isolated MNC were washed twice and suspended in RPMI 1640 medium supplemented with 10% fetal calf serum (FCS).
Flow cytometric analysis
The surface phenotypes of cells were identified using MoAbs in conjunction with two-colour or three-colour immunofluorescence tests [14]. The MoAbs included FITC- or PE-conjugated anti-CD3 (NU-T3; Nichirei, Tokyo, Japan), anti-CD4 (Leu-3a; Becton Dickinson, Mountain View, CA), anti-CD8 (NU-Ts/c; Nichirei), anti-CD16 (Leu-11; Becton Dickinson), anti-CD56 (Leu-19; Becton Dickinson), anti-CD57 (Leu-7; Becton Dickinson), anti-TCR-γδ (TCR-γ/δ-1; Becton Dickinson), anti-Vγ9 (TCR-Vγ9; PharMingen, San Diego, CA) and anti-Vα24 (Becton Dickinson) MoAbs. Stained cells were analysed by a FACScan (Becton Dickinson). Each measurement was done using 1.0 × 10⁴ (two-colour tests) or 3.0 × 10⁴ (three-colour tests) cells. In the two-colour tests, dead cells were excluded by propidium iodide (PI) staining.
Cytokines
Human recombinant IL-2 (rIL-2) was obtained from Genzyme Co. (Cambridge, MA). Human rIL-12 was kindly provided by Dr W. Hashimoto (Second Department of Oral Surgery, Tohoku University School of Dentistry, Sendai, Japan).
Cell cultures
The obtained MNC were suspended in the RPMI 1640 medium and incubated for 2 h at 37°C, 5% CO2 in a 24-well flat-bottomed microtitre plate to remove monocytes. For analysing the surface phenotype of culture cells, monocyte-depleted MNC (2 × 10⁶ cells/well) from the cord blood were cultured in a 24-well microtitre plate with or without rIL-2 (100 U/ml) and the mixture of rIL-2 (100 U/ml) plus rIL-12 (20 U/ml) for 14 days.
Cell sorting
After two-colour staining for CD3 and CD56, the fractions of CD3−CD56− and CD3−CD56+ cells were purified from fresh or cultured lymphocytes by a cell sorter (FACS Vantage; Becton Dickinson). These cells were used for the in vitro culture or cytotoxicity assay.
Cytotoxicity assay
Lytic activity was determined by a standard 4-h 51Cr-release assay [11]. Briefly, target K562 cells were labelled with 100 μCi Na251CrO4 for 60 min at 37°C in the RPMI 1640 medium and were washed three times with medium. Labelled target cells were incubated in a total volume of 200 ml with effector cells in the medium in a 96-well round-bottomed microtitre plate. The plates were centrifuged after incubation for 4 h, after which the supernatant was harvested and counted with a gamma counter. The cytotoxicity was calculated as the percentage of released counts after subtraction of spontaneous release. Spontaneous release was < 15% of the maximum release.
Statistical analysis
Data from peripheral blood were analysed using the Mann–Whitney U-test. In other cases, Student's t-test and the generalized Wilcoxon test were employed. P < 0.05 was considered to be significant.
RESULTS
Absence of CD56+ T and CD57+ T cells in cord blood of neonates
The surface phenotypes of MNC in cord blood were investigated by immunofluorescence tests. The results from a representative case are depicted (Fig. 1). Although a few CD56+ NK cells (i.e. CD3−) and CD16+ NK cells were present among the MNC, the populations of CD56+ T cells, CD57+ T cells, CD16+ T cells and γδ T cells were very small (< 0.6%). CD20+ B cells as well as CD5+ B cells were present in the cord blood, as is well established. CD4+ cells were much more dominant than CD8+ cells (CD4/CD8 ratio = 2.8). Reflecting the absence of NK T cells in the cord blood, DN CD4−CD8− cells were not present as estimated by two-colour staining for CD3 and a mixture of CD4 and CD8.
Fig. 1.
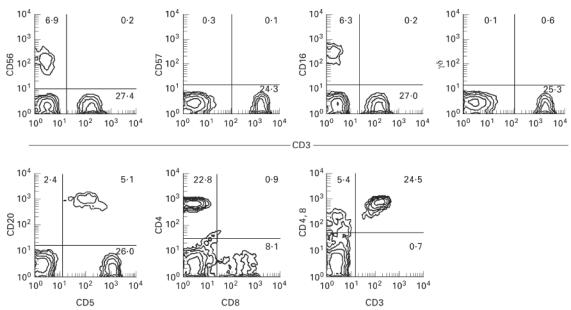
Absence of CD56+ T, CD57+ T, and CD16+ T cells in the cord blood of human neonates. Two-colour staining for CD3 and CD56, for CD3 and CD57, for CD3 and CD16, for CD3 and TCR-γδ, for CD5 and CD20, for CD8 and CD4, and for CD3 and a mixture of CD4 and CD8 were performed. Representative results of 22 cases are depicted. Numbers in the figure represent the percentages of fluorescence-positive cells in corresponding areas. Although CD56+ NK and CD16+ NK cells were present, neither CD56+ T, CD57+ T, nor CD16+ T cells were present in the cord blood. γδ T cells and double-negative CD4−8− cells were also absent.
To confirm the absence of NK T cells, the cord blood (CB) in 22 neonates was then examined (Fig. 2). The percentage of CD56+ T cells in whole T cells was 0.84 ± 0.63% and that of CD57+ T cells was 0.21 ± 0.34% (mean ± s.d.). It was noted that neither CD57+ T cells nor CD57+ NK cells were observed. The proportion of CD56+ NK cells was 6.9 ± 5.2%. γδ T cells were 2.3 ± 0.6% in whole T cells (not shown in the figure). Namely, αβ T cells were predominant in the CB. Although DN CD4−8− cells were present in the adult blood (8.6 ± 5.9%), they were a very small fraction in the CB (0.71 ± 0.52%) (not shown in the figure).
Fig. 2.
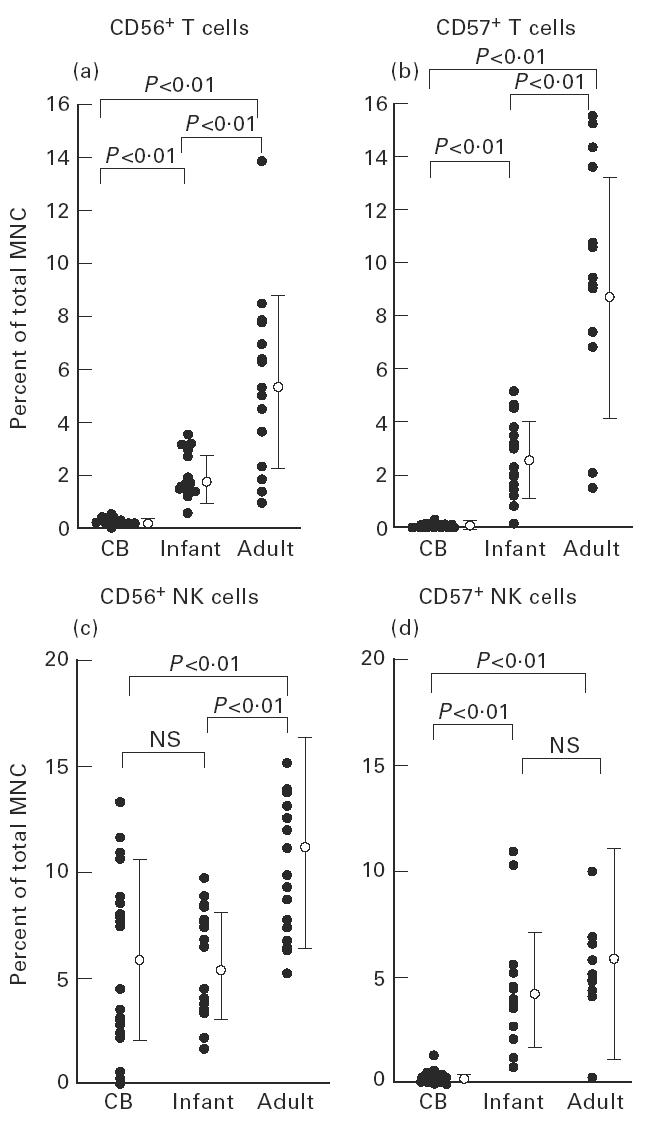
Increase in the proportion of CD56+ T and CD57+ T cells after birth as a function of age. Although CD56+ T and CD57+ T cells were absent in neonates, these populations increased with ageing. CD56+ NK cells, but not CD57+ NK cells, existed in the cord blood (CB) in the same proportion as that identified in the blood of infants.
Increase in the proportion of CD56+ T and CD57+ T cells with ageing
The surface phenotypes of blood MNC from healthy infants (n = 16) and adults (n = 16) were further examined (see again Fig. 2). The proportions of CD56+ T and CD57+ T cells increased with ageing. The level of CD56+ T cells in total MNC of infants was 2.0 ± 0.9%, while that of adults was 5.7 ± 3.3%. The level of CD57+ T cells in total MNC of infants was 2.7 ± 1.5%, while that of adults was 9.0 ± 4.6%. CD56+ NK cells existed in the CB in the same proportion as such cells in infants (6.9 ± 5.2 versus 5.8 ± 2.5%; NS), while there were no CD57+ NK cells in the cord blood, but such cells were substantial in infants and adults (0.3 ± 0.3%, 4.5 ± 2.7%, and 6.5 ± 4.9%, respectively; P < 0.01).
Expansion of CD56+ T cells in in vitro cultures with rIL-2
It was then examined what types of lymphocyte subsets in the CB were expanded in vitro in response to rIL-2 and rIL-12. MNC isolated from the CB were cultured with rIL-2 alone, and with a mixture of rIL-2 and rIL-12. A representative case is depicted in Fig. 3. After 14 days of culture, cells were analysed by two-colour staining for CD3 and CD56, that for CD3 and CD57, that for CD3 and TCR γδ, and that for TCR γδ and CD56. It was found that both CD56+ NK cells and CD56+ T cells expanded in the presence of rIL-2 (Fig. 3a). In this culture, the cell yields approximately doubled at 14 days. The expansion of CD56+ T cells was therefore estimated to be more than 10-fold in absolute number. The addition of rIL-12 with rIL-2 rather suppressed their expansion. In sharp contrast, neither CD57+ NK cells nor CD57+ T cells expanded under any culture conditions applied here. γδ T cells were also found to expand in the presence of rIL-2 alone (Fig. 3b). The expanding γδ T cells were CD56+-dominant.
Fig. 3.
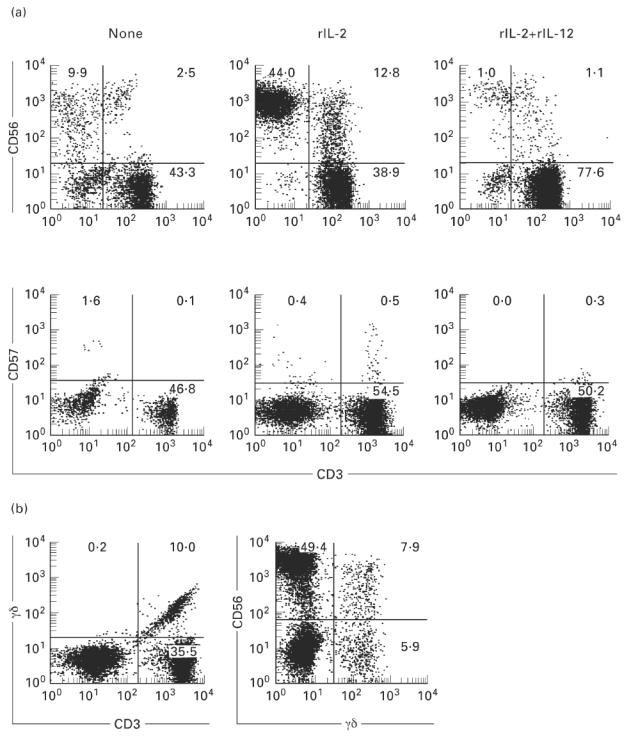
Expansion of CD56+ NK and CD56+ T cells in the culture with rIL-2. (a) Two-colour staining for CD3 and CD56 and for CD3 and CD57. (b) Two-colour staining for TCR γδ and CD3 and for CD56 and TCR γδ. Mononuclear cells (MNC) from the cord blood were cultured in the presence of rIL-2 and a mixture of rIL-2 and rIL-12 in a 24-well culture plate for 14 days. CD56+ NK and CD56+ T cells were induced from MNC of the cord blood by rIL-2, but rIL-12 rather suppressed their expansion.
This situation was confirmed by repeated experiments (Fig. 4). It was confirmed that the proportion of CD56+ T cells in total MNC increased in the rIL-2 culture (12.8 ± 5.0%; n = 9), but decreased in the rIL-2 and rIL-12 culture (1.1 ± 0.7%; n = 9) (Fig. 4a). The percentage of CD56+ T cells in total T cells induced by rIL-2 was 26.4 ± 10.4%, while that induced by rIL-2 and rIL-12 was only 1.5 ± 0.6%. The same tendency was observed in cultured CD56+ NK cells. The percentage of CD56+ NK cells cultured with rIL-2 was 44.0 ± 18.4%, while that cultured with rIL-2 and rIL-12 was only 1.0 ± 0.7% (Fig. 4b). CD57+ T cells were induced neither in the rIL-2 culture nor in the rIL-2 and rIL-12 culture (data not shown).
Fig. 4.
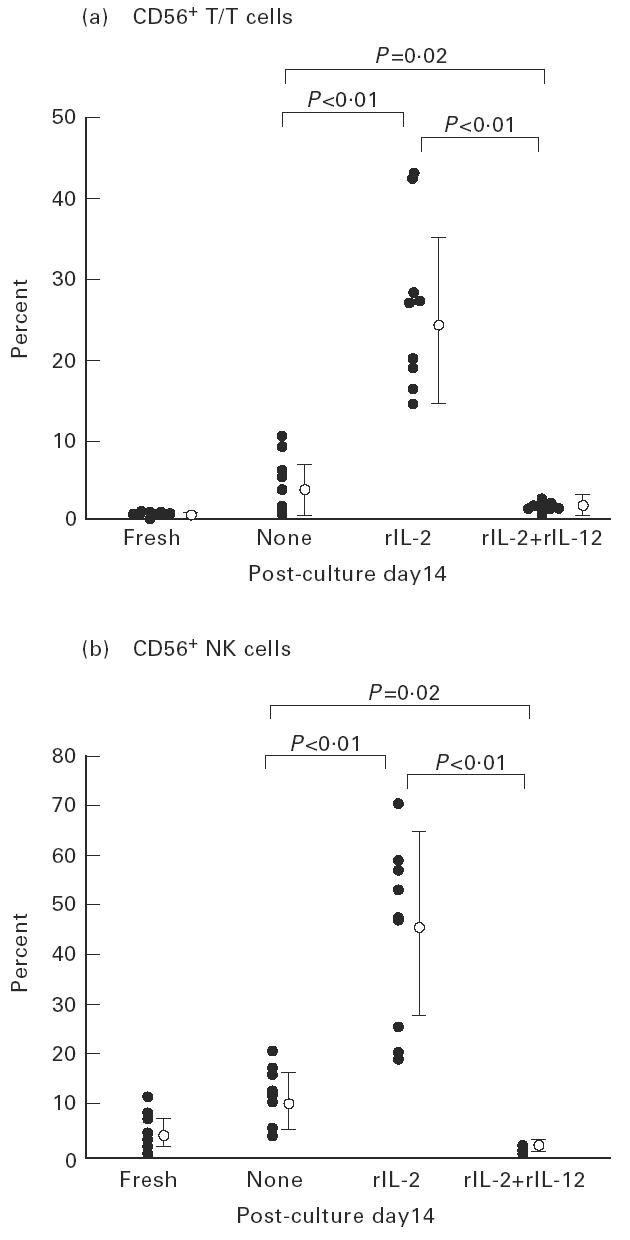
Only rIL-2 induced the expansion of CD56+ T cells by in vitro cultures. The percentage of CD56+ T cells among all T cells induced by rIL-2 was 26.4 ± 10.4% (n = 9). However, the addition of rIL-12 rather suppressed the expansion of CD56+ T cells and CD56+ NK cells.
It was then examined whether purified CD3−CD56− cells or CD3+CD56− cells gave rise to CD56+ T cells in the in vitro culture (Fig. 5). These cell fractions were purified from freshly isolated lymphocytes of the cord blood by a cell sorter. The cultures were performed for 14 days in the presence of rIL-2 (100 U/ml). CD3−CD56− cells gave rise to all lymphocyte subsets, including NK cells (predominant), CD3+CD56− T cells, and CD3+CD56+ T cells. Interestingly, CD3+CD56− cells also gave rise to CD3+CD56+ T cells.
Fig. 5.
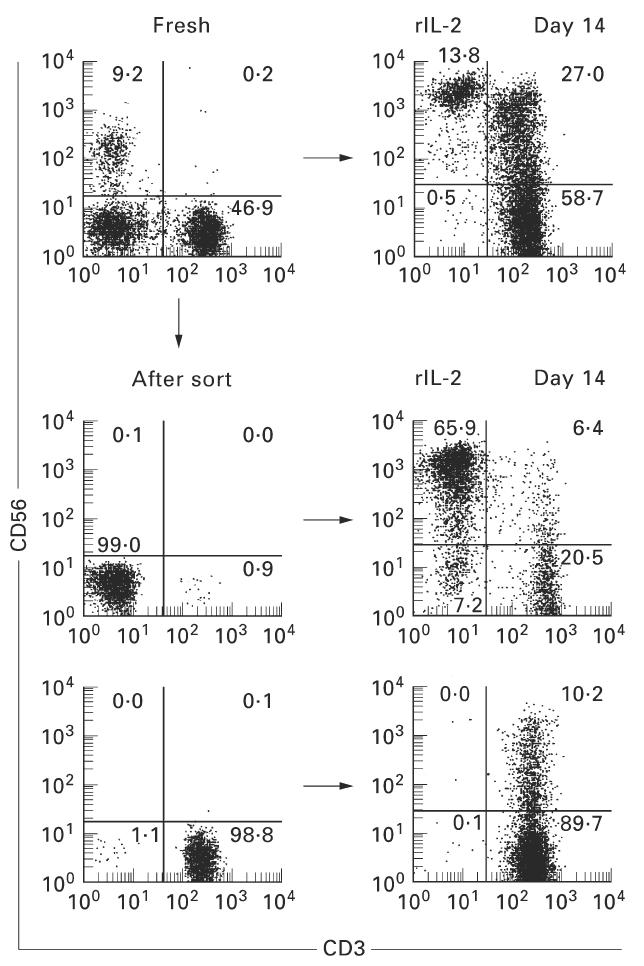
Generation of CD56+ T cells from purified CD3−CD56− cells and CD3+CD56− cells in the in vitro culture. To determine whether CD56+ T cells were generated from purified fractions of CD3−CD56− and CD3+CD56− cells, the in vitro culture was conducted for 14 days in the presence of rIL-2. Cell fractions were purified from freshly isolated lymphocytes of the cord blood by a cell sorter. A representative result of three experiments is depicted. Both fractions gave rise to CD56+ NK T cells.
Cytotoxic activity against K562 cells was enhanced through in vitro culture with rIL-2
A cytotoxic assay against K562 target was performed to determine the effect of rIL-2 on the cytotoxic activity of cultured lymphocytes (Fig. 6). Cells were used 2 weeks after incubation with rIL-2 (100 U/ml). It was found that cytotoxic activity was greatly enhanced in whole lymphocytes after the culture. Sorting experiments showed that CD3+CD56+ cells (i.e. NK T cells) as well as CD3−CD56+ cells (i.e. NK cells) mediated such cytotoxicity.
Fig. 6.
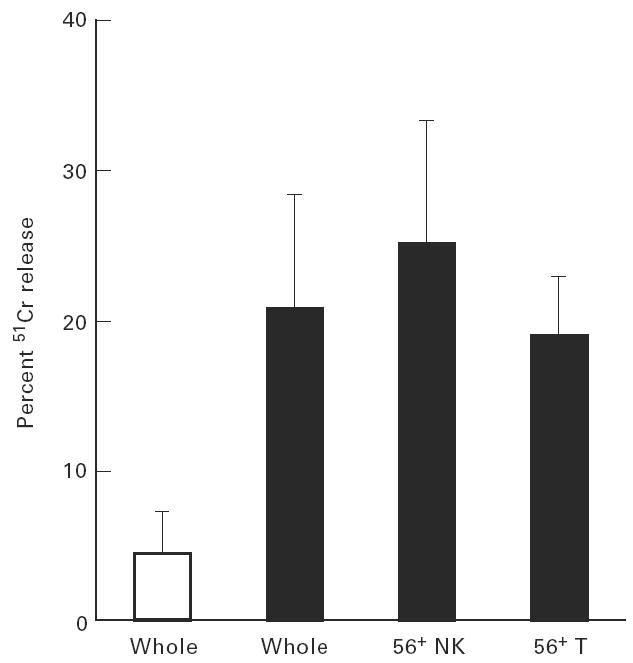
Cytotoxic activity against K562 was enhanced in the culture with rIL-2. Cytotoxicities of fresh lymphocytes (□) and lymphocytes cultured with rIL-2 for 14 days (▪) were determined by a 51Cr-release assay. CD3−CD56+ NK cells and CD56+ T cells were purified from cultured lymphocytes by a cell sorter. K562 cells were used as targets. NK T cells as well as NK cells could mediate the cytotoxicity.
The expansion of γδ T cells induced by rIL-2 and their predominance in CD56+ T cells
Further phenotypical characterization of the γδ T cells induced by rIL-2 revealed Vγ9− cells to be predominant in γδ T cells of the CB (89.4 ± 4.4%, n = 6) (Fig. 7). In contrast to γδ T cells cultured in rIL-2, almost all γδ T cells in the blood of adults (n = 8) were Vγ9+ (i.e. adult type).
Fig. 7.
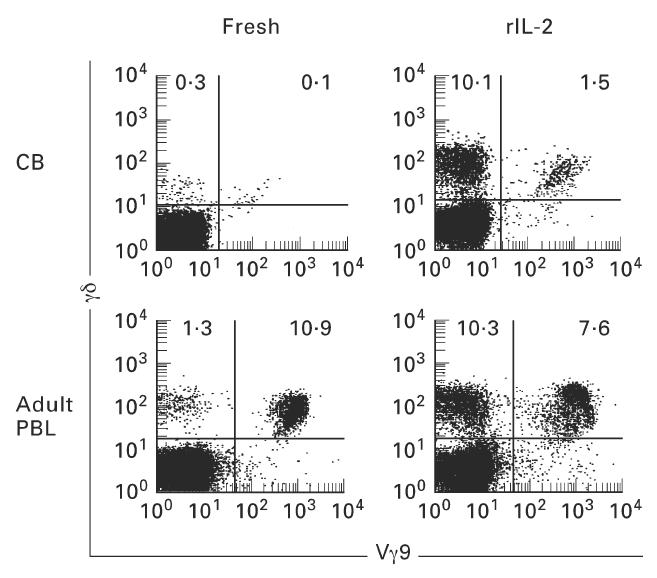
Effector to target ratio was 20:1 and mean and one s.d. of three experiments are depicted. Expansion of TCR γδ+ (Vγ9−) cells when cord blood mononuclear cells (MNC) were cultured in rIL-2. Two-colour staining for TCR γδ and Vγ9 was performed. Numbers in the figure represent the percentage of fluorescence-positive cells in corresponding areas. After 14 days of culture in the presence of rIL-2, TCR γδ+ (Vγ9−) cells were found to increase greatly in number and proportion. On the other hand, most TCR γδ+ cells were Vγ9+ in the cultures of adult blood MNC.
This situation was confirmed by repeated experiments (Fig. 8). The induction level of γδ T cells in the presence of rIL-2 was first compared between the CB and adult blood. The induction of γδ T cells was much more prominent in the CB than in adult blood. As shown in the bottom of Fig. 8, Vγ9− cells were dominant in the CB while Vγ9+ cells were dominant in the adult blood.
Fig. 8.
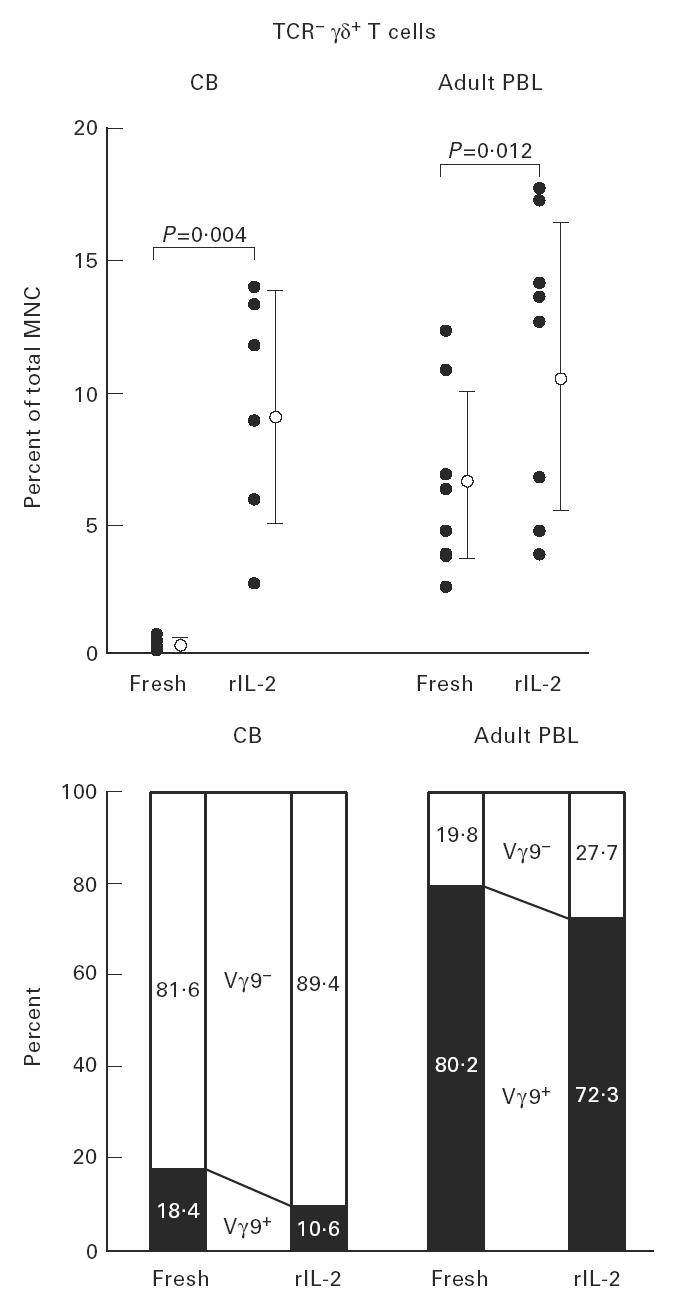
Expansion of TCR γδ cells with the phenotype of Vγ9− in the repeated experiments. In both cord blood (CB) mononuclear cells (MNC) and adult blood MNC, TCR γδ cells were induced in the culture with rIL-2. At this time, Vγ9− cells were 89.4 ± 4.4% in induced γδ T cells in the case of CB. This result was striking when compared with that for adult blood (n = 8).
The proportion of γδ T cells in fresh CB was only 2.3 ± 0.6% (Fig. 9). By rIL-2 stimulation, the proportion of γδ T cells increased remarkably (27.6 ± 14.0%). γδ T cells were predominant (59.7 ± 19.8%) among CD56+ T cells, but not predominant (22.4 ± 18.9%) among CD56− T cells (i.e. conventional T cells).
Fig. 9.
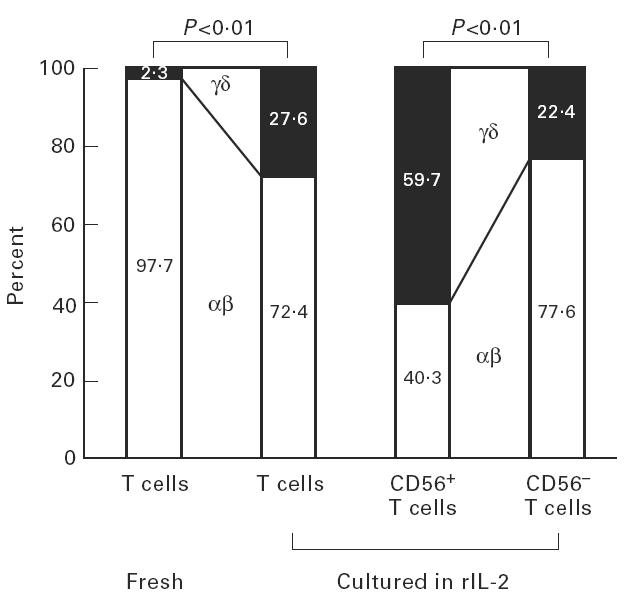
Expression of CD56 antigens of γδ T cells induced in the culture of rIL-2. Approximately 60% of CD56+ T cells, but only 20% of CD56− T cells (i.e. conventional T cells), comprised γδ T cells (n = 5).
Selective induction of Vα24+ cells into CD56+ T cells from the CB
In the case of NK T cells in mice, an invariant Vα14 chain was preferentially used for TCR αβ. A human counterpart of such Vα14 was estimated to be Vα24 [25–27]. In this regard, the expression level of Vα24 in various cell fractions was examined in the CB and adult blood (Fig. 10). Three-colour staining for CD3, CD56, and Vα24 was conducted and the expression of Vα24 was estimated by gated analysis of CD3−CD56+ (R1), CD3+CD56+ (R2), and CD3+CD56− (R3) cells. A significant proportion of Vα24+ cells (22.3%) was found only in cultured cells from the CB. Although CD56+ T cells (R2) were predominant with or without the in vitro culture for adult blood cells, the level of Vα24+ cells among these CD56+ T cells was not so high. Representative results of three experiments are depicted.
Fig. 10.
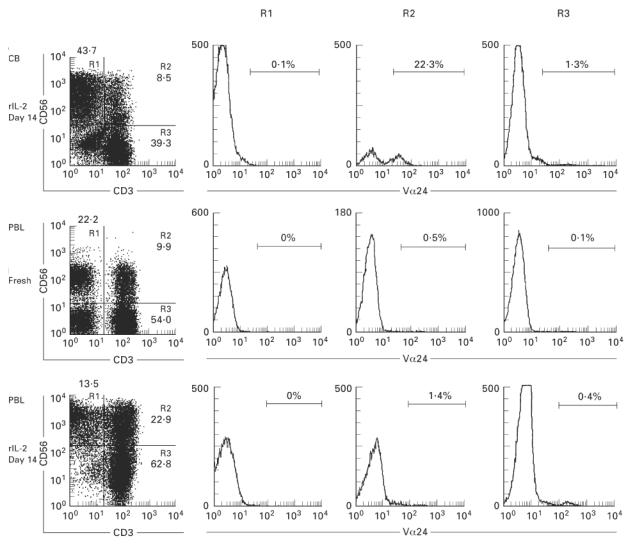
Usage of Vα24 by CD56+ T cells induced in the culture of rIL-2. Three-colour staining for CD3, CD56 and Vα24 was conducted in mononuclear cells (MNC) cultured in presence of rIL-2 for 14 days. The gated analysis of CD56+ NK cells (R1), CD56+ T (R2), and CD3+CD56− T (R3) cells was performed to determine the expression of Vα24.
DISCUSSION
In the present study, we investigated how human NK T cells were present in the peripheral blood of neonates and how such NK T cells expanded with ageing. It was demonstrated that NK T cells, including both CD56+ T and CD57+ T cells, were almost absent in the CB and that they appeared in the blood of infants. Although the proportion of such NK T cells was still very low in infancy, it increased thereafter with ageing. All of these age-associated changes of human NK T cells are quite similar to the age-associated changes of TCRint cells or NK T cells (i.e. extrathymic T cells) in mice [28]. However, the present study also revealed that CD56+ T cells, but not CD57+ T cells, expanded in the in vitro cultures in the presence of rIL-2. It was also found that both purified CD3−CD56− and CD3+CD56− cells gave rise to CD56+ T cells. This result suggests the possibility that CD56+ T cells are generated by a route of CD3−CD56−→CD3+CD56−→CD3+CD56+. It is concluded that mature NK T cells are almost absent but that their precursor cells (both CD3+ and CD3− cells) are circulating in the peripheral blood of neonates.
In previous studies, human NK cells, including both CD56+CD3− and CD57+CD3− cells, were found to increase with ageing [29,30]. However, CD56+ NK cells are already present at birth, while CD57+ NK cells are absent at this stage. In the case of NK T cells, it was found that both CD56+ T and CD57+ T cells are almost absent at birth. In other words, NK T cells appeared at later stages in ontogeny. Considering that the properties of NK cells (e.g. the morphology of typical large granular lymphocytes and the absence of TCR–CD3 complex on the surface) are much more primitive than those of NK T cells, this speculation seems to be reasonable.
In a preliminary study, we applied several cytokines (i.e. IL-2, IL- 3, IL-7 and colony-stimulating factor (CSF)) to induce murine NK T cells in in vitro cultures [31]. Some NK T cells were induced from liver NK T− liver MNC in the presence of IL-7. In the case of humans, a prominent expansion of CD56+ T and CD57+ T cells succeeded only in the presence of rIL-2. IL-12 is known to induce the functional maturation of NK and NK T cells, as shown by murine studies [23,24]. In this regard, we used rIL-12 and a mixture of rIL-2 and rIL-12 for the induction of human NK T cells in in vitro cultures. It was found that rIL-12 did not induce CD56+ T and CD57+ T cells and that they rather suppressed the induction of such NK T cells which were induced by rIL-2. The suppressive effect of IL-12 on the induction of human NK T cells was very interesting, although the underlying mechanisms are still unknown. It was confirmed that NK T cells induced in vitro actually mediated the NK-like cytotoxicity against K562 targets.
In earlier studies [32–36] it was reported that IL-12 can stimulate interferon-gamma (IFN-γ) production by NK cells, initiating Th1 responses that might be expected to inhibit the generation of Th2 responses. However, recent studies revealed that IL-12 sometimes initiates Th2 responses in certain situations [37,38]. The present observation that IL-12 was able to antagonize the generation of human NK T cells would be consistent with a role of IL-12 as an initiator of Th2 responses.
As shown in a previous study, γδ T cells are rarely seen in human thymocytes [13]. Therefore, it is speculated that γδ T cells which appear in the peripheral blood are of extrathymic origin. Indeed, such γδ T cells were induced in in vitro cultures, in parallel with the induction of CD56+ T cells. It was found that γδ T cells were much more dominant in CD56+ T cells than CD56− T cells. Since γδ T cells were almost completely absent in freshly isolated CB, all of these γδ T cells arose after the culture, of extrathymic origin. The majority of such γδ T cells lacked the usage of Vγ9, i.e. they were non-adult type.
In a series of recent studies, NK T cells in mice preferentially used an invariant chain of Vα14 gene product for TCR αβ [25,26]. Similarly, some T cells in humans use Vα24 chain for TCR αβ which is equivalent to murine Vα14 [27]. It was found that Vα24 chain was preferentially used by CD56+ T cells, i.e. human NK T cells.
Finally, we emphasize that mature NK T cells are almost absent in the peripheral blood of neonates but are inducible from their precursors in in vitro cultures. These results are in good agreement with the recent evidence for the presence of pluripotent stem cells in the umbilical cord blood [15–17]. It is conceivable that microenvironments for the maturation of NK T cells are not yet intact at birth. However, many precursor cells of NK T cells are already circulating, waiting to mature. We previously demonstrated that CD56+ T cells are abundant in the liver and they are probably mainly generated in the liver; we also found that CD57+ T cells are abundant in the bone marrow and they are mainly generated in this organ [14]. Therefore, the present result, that only CD56+ T cells were induced from the CB, suggests that their precursor cells might be of hepatic origin. In other words, the NK T precursor cells of hepatic origin appeared earlier in the CB than those of bone marrow origin. In the case of mice, NK T cells of both hepatic and bone marrow origin were absent at birth and both of them appeared equally in adulthood (as early as 1 week after birth) [39,40]. It is concluded that both murine and human NK T cells are almost absent at birth and then increase as a function of age. Therefore, the microenvironments necessary for the maturation of their precursors would exist only after birth.
Acknowledgments
This study was supported by a grant-in-aid for Scientific Research from the Ministry of Education, Science and Culture, Japan. The authors wish to thank Mrs Yuko Kaneko for manuscript preparation and Mr Tetsuo Hashimoto for animal maintenance.
REFERENCES
- 1.Ohteki T, Seki S, Abo T, Kumagai K. Liver is a possible site for the proliferation of abnormal CD3+4−8− double-negative lymphocytes in autoimmune MRL-lpr/lpr mice. J Exp Med. 1990;172:7–12. doi: 10.1084/jem.172.1.7. [DOI] [PMC free article] [PubMed] [Google Scholar]
- 2.Abo T, Ohteki T, Seki S, Koyamada N, Yoshikai Y, Masuda T, Rikiishi H, Kumagai K. The appearance of T cells bearing self-reactive T cell receptor in the livers of mice injected with bacteria. J Exp Med. 1991;174:417–24. doi: 10.1084/jem.174.2.417. [DOI] [PMC free article] [PubMed] [Google Scholar]
- 3.Seki S, Abo T, Ohteki T, Sugiura K, Kumagai K. Unusual (αβ-T cells expanded in autoimmune lpr mice are probably a counterpart of normal T cells in the liver. J Immunol. 1991;147:1214–21. [PubMed] [Google Scholar]
- 4.Kawachi Y, Watanabe H, Moroda T, Haga M, Iiai T, Hatakeyama K, Abo T. Self-reactive T cell clones in a restricted population of IL-2 receptor β+ cells expressing intermediate levels of the T cell receptor in the liver and other immune organs. Eur J Immunol. 1995;25:2272–8. doi: 10.1002/eji.1830250824. [DOI] [PubMed] [Google Scholar]
- 5.Sato K, Ohtsuka K, Hasegawa K, et al. Evidence for extrathymic generation of intermediate TCR cells in the liver revealed in thymectomized, irradiated mice subjected to bone marrow transplantation. J Exp Med. 1995;182:759–67. doi: 10.1084/jem.182.3.759. [DOI] [PMC free article] [PubMed] [Google Scholar]
- 6.Watanabe H, Miyaji C, Kawachi Y, Iiai T, Ohtsuka K, Iwanaga T, Takahashi-Iwanaga H, Abo T. Relationships between intermediate TCR cells and NK1.1+ T cells in various immune organs. NK1.1+ T cells are present within a population of intermediate TCR cells. J Immunol. 1996;155:2972–83. [PubMed] [Google Scholar]
- 7.Ferguson A, Parrott DM. The effect of antigen deprivation on thymus-dependent and thymus-independent lymphocytes in the small intestine of the mouse. Clin Exp Immunol. 1972;12:477–88. [PMC free article] [PubMed] [Google Scholar]
- 8.Mosley RL, Styre D, Klein JR. Differentiation and functional maturation of bone marrow-derived intestinal epithelial T cells expressing membrane T cell receptor in athymic radiation chimeras. J Immunol. 1990;145:1369–75. [PubMed] [Google Scholar]
- 9.Bandeira A, Itohara S, Bonneville M, Burlen-Defranoux O, Mota-Santos T, Coutinho A, Tonegawa S. Extrathymic origin of intestinal intraepithelial lymphocytes bearing T-cell antigen receptor gamma delta. Proc Natl Acad Sci USA. 1991;88:43–47. doi: 10.1073/pnas.88.1.43. [DOI] [PMC free article] [PubMed] [Google Scholar]
- 10.Rocha B, Vassalli P, Guy-Grand D. The Vβ repertoire of mouse gut homodimeric α CD8+ intraepithelial T cell receptor α/β+ lymphocytes reveals a major extrathymic pathway of T cell differentiation. J Exp Med. 1991;173:483–6. doi: 10.1084/jem.173.2.483. [DOI] [PMC free article] [PubMed] [Google Scholar]
- 11.Kawamura T, Kawachi Y, Moroda T, Weerashinghe A, Iiai T, Seki S, Takada G, Abo T. Cytotoxic activity against tumour cells mediated by intermediate TCR cells in the liver and spleen. Immunology. 1996;89:68–75. doi: 10.1046/j.1365-2567.1996.d01-719.x. [DOI] [PMC free article] [PubMed] [Google Scholar]
- 12.Moroda T, Iiai T, Suzuki S, et al. Autologous killing by a population of intermediate TCR cells and its NK1.1+ and NK1.1− subsets, using Fas ligand/Fas molecules. Immunology. 1997;91:219–26. doi: 10.1046/j.1365-2567.1997.00240.x. [DOI] [PMC free article] [PubMed] [Google Scholar]
- 13.Takii Y, Hashimoto S, Iiai T, Watanabe H, Hatakeyama K, Abo T. Increase in the proportion of granulated CD56+ T cells in patients with malignancy. Clin Exp Immunol. 1994;97:522–7. doi: 10.1111/j.1365-2249.1994.tb06120.x. [DOI] [PMC free article] [PubMed] [Google Scholar]
- 14.Okada T, Iiai T, Kawachi Y, Moroda T, Takii Y, Hatakeyama K, Abo T. Origin of CD57+ T cells which increase at tumour sites in patients with colorectal cancer. Clin Exp Immunol. 1995;102:159–66. doi: 10.1111/j.1365-2249.1995.tb06650.x. [DOI] [PMC free article] [PubMed] [Google Scholar]
- 15.Stone R. Banking on umbilical cords. Science. 1992;257:615–6. [Google Scholar]
- 16.Wagner JE, Kernan NA, Steinbuch M, Broxmeyer HE, Glucknan E. Allogeneic sibling umbilical-cord-blood transplantation in children with malignant and non-malignant disease. Lancet. 1995;346:214–9. doi: 10.1016/s0140-6736(95)91268-1. [DOI] [PubMed] [Google Scholar]
- 17.Nishihira H, Toyoda Y, Miyazaki H, Kigasawa H, Ohsaki E. Growth of macroscopic human megakaryocyte colonies from cord blood in culture with recombinant human thrombopoietin (c-mpl ligand) and the effects of gestational age on frequency of colonies. Br J Haematol. 1996;92:23–28. doi: 10.1046/j.1365-2141.1996.00287.x. [DOI] [PubMed] [Google Scholar]
- 18.Wagner JE, Rosenthal J, Sweetman R, et al. Successful transplantation of HLA-matched and HLA-mismatched umbilical cord blood from unrelated donors: analysis of engraftment and acute graft-versus-host disease. Blood. 1996;88:795–802. [PubMed] [Google Scholar]
- 19.Gluckman E, Broxmeyer H, Auerbach AD, et al. Hematopoietic reconstitution in a patient with Fanconi's anemia by means of umbilical-cord blood from an HLA-identical sibling. New Eng J Med. 1989;321:1174–8. doi: 10.1056/NEJM198910263211707. [DOI] [PubMed] [Google Scholar]
- 20.Amos TA, Gordon MY. Sources of human hematopoietic stem cells for transplantation—a review. Cell Transplantation. 1995;4:547–69. doi: 10.1177/096368979500400605. [DOI] [PubMed] [Google Scholar]
- 21.Henney CS, Kuribayashi K, Kern DE, Gillis S. Interleukin-2 augments natural killer cell activity. Nature. 1981;291:335–8. doi: 10.1038/291335a0. [DOI] [PubMed] [Google Scholar]
- 22.Phillips JH, Lanier LL. Dissection of the lymphokine- activated killer phenomenon: relative contribution of peripheral blood natural killer cells and T lymphocytes to cytolysis. J Exp Med. 1986;164:814–25. doi: 10.1084/jem.164.3.814. [DOI] [PMC free article] [PubMed] [Google Scholar]
- 23.Kobayashi M, Fitz L, Ryan M, et al. Identification and purification of natural killer cell stimulatory factor (NKSF), a cytokine with multiple biologic effects on human lymphocytes. J Exp Med. 1989;170:827–45. doi: 10.1084/jem.170.3.827. [DOI] [PMC free article] [PubMed] [Google Scholar]
- 24.Gately MK, Desai BB, Wolitzky AG, et al. Regulation of human lymphocyte proliferation by a heterodimeric cytokine, IL-12 (cytotoxic lymphocyte maturation factor) J Immunol. 1991;147:874–82. [PubMed] [Google Scholar]
- 25.Adachi Y, Koseki H, Zijlstra M, Taniguchi M. Positive selection of invariant Vα14+ T cells by non-major histocompatibility complex-encoded class I-like molecules expressed on bone marrow-derived cells. Proc Natl Acad Sci USA. 1995;92:1200–4. doi: 10.1073/pnas.92.4.1200. [DOI] [PMC free article] [PubMed] [Google Scholar]
- 26.Makino Y, Kanno R, Ito T, Higashino K, Taniguchi M. Predominant expression of invariant Vα14+ TCR α chain in NK1.1+ T cell populations. Int Immunol. 1995;7:1157–61. doi: 10.1093/intimm/7.7.1157. [DOI] [PubMed] [Google Scholar]
- 27.Lantz O, Bendelac A. An invariant T cell receptor α chain is used by a unique subset of major histocompatibility complex class I-specific CD4+ and CD4−8− T cells in mice and humans. J Exp Med. 1994;180:1097–106. doi: 10.1084/jem.180.3.1097. [DOI] [PMC free article] [PubMed] [Google Scholar]
- 28.Tsukahara A, Seki S, Iiai T, et al. Mouse liver T cells: their change with aging and in comparison with peripheral T cells. Hepatology. 1997;26:301–9. doi: 10.1002/hep.510260208. [DOI] [PubMed] [Google Scholar]
- 29.Abo T, Cooper MD, Balch CM. Postnatal expansion of the natural killer and killer cell population in humans identified by the monoclonal HNK-1 antibody. J Exp Med. 1982;155:321–6. doi: 10.1084/jem.155.1.321. [DOI] [PMC free article] [PubMed] [Google Scholar]
- 30.Tilden AB, Grossi CE, Itoh K, Cloud GA, Dougherty PA, Balch CM. Subpopulation analysis of human granular lymphocytes: associations with age, gender and cytotoxic activity. Natural Immunity Cell Growth Regulation. 1986;5:90–99. [PubMed] [Google Scholar]
- 31.Miyaji C, Watanabe H, Osuman Y, Kuwano Y, Abo T. A comparison of proliferative response to IL-7 and expression of IL-7 receptors in intermediate TCR cells of the liver, spleen, and thymus. Cell Immunol. 1996;169:159–65. doi: 10.1006/cimm.1996.0106. [DOI] [PubMed] [Google Scholar]
- 32.Hsieh C-S, Macatonia SE, Tripp CS, Wolf SF, O'Garra A, Murphy KM. Development of TH1 CD4+ T cells through IL-12 produced by Listeria-induced macrophages. Science. 1993;260:547–9. doi: 10.1126/science.8097338. [DOI] [PubMed] [Google Scholar]
- 33.Seder RA, Gazzinelli R, Sher A, Paul WE. IL-12 acts directly on CD4+ T cells to enhance priming for IFN-γ production and diminishes IL-4 inhibition of such priming. Proc Natl Acad Sci USA. 1993;90:10188–92. doi: 10.1073/pnas.90.21.10188. [DOI] [PMC free article] [PubMed] [Google Scholar]
- 34.Manetti R, Parronchi P, Giudizi MG, Piccinni MP, Maggi E, Trinchieri G, Romagnani S. Natural killer cell stimulatory factor (interleukin 12 [IL-12]) induces T helper type 1 (Th1)-specific immune responses and inhibits the development of IL-4-producing Th cells. J Exp Med. 1993;177:1199–204. doi: 10.1084/jem.177.4.1199. [DOI] [PMC free article] [PubMed] [Google Scholar]
- 35.Stern AS, Podlaski FJ, Hulmes JD, et al. Purification to homogeneity and partial characterization of cytotoxic lymphocyte maturation factor from human B-lymphoblastoid cells. Proc Natl Acad Sci USA. 1990;87:6808–12. doi: 10.1073/pnas.87.17.6808. [DOI] [PMC free article] [PubMed] [Google Scholar]
- 36.Gately MK, Desai BB, Wolitzky AG, et al. Regulation of human lymphocyte proliferation by a heterodimeric cytokine, IL-12 (cytotoxic lymphocyte maturation factor) J Immunol. 1991;147:874–82. [PubMed] [Google Scholar]
- 37.Wynn TA, Jankovic D, Hieny S, Zioncheck K, Jardieu P, Cheever AW, Sher A. IL-12 exacerbates rather than suppresses T helper 2-dependent pathology in the absence of endogenous IFN-γ. J Immunol. 1995;154:3999–4009. [PubMed] [Google Scholar]
- 38.Jeannin P, Delneste Y, Life P, Gauchat J-F, Kaiserlian D, Bonnefoy J-Y. Interleukin-12 increases interleukin-4 production by established human Th0 and Th2-like T cell clones. Eur J Immunol. 1995;25:2247–52. doi: 10.1002/eji.1830250820. [DOI] [PubMed] [Google Scholar]
- 39.Iiai T, Watanabe H, Seki S, et al. Ontogeny and development of extrathymic T cells in mouse liver. Immunology. 1992;77:556–63. [PMC free article] [PubMed] [Google Scholar]
- 40.Ohtsuka K, Hasegawa K, Sato K, Arai K, Watanabe H, Asakura H, Abo T. A similar expression pattern of adhesion molecules between intermediate TCR cells in the liver and intraepithelial lymphocytes in the intestine. Microbiol Immunol. 1994;38:677–83. doi: 10.1111/j.1348-0421.1994.tb01840.x. [DOI] [PubMed] [Google Scholar]


