

Abstract
The proinflammatory cytokines play a central role in mediating cellular and physiological responses, and levels may reflect immune system effectiveness. In this study, the effect of ageing on the inflammatory response was examined using a novel method to detect production of the proinflammatory cytokines, i.e. tumour necrosis factor-alpha (TNF-α), IL-6 and IL-1β. Peripheral blood mononuclear cells (PBMC) obtained from healthy donors of different ages were incubated for 0, 24, 48 and 72 h with or without phorbol 12-myristate 13-acetate (PMA) stimulation. At each time point these cells were permeabilized and incubated with secondary conjugated FITC MoAbs specific for each cytokine. A flow cytometric system was developed to quantify specific intracellular fluorescence in T cells (CD3+) and monocytes (CD14+). TNF-α, IL-6 and IL-1β production in cell culture supernatants was also measured using ELISAs. In older subjects, flow cytometry detected significant increases in intracellular T cell TNF-α and IL-6 (P < 0.05). IL-1β was not detected in any of the T cell samples. Likewise, the monocytes of older subjects demonstrated increased intracellular levels of all three cytokines, but these increases were not significant (P > 0.05). These changes in intracellular proinflammatory cytokine levels may explain some of the exaggerated inflammatory responses seen in elderly patients.
Keywords: tumour necrosis factor-alpha, IL-6, IL-1β, flow cytometry, immunosenescence
INTRODUCTION
The outcome of infection in old age may be more severe than in younger subjects, and this may be related to dysregulation of the immune system in the elderly [1]. The proinflammatory cytokines play a pivotal role in the immune response, including cellular activation and proliferation [2–4], and are also involved in the pyrogenic and acute-phase responses [5,6]. Due to their pleiotrophic functions, these cytokines may be useful markers of immune competence.
Studies examining alterations in proinflammatory cytokine production with age are contradictory. Both an increase and no change in proinflammatory cytokine production between different age groups have been reported [7–10]. This discrepancy may reflect problems regarding the methodology used in cytokine detection. Several difficulties inherent to ELISAs, RIAs and bioassays [11] used for cytokine assays may be due to the presence of naturally occurring biological inhibitors which interfere with the detection of the respective cytokine. Furthermore, many of the methods employed in the quantification of cytokine levels in body fluids and culture supernatants do not allow identification of the cytokine-producing cell type, without prior separation of the different subpopulations.
Intracellular cytokine detection, using flow cytometry, avoids the influence of the extracellular milieu, and MoAbs to cell surface markers (such as CD3 and CD14) can be used to identify the cellular origin of cytokine production. Qualitative intracellular proinflammatory cytokine methods have been previously reported [12–15] and these studies examined the percentage of cytokine-producing cells. However, the amount of cytokine being produced per cellular population (median fluorescence intensity (MFI)) may be more informative. Earlier studies also used artificial inhibitors of cytokine export such as monensin and brefeldin A. This results in accumulation of intracellular cytokine levels, thus facilitating detection. However, this methodology does not allow quantification of intracellular cytokine levels, as the amount of cytokine present has been artificially amplified. We report here a method which quantifies intracellular proinflammatory cytokines in peripheral blood mononuclear cell (PBMC) subpopulations in the absence of cell export inhibitors. Using this technique, increases in tumour necrosis factor-alpha (TNF-α) and IL-6 were observed in T cells isolated from a normal elderly population.
MATERIALS AND METHODS
Subjects were interviewed concerning their current medical status, medications and previous medical history. The criteria used to define a healthy individual excluded persons who were taking immunosuppressive medications, persons with inflammatory disorders or infections, or those who had suffered serious trauma (e.g. surgery) within the previous 6 months. No persons who had experienced unexplained weight loss or any kind of malignancy were included. A total of 19 normal healthy volunteers were accepted into the study and informed consent was obtained from each individual. These volunteers were divided into two groups, 20–40 years (mean age 29 years, n = 10), and > 62 years (mean age 73 years, n = 9).
Blood was collected into sterile EDTA bottles, placed on ice, and the PBMC were immediately separated using Lymphoprep (Nycomed, Oslo, Norway). Cell number and viability were determined using ethidium bromide/acridine orange staining and PBMC were resuspended at a final concentration of 1 × 10⁶ cells/ml. One millilitre aliquots, in RPMI 1640, containing 2 mm glutamine, 50 U/ml penicillin, 50 μg/ml streptomycin, 2.5 μg/ml fungizone and 10% heat-inactivated autologous serum, were added to 24-well microtitre plates (Nunclon). PBMC were stained for cytokine levels at 0, 24, 48 and 72 h in culture, with or without 25 ng/ml phorbol 12-myristate 13-acetate (PMA; Sigma) stimulation. All cultures were incubated at 37°C in a humidified atmosphere of 5% CO2.
Panels of MoAbs for TNF-α (nine antibodies), IL-6 (nine antibodies) and IL-1β (three antibodies) were obtained from R&D Systems (Minneapolis, MN) and one IL-1β antibody was obtained from Immunotech (Marseille, France). These were screened for their usefulness in flow cytometry. Access to the intracellular space was achieved by first fixing the cell membrane with 2% paraformaldehyde (PFA) followed by 0.05% saponin (Sigma) permeabilization. Non-specific binding sites were blocked by incubating the permeabilized cells with 10% normal human serum (NHS)/saponin. MoAbs, at 0.2 μg/test, were added to 5 × 10⁴ cells in 100 μl 10% NHS/saponin, as were similar concentrations of the irrelevant isotype-matched control IgG antibodies (Dako, Glostrup, Denmark). Anti-vimentin antibodies (Dako) were also used to demonstrate cell permeability. FITC-labelled Fab goat anti-mouse MoAbs (2.0 μg/test; Dako) were used to label the primary antibodies. Cells were finally fixed with 0.5% PFA and intracellular fluorescence measured using a Becton Dickinson flow cytometer with Lysis II software. Cell types were selected for on the basis of cell size (FSC) and cell granularity (SSC), Fig. 1, after which dual staining of representative samples with cell surface MoAbs CD3 (T cells) and CD14 (monocytes) was performed (data not shown). Histograms were then generated using the T cell or monocyte region which allowed measurement of intracellular cytokine levels using MFI.
Fig. 1.
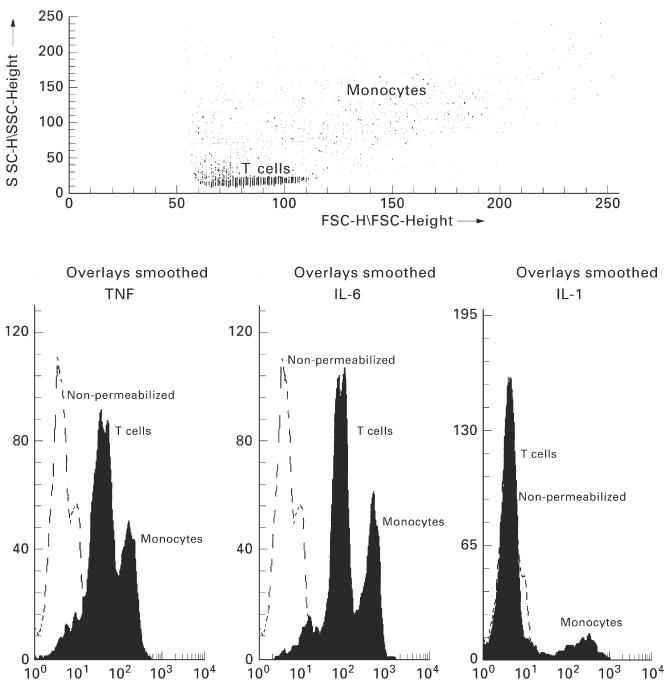
Dot plots and histograms representing intracellular cytokine levels in T cells and monocytes. The distinct T cell and monocyte populations can be gated in the dot plot using cell size (FSC) versus cell granularity (SSC). This method of cell identification was confirmed using cell surface CD3 (80–85% positive) or CD14 antibodies (70–80% positive). Using the histograms, intracellular fluorescence can be measured. The ordinate relates to the relevant cell number, while fluorescence intensity can be seen on the abscissa, representing the amount of intracellular cytokine. A shift to the right demonstrates an increase in the amount of cytokine within a cell. Peaks can be observed for non-permeabilized cells, T cells and monocytes. Specific intracellular fluorescence levels can be quantified from these histograms for each of the cell types.
Time course studies were performed with two individuals, in order to examine the correlation between intracellular (MFI) and extracellular (ELISA) cytokine levels. Both measurements were simultaneously made at 0, 3, 6, 9, 12, 24, 48 and 72 h in culture. The effect of export inhibitors on intracellular cytokine measurements was examined by adding 10 μg/ml brefeldin A (Sigma) to the culture supernatants 4 h prior to staining.
When the protocol was finalized, culture supernatants were collected from PMA-stimulated cultures and analysed in duplicate using ELISA kits for IL-6, TNF-α and IL-1β (R&D). Age-related differences in extracellular cytokine production were only examined after 72 h.
The two age groups were compared using unpaired Student's t-tests and one- and two-way anova for comparison of cytokine production with time.
RESULTS
Intracellular TNF-α and IL-6 were detected in both T cells and monocytes, wereas IL-1β was detected in monocytes alone. Cytokines were only detected in the saponin permeabilized samples (Fig. 1). From the panel of antibodies that were examined for their ability to stain cytokines intracellularly (using flow cytometry) the most suitable for TNF-α (6402.31; R&D), IL-6 (1927.311; R&D) and IL-1β (beta 36; Immunotech) were chosen. With these antibodies staining did not increase with the addition of exogenous cytokine (results not shown), suggesting that the signal detected was due solely to intracellular cytokine. In further experiments antibody specificity was confirmed, since the TNF-α antibody was blocked by the addition of TNF-α (> 85% inhibition), but not by IL-6. Similarly, only addition of IL-6, but not TNF-α, blocked the signal due to the IL-6 antibody (> 85% inhibition). Intracellular cytokine stainings for the first four individuals were repeated six times and the coefficient of variation was < 5% in all cases. Therefore, the remainder of the samples were not performed in replicates.
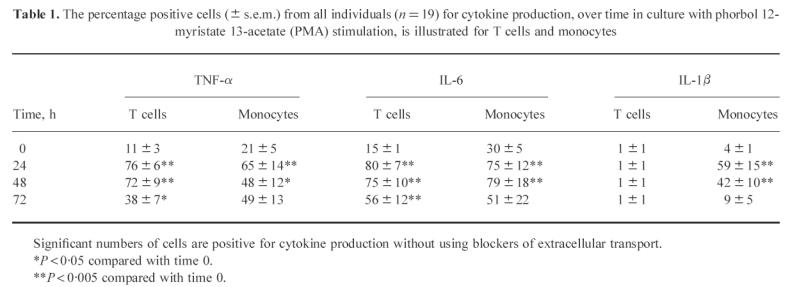
The percentages of T cells and monocytes with positive staining for TNF-α, IL-6 and IL-1β following PMA stimulation are shown in Table 1. The percentage of T cells positive for TNF-α and IL-6 production was quite low at the time of isolation (< 16%). However, upon PMA stimulation the percentage of T cells producing these cytokines at 24 h had significantly increased (P < 0.005 for both TNF-α and IL-6). These percentages were maintained until the 72 h time point, when a marked fall was observed. A greater percentage of monocytes (24–30%) stained positively for TNF-α and IL-6 at time 0. With PMA stimulation, percentage positivity increased significantly at 24 h, with a decline observed thereafter. Few monocytes were initially positive for IL-1β, but the number increased rapidly upon stimulation. Similar to the other cytokines, the percentage of monocytes positive for IL-1β decreased at the later time points.
Table 1.
The percentage positive cells (± s.e.m.) from all individuals (n = 19) for cytokine production, over time in culture with phorbol 12-myristate 13-acetate (PMA) stimulation, is illustrated for T cells and monocytes
In contrast to previous studies, which only reported the percentage of cells positive for cytokine production, the methodology described here can also be used to quantify intracellular cytokine levels. Intracellular T cell TNF-α and IL-6 MFI levels increased with time in culture and the differences in detection between PMA-stimulated and spontaneous samples were significant (Fig. 2). Monocytes produced two- to three-fold greater amounts of their cytokines compared with the T cell samples. In monocytes, increased levels of TNF-α and IL-6 were seen in the PMA-stimulated cultures, compared with spontaneous samples, up to 48 h. By 72 h, spontaneous production of these cytokines was approaching similar levels to that seen in the PMA cultures. PMA-stimulated monocytes optimally produced IL-1β at 24 h, with a rapid reduction in MFI values at 48 h and 72 h. Some spontaneous production of IL-1β was observed at 24 h, with a decreased staining intensity thereafter.
Fig. 2.
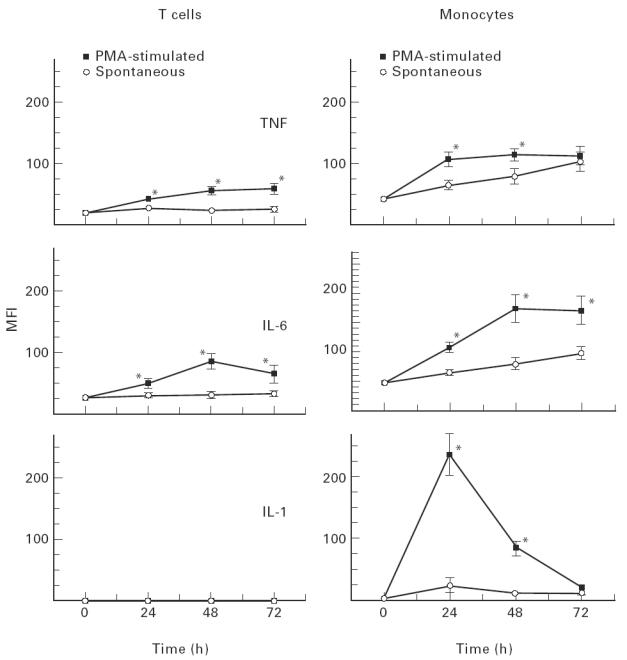
Differences in intracellular cytokine production between phorbol 12-myristate 13-acetate (PMA)-stimulated and spontaneous cultures are shown for T cells and monocytes (n = 19). The abscissa represents time in culture up to 72 h, while the ordinate represents median fluorescence intensity (MFI), which are the arbritary units being used to quantify intracellular cytokine levels (± s.e.m.). *P < 0.05 PMA-stimulated versus spontaneous values.
The relationship between intracellular and extracellular TNF-α production was examined for both T cells and monocytes (Fig. 3). A rapid increase in intracellular monocyte TNF-α was observed which preceded the appearance of extracellular cytokine. After 9 h intracellular monocyte levels began to fall, while extracellular levels remained constant. A modest increase in intracellular T cell TNF-α levels was also observed, and this occurred later than monocytes.
Fig. 3.
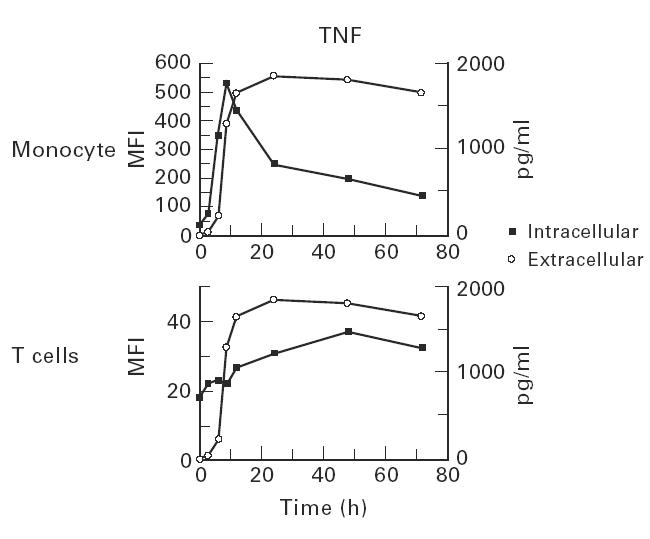
Time course experiments were performed to examine the appearance of extracellular tumour necrosis factor-alpha (TNF-α) production (pg/ml) and its relationship to intracellular (mean fluorescence intensity (MFI)) cytokine staining. Rapid increases in intracellular monocyte TNF-α staining immediately preceded the appearance of extracellular cytokine.
The cytokine export inhibitor brefeldin A had a modest effect on T cell and monocyte intracellular cytokine detection. Little or no increase was seen in MFI for TNF-α or IL-6, from both cell types, but intracellular monocyte IL-1β levels increased by 30%. Brefeldin A had a minimal effect on the percentage of cells positive for cytokine production; however, most of these cells were already positive for cytokine production.
Having optimized the methodology described above, the percentage of cytokine-positive cells and intracellular cytokine levels were examined in different age groups. There was no difference, at any time point, between the two age groups for the percentage of T cells or monocytes staining positively for the proinflammatory cytokines (results not shown). In the older age group however, consistent increases in the level of intracellular T cell TNF-α and IL-6 were seen (Table 2). At time zero, TNF-α and IL-6 levels were similar in the two age groups, but upon incubation, both in spontaneous and PMA-stimulated cultures, T cells from the older group had significantly elevated levels of intracellular TNF-α and IL-6. An example of this age-related increase in intracellular TNF-α is shown in Fig. 4.
Table 2.
Intracellular cytokine staining results are expressed as mean fluorescence intensity (MFI) (± s.e.m.) and are shown for phorbol 12-myristate 13-acetate (PMA)-stimulated, or resting, T cells and monocytes at 0, 24, 48 and 72 h in culture
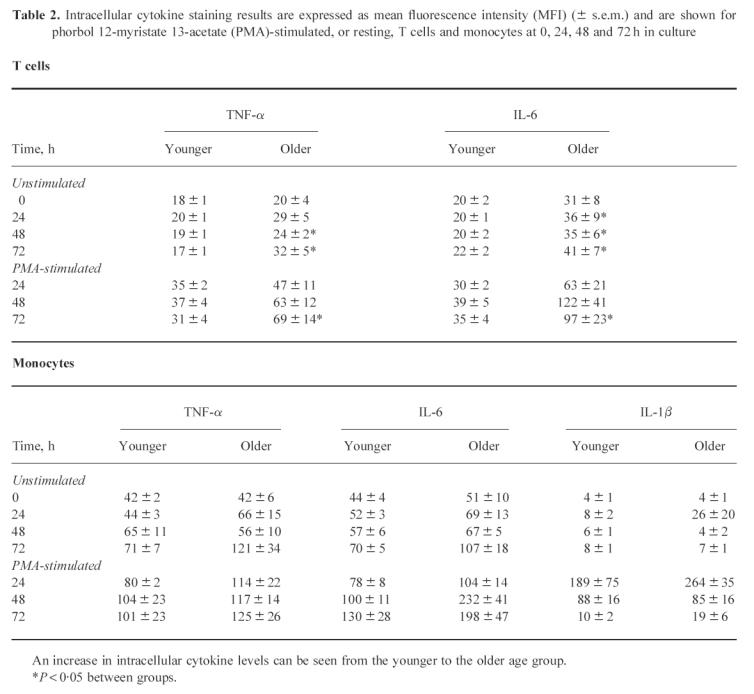
Fig. 4.
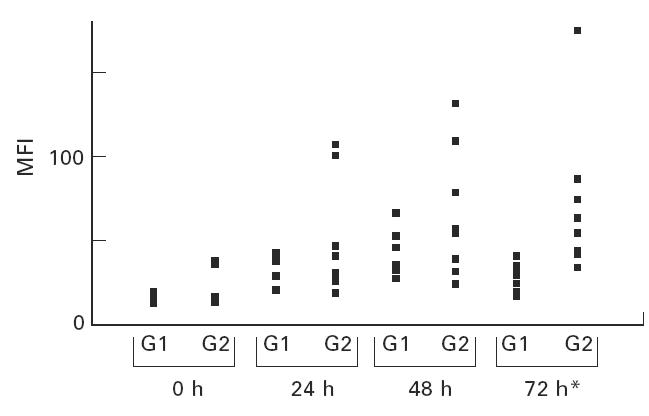
Intracellular tumour necrosis factor-alpha (TNF-α) levels are shown illustrating the differences between the two age groups. Time in culture (abscissa) is plotted against mean fluorescence intensity (MFI; ordinate). G1 and G2 represent the 20–40 and > 62 age groups, respectively. *P < 0.05.
The intracellular monocyte cytokine results are also summarized in Table 2. Monocyte intracellular cytokine levels were initially similar, but over time in culture there was a trend in older individuals towards increased intracellular TNF-α, IL-6 and IL-1β. However, these differences were not statistically significant.
ELISAs were performed on 72 h cell culture supernatants (Fig. 5). There was increased IL-6 and TNF-α production in the older compared with the younger age group, but these differences were not significant. There was no difference between the two age groups for IL-1β.
Fig. 5.
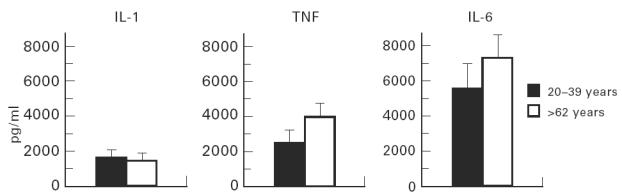
ELISAs were carried out on the 72 h supernatants from the phorbol 12-myristate 13-acetate (PMA)-stimulated cultures. The two age groups are shown on the abscissa, with cytokine production (pg/ml) plotted on the ordinate.
DISCUSSION
Identification of cytokine-producing cells, using flow cytometry, has been previously reported [13,14]. In these studies results were expressed as the percentage of cells staining positive for cytokines. Moreover, protein export inhibitors were commonly employed in order to facilitate cytokine measurement. In the methodology developed in this study, quantification of intracellular cytokine was performed and the cell source (T cell or monocyte) identified. By avoiding the use of export inhibitors, the level of intracellular cytokine at a given time point rather than the accumulated product was measured.
Using this new methodology, both T cell and monocyte proinflammatory cytokine levels were seen to increase with age. Intracellular T cell TNF-α and IL-6 levels were significantly increased in the older age group and similar, although not significant, increases were observed in monocyte TNF-α, IL-6 and IL-1β in older subjects. Pooled levels of proinflammatory cytokine production were also measured in 72 h culture supernatants, but no significant age-dependent differences were observed. This result emphasizes the value of the flow cytometric method, where cytokine production from each of the cell types can be quantified separately. Quantification of pooled cytokine levels using ELISAs may also be misleading, as many complicating factors influence detection with this assay system. Specific binding proteins exist for a number of cytokines, including autoantibodies, α2-macroglobulin, heterophilic antibodies and soluble cytokine receptors, all of which interfere with cytokine detection [11,16]. Quantification of intracellular cytokine levels using flow cytometry avoids the interference due to these extracellular factors.
While the older age group produced a greater quantity of cytokine at the later time points, resting (time zero) cytokine levels were essentially the same as in the younger individuals. This suggests that some regulatory or feedback inhibition pathway which controls stimulated cytokine production may become dysfunctional with age. Previous reports also suggest that alterations in the regulation of cytokine production may occur with age [17]. This could occur due to alterations in secondary messenger systems, such as adenyl cyclase, guanylate cyclase and G proteins [17,18], which mediate the response to receptor binding of various anti-inflammatory hormones. This hypothesis is further supported by the observation that although glucocorticoid levels in aged mice are similar to those in young mice, the older animals are unable to down-regulate excessive cytokine release in response to lipopolysaccharide (LPS) [19].
Previous studies have noted age-associated changes in T lymphocyte subsets [20–23]. Due to the paracrine nature of cytokine production these phenotypic changes might be expected to influence cytokine production. Furthermore, there is some evidence which suggests that with increasing age, there is an accumulation of non-responsive T cells which demonstrate low signalling by lymphokine receptor interactions [24]. Therefore, increased cytokine production by T cells in the elderly may be a type of compensation mechanism in an attempt to overcome these receptor signalling defects.
While the possible reasons for this increase in cytokine levels remain unclear, it may have some important clinical consequences. Systemic increases in proinflammatory cytokine levels could help explain some of the exaggerated inflammatory responses seen in certain elderly individuals following sepsis or surgery. Chorinchath et al. [19] observed increased lethality with age in LPS-administered mice which was due to increased plasma TNF-α and nitric oxide levels in the older group. Since only a proportion of elderly individuals develop exaggerated inflammatory responses, analysis of proinflammatory cytokine levels may be a useful prognostic indicator for those with infection or about to undergo surgery. Such analysis could be performed using the intracellular quantification technique described in this study. This, in turn, will facilitate a greater understanding of de novo synthesis of cytokines in physiological and pathological states.
Acknowledgments
We would like to thank Baggot Street Research Fund, Trinity College Dublin and the Dublin Institute of Technology, Kevin Street, for funding this study. We would also like to thank R&D Systems for providing the monoclonal antibodies to TNF-α, IL-6 and IL-1β.
References
- 1.Pawelec G, Adibzadeh M, Pohla H, Schaudt K. Immunosenescence: ageing of the immune system. Immunol Today. 1995;16:420–2. doi: 10.1016/0167-5699(95)80017-4. [DOI] [PubMed] [Google Scholar]
- 2.Kishimoto T. Factors affecting B cell growth and differentiation. Annu Rev Immunol. 1985;3:133–9. doi: 10.1146/annurev.iy.03.040185.001025. [DOI] [PubMed] [Google Scholar]
- 3.Le J, Vilcek J. Tumour necrosis factor and interleukin-1: cytokines with multiple overlapping biological activities. Lab Invest. 1987;56:234–41. [PubMed] [Google Scholar]
- 4.Akira S, Hirano T, Taga T, Kishimoto T. Biology of multifunctional cytokines: IL-6 and related molecules (IL-1 and TNF) FASEB. 1990;J4:2860–5. [PubMed] [Google Scholar]
- 5.Dinarello CA, Wolf SM. Molecular basis of fever in humans. Am J Med. 1982;72:779–87. doi: 10.1016/0002-9343(82)90548-4. [DOI] [PubMed] [Google Scholar]
- 6.Morrone G, Ciliberto G, Oliviero S, et al. Recombinant interleukin 6 regulates the transcriptional activation of a set of human acute phase genes. J Biol Chem. 1988;263:12554–66. [PubMed] [Google Scholar]
- 7.Fagiolo U, Cossarizza A, Scala E, et al. Increased cytokine production in mononuclear cells of healthy elderly people. Eur J Immunol. 1993;23:2375–8. doi: 10.1002/eji.1830230950. [DOI] [PubMed] [Google Scholar]
- 8.Rich EA, Mincek MA, Armitage KB, et al. Accessory function and properties of monocytes from healthy elderly humans for T lymphocyte responses to mitogen and antigen. Gerontology. 1993;39:93–108. doi: 10.1159/000213519. [DOI] [PubMed] [Google Scholar]
- 9.Riancho JA, Zarrabeitia MT, Amado JA, et al. Age-related differences in cytokine secretion. Gerontology. 1994;40:8–12. doi: 10.1159/000213568. [DOI] [PubMed] [Google Scholar]
- 10.Molteni M, Della Bella S, Mascagni B, et al. Secretion of cytokines upon allogeneic stimulation: effect of aging. J Biol Reg Homeo Agents. 1994;8:41–47. [PubMed] [Google Scholar]
- 11.de Kossodo S, Houba V, Grau GE. WHO.Collaborative Study Group. Assaying tumour necrosis factor concentrations in human serum, a WHO collaborative study. J Immunol Methods. 1995;182:107–12. doi: 10.1016/0022-1759(95)00028-9. [DOI] [PubMed] [Google Scholar]
- 12.Hallden G, Andersson U, Hed J, Johansson SGO. A new permeabilisation method for the detection of intracellular antigens by flow cytometry. J Immunol Methods. 1989;124:103–9. doi: 10.1016/0022-1759(89)90191-9. [DOI] [PubMed] [Google Scholar]
- 13.Jung T, Schauer U, Heusser C, et al. Detection of intracellular cytokines by flow cytometry. J Immunol Methods. 1993;159:197–205. doi: 10.1016/0022-1759(93)90158-4. [DOI] [PubMed] [Google Scholar]
- 14.Ferrick DA, Schrenzel MD, Mulvania T, et al. Differential production of interferon-γ and interleukin-4 in response to Th1- and Th2-stimulating pathogens by γδ T cells in vivo. Nature. 1995;373:255–7. doi: 10.1038/373255a0. [DOI] [PubMed] [Google Scholar]
- 15.North ME, Ivory K, Funauchi M, et al. Intracellular cytokine production by human CD4+ and CD8+ T cells from normal and immunodeficient donors using directly conjugated anti-cytokine antibodies and three-colour flow cytometry. Clin Exp Immunol. 1996;105:517–22. doi: 10.1046/j.1365-2249.1996.d01-795.x. [DOI] [PMC free article] [PubMed] [Google Scholar]
- 16.Cannon JG, Nerad JL, Poutsiaka DD, et al. Measuring circulating cytokines. J Appl Physiol. 1993;75:1897–902. doi: 10.1152/jappl.1993.75.4.1897. [DOI] [PubMed] [Google Scholar]
- 17.Thoman ML, Weigle WO. The cellular and subcellular basis of immunosenescence. Adv Immunol. 1989;46:221–9. doi: 10.1016/s0065-2776(08)60655-0. [DOI] [PubMed] [Google Scholar]
- 18.Meskini N, Macovschi O, Prigent AF, et al. Decreased cyclic nucleotide phosphodiesterase activity in human peripheral mononuclear cells from elderly women. Clin Sci. 1990;79:467–72. doi: 10.1042/cs0790467. [DOI] [PubMed] [Google Scholar]
- 19.Chorinchath BB, Kong LY, Mao L, McCallum RE. Age-associated differences in TNF-α and nitric oxide production in endotoxic mice. J Immunol. 1996;156:1525–9. [PubMed] [Google Scholar]
- 20.Miller RA. Age related changes in T cell surface markers: a longitudinal analysis in genetically heterogeneous mice. Mech Ageing Dev. 1997;96:181–96. doi: 10.1016/s0047-6374(97)01893-9. [DOI] [PubMed] [Google Scholar]
- 21.Jackola DR, Ruger JK, Miller RA. Age-associated changes in human T cell phenotype and function. Ageing. 1994;6:25–34. doi: 10.1007/BF03324210. [DOI] [PubMed] [Google Scholar]
- 22.Goto M, Nishioka K. Age- and sex-related changes of the lymphocyte subsets in healthy individuals: an analysis by two dimensional flow cytometry. J Gerontol. 1989;44:M51–56. doi: 10.1093/geronj/44.2.m51. [DOI] [PubMed] [Google Scholar]
- 23.Ernst DN, Weigle WO, McQuitty DN, et al. Stimulation of murine T cell subsets with anti-CD3 antibody. Age-related defects in the expression of early activation molecules. J Immunol. 1989;142:1413–21. [PubMed] [Google Scholar]
- 24.Song L, Kim YH, Chopra RK, et al. Age-related effects in T cell activation and proliferation. Exp Gerontol. 1993;28:313–21. doi: 10.1016/0531-5565(93)90058-l. [DOI] [PubMed] [Google Scholar]