Abstract
Autoimmunity to cytoskeletal protein tropomyosin (TM) has been demonstrated in UC. However, the TM isoforms involved in this IgG-mediated autoimmune response in UC and the possible presence of serum IgG antibodies against TM (hTMs IgG) in unaffected UC relatives are unknown. The aim of this study was to investigate the human TM (hTM) isoforms recognized by serum IgG from UC and to explore whether hTM IgG antibodies are present in healthy UC relatives. We studied 33 UC patients with 58 unaffected relatives, 31 Crohn's disease (CD) patients with 31 unaffected relatives and 20 controls (C). Serum IgG against four recombinant hTM isoforms (hTM1, 2, 3, 5) were tested by ELISA. p-ANCA were tested by ELISA and immunofluorescence. Serum hTM1 and hTM5 IgG were higher in UC patients than in CD and C (P < 0.005). Among UC patients 52% were seropositive for hTM1 and 64% for hTM5 (P < 0.001 versus CD and C). In UC, hTM5 IgG were higher in p-ANCA+ than in ANCA− patients (P = 0.04). In UC relatives hTM1 IgG were higher than in CD relatives and C (P < 0.01). UC relatives were more frequently seropositive for hTM1 than hTM5 IgG (P = 0.001), while probands were more frequently seropositive for hTM5 IgG (P = 0.008). We conclude that autoimmunity to hTM1 and hTM5 is a feature of UC, while hTM1 IgG differentiate UC relatives from controls. A genetic susceptibility to immune recognition of hTM isoforms in UC is suggested.
Keywords: ulcerative colitis, autoantibodies, tropomyosin, unaffected relatives
INTRODUCTION
Autoimmunity has been implicated in the pathogenesis of UC [1,2]. Mucosal and systemic IgG antibodies against the cytoskeletal protein(s) tropomyosin(s) (TM) as well as anti-neutrophil IgG antibodies with perinuclear pattern (p-ANCA) have indeed been demonstrated in UC [1–5]. Although a genetically determined dysregulation of the immune response has been postulated as the basis of these observations [6,7], the significance of IgG autoantibodies in UC is unclear. TM are a family of acting-binding proteins present in all eukaryotic cells, including colonic epithelial cells, with multiple isoforms regulated by multiple genes [8].
Serum IgG reacting against human TM (hTM) have been reported in 85% of patients with UC, and not in controls [1]. Mucosal lymphocytes infiltrating UC colon have also been shown to spontaneously release ‘in vitro’ IgG and IgG1 antibodies against TM [2]. This finding supports the hypothesis that hTM immune recognition by specific IgG1 capable of complement activation may contribute to the pathogenesis of tissue damage in UC. However, whether in UC patients the presence of mucosal and systemic IgG autoantibodies represents a primary event or it rather reflects an epiphenomenon related to the ongoing intestinal inflammation is unknown.
At least eight TM isoforms with a molecular weight ranging from 32 to 40 kD have been identified [9,10]. Recently, four of these hTM isoforms have been purified and recombinant hTM made available [9,10]. Among these hTM isoforms, hTM5 epitope only has been demonstrated on the surface of normal colonic epithelial cells [11]. The isoform-specific IgG autoimmune response in UC colon and serum has not been investigated. The demonstration in UC patients of IgG antibodies against hTM5, an isoform expressed on colonic epithelial cells, may further support the role of autoimmune mechanisms in the pathogenesis of the disease.
Increasing evidence also suggests a genetic susceptibility for inflammatory bowel disease (IBD) [12,13], with a higher risk of a first-degree relative developing IBD than the general population [14–16]. The presence of p-ANCA in both UC patients and their unaffected relatives also supports that a dysregulation of the immune response and autoimmune mechanisms is genetically determined in UC and shared by members of the same family [3–5]. However, results regarding the prevalence of p-ANCA in unaffected UC relatives are conflicting in different geographical areas [17,18].
In order to address the possible role of autoimmunity against hTM in UC, in the present study we investigated the human hTM isoforms recognized by serum IgG (hTM IgG) from UC patients and their unaffected relatives. The possible presence of different IgG autoantibodies in the same patients has also been addressed by investigating whether serum IgG immunoreactivity against hTM is related to p-ANCA status.
Results indicate that serum IgG against hTM1 and hTM5 represent a feature of UC patients, while serum IgG against hTM1 clearly differentiate UC relatives from controls. An autoimmune response and a genetic susceptibility against specific hTM isoforms in UC is suggested.
PATIENTS AND METHODS
Patients and relatives
Serum samples were drawn from 33 patients with UC. As control groups, sera were collected from 31 patients with CD and 20 healthy controls (C) (10 males, median age 32 years, range 21–56 years). An additional 20 healthy subjects were tested reference normal controls (laboratory controls, LC) (7 males, median age 34 years, range 25–61 years) for the ELISAs. Diagnosis of IBD was made according to the usual clinical, endoscopic and histological criteria. Disease activity was assessed in UC by clinical endoscopic findings [19], and in CD by the Crohn's Disease Activity Index (CDAI) [20]. In the UC group there were 21 males with a median age of 34 years (range 14–70 years) and a disease duration of 3.1 years (range 1–30 years). UC was distal in 20 and extensive in 13 patients, being active in 23 and inactive in 10 patients. UC patients were under 5-ASA enema (2 g/day) (n = 13), 5-ASA enema plus prednisone (PDN) (< 10 mg/day) (n = 8), PDN (> 10 mg/day) (n = 2), PDN plus sulphasalazine (3 g/day) (n = 4), sulphasalazine (3 g/day) (n = 5) or azathioprine (100 mg/day) (n = 1). In the CD group there were eight males with a median age of 30 years (range 14–68 years) and CD duration of 6 years (range 1–20 years). The disease involved the colon (n = 10), the ileum and colon (n = 8) or the ileum (n = 13) and disease was active (CDAI > 200) in 14 and inactive in 17 patients. CD patients were under the following therapy: 13 on oral 5-ASA (2.4 g/day), six on oral 5-ASA plus PDN (< 10 mg/day), seven on sulphasalazine (3 g/day) and five on sulphasalazine plus PDN (< 10 mg/day).
Sera from 58 unaffected relatives of 21 of the 33 UC patients enrolled (36 first and 22 second degree) and sera from 31 unaffected relatives of 19 of the 31 CD patients studied were also tested (18 first and 13 second degree).
Isolation of hTM
The hTM1, 2, 3 and 5 isoforms used as antigen for the ELISAs were kindly provided by Dr K. M. Das (Professor of Medicine, Molecular Genetics and Microbiology, UMDNJ Robert Wood Johnson Medical School, New Brunswick, NJ) [1,9,10,21]
Measurement of serum hTM IgG by ELISA
Serum IgG antibodies against hTM1, 2, 3 and 5 isoforms were tested in each serum by ELISA assay as previously described [1,2]. Results were expressed as optical density (OD). OD values > mean OD from LC + 2 s.d. defined sera positive for hTM IgG (mean OD in LC: hTM1 OD 0.007; hTM2 OD 0.060; hTM3 OD 0.002; hTM5 OD 0.002). The following cut-off OD values defined seropositivity for hTM IgG: hTM1 OD > 0.098; hTM2 OD > 0.173; hTM3 OD > 0.108; hTM5 OD > 0.099.
Evaluation of p-ANCA status by ELISA and immunofluorescence
p-ANCA were detected in sera as previously described [18]. Briefly, normal human neutrophils (PMN) were isolated from the peripheral blood of healthy donors by Fycoll–Hypaque (Pharmacia, Uppsala, Sweden) centrifugation followed by dextran (Pharmacia) sedimentation for 70 min. A monolayer of 200 000 PMN/well was air-dried in a microtitre plate, fixed in ethanol, air-dried and blocked with 0.25% bovine serum albumin (BSA)/PBS pH 7.38. Sera were added (1:100) followed by the alkaline phosphatase (AP)-conjugated anti-human IgG (Sigma) (1:1000). The test was considered positive when OD values were above the mean + 2 s.d. of the negative control group. ELISA-positive sera were examined by indirect immunofluorescence. PMN were smeared on glass slides, air-dried, incubated with sera (1:20): followed by the FITC-conjugated rabbit anti-human IgG (Sigma, St Louis, MO) and evaluated by fluorescence microscopy [18].
Statistical analysis
As OD values for hTM IgG were not normally distributed, the non-parametric Kruskal–Wallis test was used for statistical comparisons. Differences among groups in terms of frequency of positive sera were assessed by the χ2 test. Statistical correlations between hTM IgG titres and IBD clinical variables were assessed by linear regression analysis [22].
RESULTS
Serum hTM IgG in UC patients
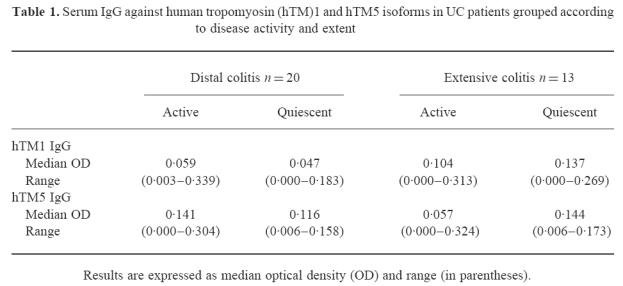
A wide range of OD values was observed in UC patients for serum IgG against the four hTM isoforms (Fig. 1). Serum IgG for hTM1, 2, 3 and 5 were undetectable in 5/33 (15%), 6/33 (18%), 14/33 (42%) and 5/33 (15%) UC patients. The median OD values for serum IgG against hTM1, 3 and 5 were higher in UC patients than in CD patients and healthy controls (hTM1, P = 0.005 and P < 0.001; hTM3, P = 0.001; hTM5, P < 0.001) (Fig. 1). Titres of serum IgG against hTM2 did not differ between the three groups. Titres of serum IgG against the four hTM isoforms did not differ between CD patients and control subjects. In UC the median OD for serum IgG against hTM1 and hTM5 was higher than for hTM3 IgG (P = 0.04). In both CD patients and healthy controls titres of hTM2 IgG were higher than hTM1, hTM3 and hTM5 related IgG (CD, P < 0.05; C, P < 0.001) (Fig. 1). UC patients showed no relation between hTM IgG titres and clinical variables, including disease activity and extent (Table 1).
Fig. 1.
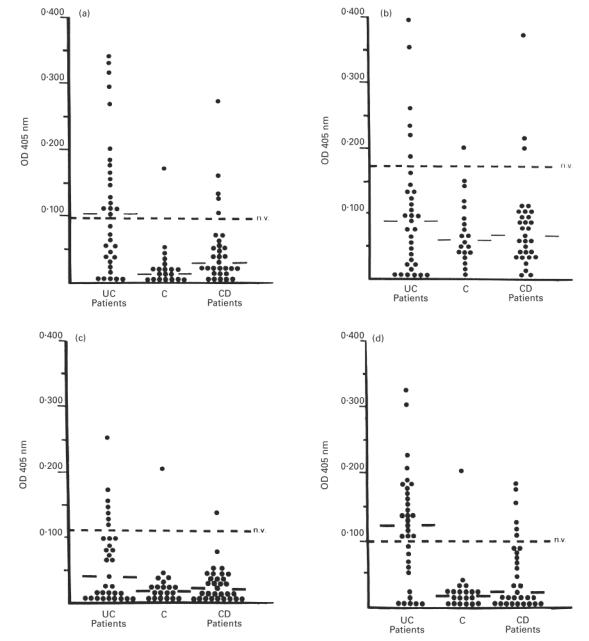
Scattergrams showing the optical density (OD) values for serum human tropomyosin (hTM)1, 2, 3 and 5 IgG (a–d) for each of the 84 inflammatory bowel disease (IBD) patients and controls (C) studied. OD values above the dotted line indicate positive sera (OD > mean OD from laboratory controls (LC) + 2 s.d.). Solid lines indicate the median OD in each group. (a) The median OD value and the percentage of positive sera for serum hTM1 IgG was higher in UC patients than in Crohn's disease (CD) patients (P = 0.005 and P = 0.007) and C (P < 0.001 and P = 0.002). (b) Serum hTM2 IgG titres did not differ between UC patients and controls when both the median OD value and the percentage of positive sera were considered for the analysis. (c) The median OD value for hTM3 IgG was higher in UC patients than in CD patients and C (P = 0.001 for both), while the frequency of positive sera did not differ between UC and controls. (d) The median OD value and the percentage of positive sera for hTM5 IgG was higher in UC patients than in CD patients and C (P < 0.001 for all comparisons).
Table 1.
Serum IgG against human tropomyosin (hTM)1 and hTM5 isoforms in UC patients grouped according to disease activity and extent
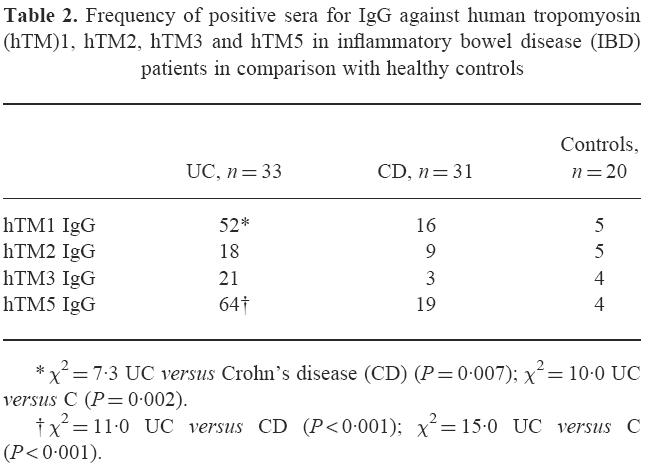
When the mean OD value plus 2 s.d. for serum hTM IgG from LC was used to define seropositivity, among UC patients 17/33 (52%) sera were positive for hTM1 and 21/33 (64%) for hTM5 (Table 2). The percentage of positive sera against hTM1 and hTM5 was higher in UC patients than in both CD patients (hTM1, χ2 = 7, P = 0.007; hTM5, χ2 = 11, P < 0.001) and healthy controls (hTM1, χ2 = 10, P = 0.002; hTM5, χ2 = 15, P < 0.001) (Table 2). The frequency of positive sera for hTM2 and hTM3 related IgG did not differ between UC patients and control groups. A higher percentage of UC patients indeed showed seropositivity for hTM1 and hTM5 than for hTM2 and hTM3 IgG (hTM1 versus hTM2 and 3 IgG: χ2 = 6, P = 0.01 and χ2 = 5, P = 0.02; hTM5 versus hTM2 and 3 IgG: χ2 = 12, P < 0.001 and χ2 = 10, P = 0.001) (Table 2).
Table 2.
Frequency of positive sera for IgG against human tropomyosin (hTM)1, hTM2, hTM3 and hTM5 in inflammatory bowel disease (IBD) patients in comparison with healthy controls
Nearly half of UC patients (52%) were concordant for serum hTM1 and hTM5 IgG. In particular, 34% of UC sera were concordantly positive and 18% were concordantly negative for hTM1 and hTM5 IgG (Fig. 2). Among the 18% (6/33) of UC sera positive for hTM2 IgG, 50% of sera belonged to the concordant or discordant sera for hTM1 and hTM5 IgG, while among the 21% (7/33) of UC sera positive for hTM3 IgG, 71% were also concordantly positive (or negative) for hTM1 and hTM5 IgG. In the UC group, 24% of patients were concordantly positive (6%) or negative (18%) for serum IgG against all the four hTM isoforms tested, although no common clinical variables (including disease activity and extent) were detected in this UC subgroup.
Fig. 2.
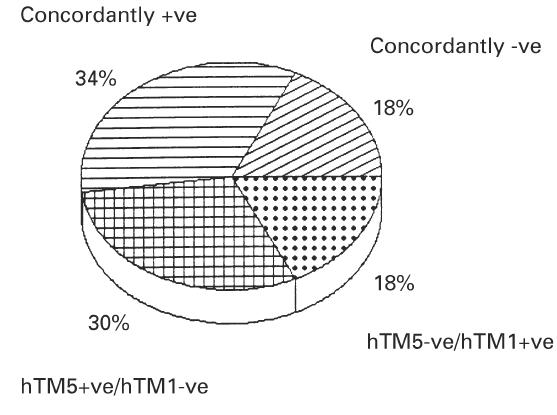
Analysis of concordance for serum human tropomyosin (hTM)1 and hTM5 IgG in patients with UC. As shown, 34% of sera were concordantly positive and 18% concordantly negative for hTM1 and 5 isoforms. As also indicated, 30% of UC sera were positive for only hTM5 and 18% only for hTM1.
In the CD group, all patients positive for hTM1 IgG (n = 5) or hTM5 IgG (n = 6) had a colonic or ileo-colonic involvement of the disease, only one of these patients showing positivity for both hTM1 and hTM5 IgG.
Relation between serum hTM IgG and p-ANCA status
p-ANCA were detected in 17/33 (51%) UC patients, 5/60 (8%) UC relatives and in none of the CD patients and relatives. When the OD values for serum IgG immunoreactivity against hTM were related to p-ANCA status in UC patients, hTM5 IgG were significantly higher in ANCA+ than in ANCA− UC patients (P = 0.04) (Fig. 3). However, the odds ratio (OR) value did not reach statistical significance when considering positivity for serum hTM5 IgG and p-ANCA status in UC patients (OR = 4.3; P = 0.09). Serum IgG immunoreactivity against hTM1, 2 and 3 isoforms did not differ between ANCA+ and ANCA− UC patients (median OD: hTM1 0.110, range 0.000–0.339 versus 0.085, range 0.000–0.313; hTM2 0.082, range 0.000–0.464 versus 0.087, range 0.000–0.383; hTM3 0.029, range 0.000–0.171 versus 0.037, range 0.000–0.251).
Fig. 3.
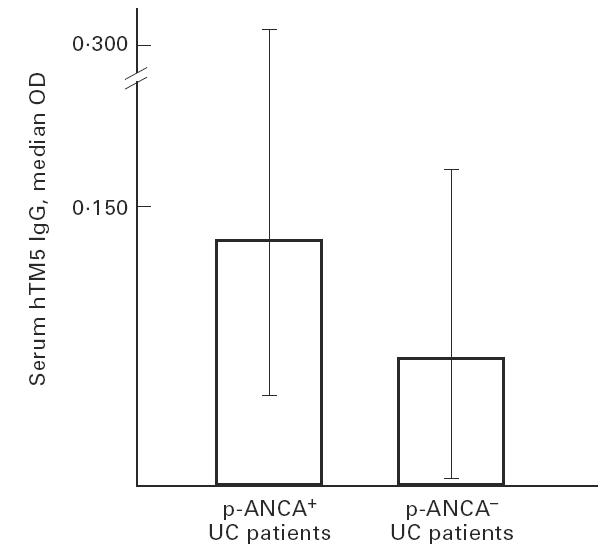
Histograms showing the median optical density (OD) and range values for serum human tropomyosin (hTM)5 IgG in perinuclear anti-neutrophil cytoplasmic antibody (p-ANCA)+ and p-ANCA− UC patients. As indicated, titres of hTM5 IgG were higher in the ANCA+ UC subgroup (P = 0.04 versus ANCA− UC patients).
Serum hTM IgG in unaffected UC relatives
When unaffected UC relatives were considered, a wide range of OD values for hTM IgG was observed (Fig. 4,Table 3). UC relatives showing undetectable hTM IgG were 19/58 (33%) for hTM1, 28/58 (48%) for hTM2, 48/58 (81%) for hTM3 and 47/58 (81%) for hTM5. The median OD values for hTM1 IgG were higher in unaffected UC relatives than in CD relatives and healthy controls (P = 0.006 and P < 0.001) (Fig. 4). Serum IgG reactivity against hTM2, hTM3 and hTM5 isoforms was almost negligible and did not differ between unaffected UC relatives and control groups (Table 3).
Fig. 4.
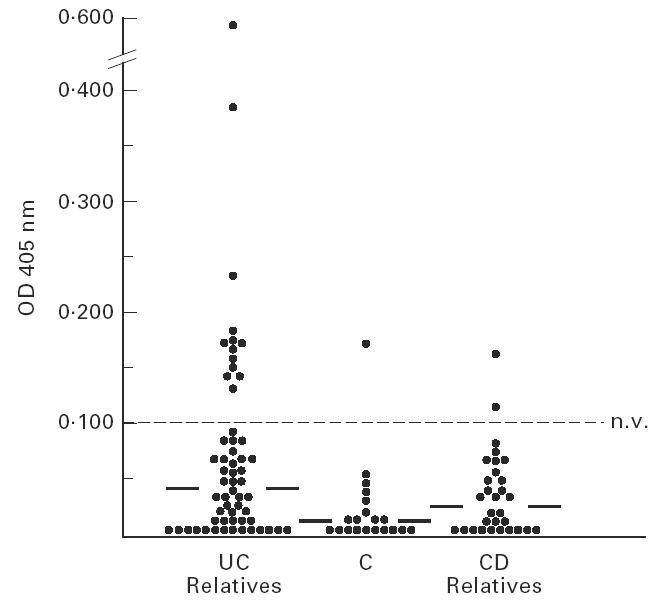
Scattergram showing the optical density (OD) values for serum human tropomyosin (hTM)1 IgG in each of the unaffected inflammatory bowel disease (IBD) relatives in comparison with controls (C). OD values above the dotted line indicate positive sera (OD > mean OD from laboratory controls (LC) + 2 s.d.). Solid lines show the median OD value in each group. As indicated, serum hTM1 IgG were higher in unaffected UC relatives than both healthy Crohn's disease (CD) relatives (P = 0.006) and C (P < 0.001).
Table 3.
Serum IgG reactivity against human tropomyosin (hTM)2, hTM3 and hTM5 isoforms in unaffected inflammatory bowel disease (IBD) relatives in comparison with healthy controls
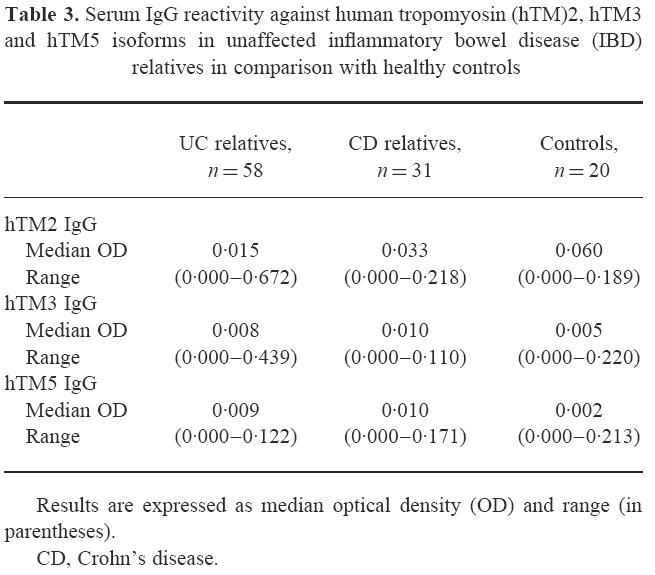
Titres of serum IgG against the four hTM isoforms tested did not differ between first and second degree unaffected IBD relatives. The frequency of positive sera for hTM1 IgG in unaffected UC relatives (18%) was higher than in CD relatives (6%) (χ2 = 6, P = 0.02) and healthy controls (5%) (χ2 = 7, P = 0.02). The percentage of UC relatives positive for hTM2, hTM3 or hTM5 IgG did not differ from control groups.
Serum hTM IgG in UC families
When the 21 UC and 19 CD families with at least one proband and one relative were examined, the median OD value for hTM1 IgG was also significantly lower in unaffected UC relatives than in the probands (relatives, median OD 0.040, range 0.000–0.570; probands, median OD 0.108, range 0.017–0.339; P < 0.001). Among these UC families, seropositivity for hTM1 IgG was shown by 54% of UC patients and 18% of their relatives, while positivity for hTM5 IgG was shown by 73% of UC patients and 3% of their unaffected relatives (Fig. 5). Pedigree analyses of three representative UC families tested for serum hTM1 and hTM5 IgG are shown in Fig. 6. This figure shows that while hTM1 IgG reactivity was observed in both UC patients and relatives, hTM5 IgG showed a higher restriction to the probands. Twenty-four percent of UC patients and their unaffected relatives were concordantly positive and 14% concordantly negative for serum hTM1 IgG. UC relatives were more frequently seropositive for hTM1 than for hTM5 IgG (χ2 = 10, P = 0.001), while the probands were more frequently seropositive for hTM5 than hTM1 IgG (χ2 = 7, P = 0.008) (Fig. 5). However, the frequency of positive sera was lower in UC relatives than in the probands when both hTM1 and hTM5 IgG were considered (hTM1, χ2 = 26, P < 0.001; hTM5, χ2 = 101; P < 0.001) (Fig. 5).
Fig. 5.
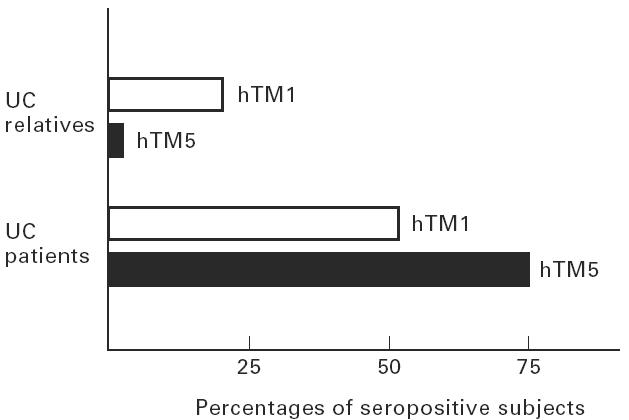
Histograms showing the frequency of positive sera for human tropomyosin (hTM)1 and hTM5 IgG among the 21 UC families with at least the proband and one unaffected relative tested. UC relatives were more frequently seropositive for hTM1 than for hTM5 IgG (χ2 = 10, P = 0.001), while the probands were more frequently seropositive for hTM5 than hTM1 IgG (χ2 = 7, P = 0.008). The percentage of positive sera was higher in UC patients than in relatives for both hTM1 and hTM5 IgG (χ2 = 26, P < 0.001 and χ2 = 101, P < 0.001).
Fig. 6.
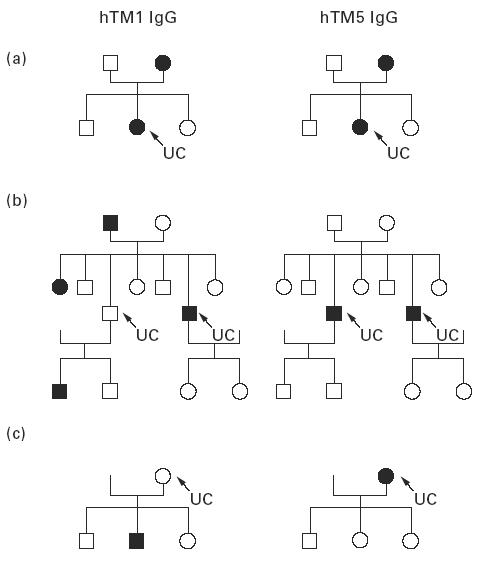
Pedigree analysis in three representatives of the 21 UC families with either one member (a,c) or two members affected (b) tested for serum human tropomyosin (hTM) IgG. The black symbols denote individuals who are serum hTM1 IgG (left) or hTM5 IgG (right)-positive; arrows indicate the proband. Positivity for serum hTM1 IgG is observed in both UC patients and unaffected relatives, while hTM5 IgG positivity tends to be restricted to UC. Overall, among the 21 UC families tested, seropositivity for hTM1 IgG was shown by 54% of UC patients and 18% of their relatives, while 73% of UC patients and 3% of their relatives were seropositive for hTM5 IgG.
DISCUSSION
TM are a large group of closely related proteins capable of regulating cytoskeletal structure and cellular contractility [8–10,23]. In intestinal epithelial cells TM have been localized in the apical cytoplasm and in the brush border [24,25]. Serum and mucosal IgG against a colonic epithelial antigen related to TM have been shown in UC, supporting a putative autoantigenic role of these proteins in UC [1,2]. Since the hTM isoforms recognized by serum IgG from UC are unknown, this issue was investigated in the present study. Results demonstrated that UC is associated with a specific IgG-mediated immune response against hTM1 and hTM5 isoforms. This observation is supported by recent findings showing that mucosal lymphocytes infiltrating UC colon spontaneously release in vitro higher hTM1 and hTM5 IgG antibodies than controls [26]. Taken together, these observations support a B cell-mediated autoimmune response against specific hTM isoforms both in the circulation and in the intestinal mucosa in UC. In the present study, a wide range of anti-hTM IgG titres was observed in UC. This finding may be related to a heterogeneity among UC patients or to different degrees of severity and extent of the disease. However, titres of serum hTM IgG did not differ between UC patients grouped according to clinical variables. Due to the high range of titres observed in the active UC group, the observed higher median OD values for hTM1 IgG in the UC group with inactive versus active extensive disease did not indeed reach statistical significance.
As p-ANCA are present with higher frequencies in UC [4,5], the possible relation between serum hTM IgG and p-ANCA was evaluated. Results showed a higher IgG reactivity against hTM5 in p-ANCA+ UC patients, thus suggesting that ANCA status may influence serum IgG reactivity against hTM. A genetic background has been postulated in the development of autoantibodies in UC [6,7]. It is therefore conceivable that subgroups of patients may develop autoantibodies against several antigens, including both hTM5 and the (unknown) target antigen(s) of p-ANCA. This hypothesis is further supported by recent findings showing that carriage of IL-1 receptor antagonist allele 2 and tumour necrosis factor allele 2 in UC is associated with extensive disease as well as with positivity for p-ANCA [27]. Whether the presence of autoantibodies in UC is expression of a primitive alteration of the immune response, or it rather represents an epiphenomenon which may be caused by cross-reactivity with other antigens, is still unknown. However, growing evidence suggests a genetically determined dysregulation of the immune response in UC and that genetic markers may predict the natural history of the disease, at least in subgroups of patients [6,7,27].
On the basis of these observations, it is conceivable that autoantibodies may be shared by members of the same family. To address this issue we also investigated serum IgG reactivity against hTM in healthy IBD relatives. Results showed that while positivity for serum hTM1 and hTM5 IgG seems to represent a feature of UC patients, serum IgG to hTM1 clearly differentiates UC relatives from controls. These data suggest epitope differences in the immune response against hTM isoforms in UC patients and relatives. There was a 38% concordance for hTM1 IgG in UC patients and their relatives, thus suggesting a genetic heterogeneity for hTM immune recognition in UC. However, the sample size of relatives tested was small and further analysis of the cross-reactive epitope(s) recognition may help to explain genetic predisposition to autoimmunity against hTM in UC.
Taken together, these data suggest that while serum hTM1 IgG may indicate a genetic predisposition to develop UC, hTM5 IgG may rather represent a marker of UC in subgroups of patients. This hypothesis is in agreement with previous studies showing that hTM5 represents the major hTM isoform in intestinal epithelial cells, whereas intestinal smooth muscle contains only hTM1, 2 and 3 isoforms [26]. This finding supports the concept that while positivity for IgG to hTM1 (not expressed on normal colonic epithelial cells) is observed in both UC patients and relatives, positivity for hTM5 IgG (expressed on colonic epithelial cells) may represent a more specific marker for UC. Whether seropositivity for hTM1 IgG may predict disease behaviour in subgroups of UC patients needs further investigation. Taken together, results from UC family members suggest an IgG-mediated autoimmune response and a genetic susceptibility against specific hTM isoforms or related peptide(s).
The observed higher seropositivity for both hTM1 and 5 IgG in UC suggests that the antigenic epitope(s) in UC colon may be located in common regions(s) between hTM1 and 5. This is also supported by our finding that while 34% of UC sera were concordantly positive for hTM1 and 5, only 3% of sera were positive for both hTM1 and 3 or hTM3 and 5 isoforms. A putative aberrant expression of hTM1-related epitope in UC colon epithelium may also account for the observed IgG-mediated autoimmune response to hTM1 isoform in UC. Moreover, it is not known whether the specific hTM isoforms recognized by serum and mucosal IgG antibodies in UC may modify during the natural history of the disease.
Among the four hTM isoforms tested, hTM5 epitope only has been demonstrated on the surface of normal colonic epithelial cells by FACS analysis using a specific anti-hTM5 MoAb (CG3) and immunoelectromicroscopy [11]. In contrast to colonocytes, small intestinal epithelial cells did not react with CG3 MoAb. The presence of hTM5 on the surface of epithelial cells from colon but not from jejunum may account for the UC specificity shown by serum hTM5 IgG. This observation also suggests that hTM5-related epitope(s) expressed on the surface of UC colon epithelial cells may induce the local production of specific IgG antibodies. This is supported by the reported mucosal production of IgG antibodies against hTM by intestinal lymphocytes isolated ‘in vitro’ from UC colon [2]. The mucosal IgG production mainly belonged to the IgG1 subclass antibody, capable of complement activation [28]. Deposition of IgG1 antibody with activated complement products (C3b and terminal complement complex) along the apical part of colonic epithelial cells has indeed been shown in UC colon [29–31]. Triple immunofluorescence analysis also showed that activated complement and IgG1 subclass antibodies co-localized with TM-related protein(s) apically on the surface epithelium in active UC, but not CD colon [32]. Taken together, results from the present study and previous observations support the hypothesis that in UC colon an IgG1-mediated autoimmune response to hTM may lead to complement activation, thus representing a possible additional pathogenic mechanism for colonic epithelial damage in UC. In particular, the deposition in UC colonic epithelium of immune complexes constituted by hTM5 with specific IgG1 antibodies may lead to complement activation [29–31]. This last event by itself is capable of inducing a complement-mediated epithelial inflammation and cytolysis in UC colon [30,33,34]. Terminal complement complex and the anaphylatoxins (C3 and C5a) released during complement activation also stimulate macrophages to release prostaglandin E2 (PGE2), thromboxane B2 (TXB2) and leukotriene B4 (LTB4) [30,35,36], shown to be increased in UC tissue [37,38]. LTB4 and C5a represent chemotactic factors for granulocytes, and they may therefore be involved in the marked infiltration of these cells in UC colon [30,35–38].
In conclusion, results from the present study support the concept that an IgG1-mediated autoimmune response against the hTM5 antigen expressed on colonic epithelial cells represents a mechanism contributing to the amplification and perpetuation of the inflammatory process in UC.
Acknowledgments
This work was supported by grant from the Italian National Research Council (C.N.R. 94.02460.CT04 and C.N.R. 96.03133.CT04).
REFERENCES
- 1.Das KM, Dasgupta A, Mandal A, et al. Autoimmunity to cytoskeletal protein tropomyosin. J Immunol. 1993;150:2487–93. [PubMed] [Google Scholar]
- 2.Biancone L, Mandal A, Yang H, et al. Production of immunoglobulin G and G1 antibodies to cytoskeletal protein by lamina propria cells in ulcerative colitis. Gastroenterology. 1995;109:3–12. doi: 10.1016/0016-5085(95)90263-5. [DOI] [PubMed] [Google Scholar]
- 3.Shanahan F, Duerr R, Rotter JI, et al. Neutrophil autoantibodies in ulcerative colitis: familial aggregation and genetic heterogeneity. Gastroenterology. 1992;103:456–61. doi: 10.1016/0016-5085(92)90834-l. [DOI] [PubMed] [Google Scholar]
- 4.Duerr RH, Targan SR, Landers CJ, et al. Anti-neutrophil cytoplasmic antibodies in ulcerative colitis: a comparison with other colitides/diarrhea/illness. Gastroenterology. 1991;100:1590–6. doi: 10.1016/0016-5085(91)90657-7. [DOI] [PubMed] [Google Scholar]
- 5.Seibold F, Slametschka D, Gregor M, et al. Neutrophil autoantibodies: a genetic marker in primary sclerosing cholangitis and ulcerative colitis. Gastroenterology. 1994;107:532–6. doi: 10.1016/0016-5085(94)90181-3. [DOI] [PubMed] [Google Scholar]
- 6.Duerr RH, Neigut DA. Molecularly defined HLA-DR2 alleles in ulcerative colitis and an anti-neutrophil cytoplasmic antibody-positive subgroup. Gastroenterology. 1995;108:423–7. doi: 10.1016/0016-5085(95)90069-1. [DOI] [PubMed] [Google Scholar]
- 7.Satsangi J, Welsh KI, Bunce M, et al. Contribution of genes of the major histocompatibility complex to susceptibility and disease phenotype in inflammatory bowel disease. Lancet. 1996;347:1212–7. doi: 10.1016/s0140-6736(96)90734-5. [DOI] [PubMed] [Google Scholar]
- 8.Lees-Miller JP, Helfman DM. The molecular basis for tropomyosin isoform diversity. Bioassays. 1991;13:429–37. doi: 10.1002/bies.950130902. [DOI] [PubMed] [Google Scholar]
- 9.Novy RE, Lin JLC, Lin JJC. Human fibroblast tropomyosin isoforms: characterization of cDNA clones and analysis of tropomyosin isoform expression in human tissues and in normal and transformed cells. Cell Motil Cytoskeleton. 1993;25:267–81. doi: 10.1002/cm.970250307. [DOI] [PubMed] [Google Scholar]
- 10.Novy RE, Sellers JR, Liu LF, et al. In vitro functional characterization of bacterially expressed human fibroblast tropomyosin isoforms and their chimeric mutants. Cell Motil Cytoskeleton. 1993;26:248–61. doi: 10.1002/cm.970260308. [DOI] [PubMed] [Google Scholar]
- 11.Yoshikazi N, Kasariu K, Lin J, et al. Expression of a tropomyosin-related protein on the surface of colon epithelial cells and its possible functional significance. Gastroenterology. 1996;110:A1051. [Google Scholar]
- 12.McConnell RB, Vadheim CM. Inflammatory bowel disease. In: King RA, Rotter JI, Motulsky AO, editors. The genetic basis of common diseases. Oxford: Oxford University Press; 1992. pp. 326–48. [Google Scholar]
- 13.Satsangi J, Jewell DP, Rosemberg WMC, et al. Genetics of inflammatory bowel disease. Gut. 1994;35:696–700. doi: 10.1136/gut.35.5.696. [DOI] [PMC free article] [PubMed] [Google Scholar]
- 14.Lee JCV, Lennard-Jones JE. Inflammatory bowel disease in 67 families each with three or more affected first-degree relatives. Gastroenterology. 1996;111:587–96. doi: 10.1053/gast.1996.v111.pm8780561. [DOI] [PubMed] [Google Scholar]
- 15.Tysk C, Lindberg E, Jarnerot G, et al. Ulcerative colitis and Crohn's disease in an unselected population of monozygotic and dizygotic twins. A study of heritability and the influence of smoking. Gut. 1988;29:990–6. doi: 10.1136/gut.29.7.990. [DOI] [PMC free article] [PubMed] [Google Scholar]
- 16.Orholm M, Iselius L, Sorensen TI, et al. Investigations of inheritance of chronic inflammatory bowel disease by complex segregation analysis. BMJ. 1993;306:20–24. doi: 10.1136/bmj.306.6869.20. [DOI] [PMC free article] [PubMed] [Google Scholar]
- 17.Lee JCW, Lennard-Jones JE, Cambridge G. Antineutrophil antibodies in familial inflammatory bowel disease. Gastroenterology. 1995;108:428–33. doi: 10.1016/0016-5085(95)90070-5. [DOI] [PubMed] [Google Scholar]
- 18.Monteleone G, Marasco R, Parrello T, et al. Low prevalence of p-ANCA in unaffected relatives of patients with ulcerative colitis from a Mediterranean area. Inflamm Bowel Dis. 1996;2:11–15. [PubMed] [Google Scholar]
- 19.Gomes P, Du Boulay C, Smith CL, et al. Relationship between disease activity indices and colonscopic findings in patients with colonic inflammatory bowel disease. Gut. 1986;27:92–95. doi: 10.1136/gut.27.1.92. [DOI] [PMC free article] [PubMed] [Google Scholar]
- 20.Best WR, Becktel JM, Singleton JW, et al. Development of a Crohn's disease activity index. Gastroenterology. 1976;70:439–44. [PubMed] [Google Scholar]
- 21.Lin JJ-C, Warren KS, Wanboldt DD, et al. Tropomyosin isoforms in cultured non-muscle cells. J Cell Biol. 1988;107:1–38. doi: 10.1083/jcb.107.2.563. [DOI] [PMC free article] [PubMed] [Google Scholar]
- 22.Kendall M, Stuart A. Statistical relationship: linear regression and correlation. In: Griffin C, editor. Advanced theory of statistics. 4. Vol. 2. London: High-J-Combe; 1979. pp. 298–337. [Google Scholar]
- 23.Burgess DR, Broschat KO, Hayden JM. Tropomyosin distinguishes between the two actin-binding sites of willin and affects actin-bindings properties of other brush border proteins. J Cell Biol. 1987;104:29–31. doi: 10.1083/jcb.104.1.29. [DOI] [PMC free article] [PubMed] [Google Scholar]
- 24.Mooseker MS. Organization, chemistry and assembly of the cytoskeletal apparatus of the intestinal brush border. Annu Rev Cell Biol. 1985;1:209–11. doi: 10.1146/annurev.cb.01.110185.001233. [DOI] [PubMed] [Google Scholar]
- 25.Bikle DD, Munson S, Morrison N, et al. Zipper protein, a newly described tropomyosin-like protein of intestinal brush border. J Biol Chem. 1993;268:620–6. [PubMed] [Google Scholar]
- 26.Geng X, Biancone L, Dai HH, et al. Tropomyosin isoforms in colonic epithelial cells and production of isoform specific autoantibodies by lamina propria lymphocytes in ulcerative colitis. Gastroenterology. 1998;114:912–22. doi: 10.1016/s0016-5085(98)70310-5. [DOI] [PubMed] [Google Scholar]
- 27.Roussomoustakaki M, Satsangi J, Welsh K, et al. Genetic markers may predict disease behaviour in patients with ulcerative colitis. Gastroenterol. 1997;112:1845–53. doi: 10.1053/gast.1997.v112.pm9178675. [DOI] [PubMed] [Google Scholar]
- 28.Heiner DC. Significance of immunoglobulin G subclasses. Am J Med. 1984;76:1–6. doi: 10.1016/0002-9343(84)90313-9. [DOI] [PubMed] [Google Scholar]
- 29.Halstensen TS, Mollnes TE, Garred P, et al. Epithelial deposition of immunoglobulin G1 and activated complement (C3b and terminal complement complex) in ulcerative colitis. Gastroenterology. 1990;98:1264–71. doi: 10.1016/0016-5085(90)90343-y. [DOI] [PubMed] [Google Scholar]
- 30.Brandtzaeg P, Halstensen TS, Kett K. Immunopathology of inflammatory bowel disease. In: MacDermott RP, Stenson WF, editors. Inflammatory bowel disease. New York: Elsevier; 1992. pp. 95–136. [Google Scholar]
- 31.Halstensen TS, Mollness TE, Brandtzaeg P. Immunohistochemical evidence for persistent complement activation in submucosal blood vessels of active inflammatory bowel disease. Gastroenterology. 1989;97:10–19. doi: 10.1016/0016-5085(89)91409-1. [DOI] [PubMed] [Google Scholar]
- 32.Halstensen TS, Das KM, Brandtzaeg P. Epithelial deposits of immunoglobulin G1 and activated complement co-localize with the 40 kDa colonic autoantigen in ulcerative colitis. Gut. 1993;34:650–7. doi: 10.1136/gut.34.5.650. [DOI] [PMC free article] [PubMed] [Google Scholar]
- 33.Bhakdi S, Kaflein R, Halstensen TS, et al. Complement S-protein (Vitronectin) is associated with cytolytic membrane-bound C5b-9 complexes. Clin Exp Immunol. 1988;74:459–64. [PMC free article] [PubMed] [Google Scholar]
- 34.Gotze O, Muller-Eberhard HJ. Lysis of erythrocytes by complement in absence of antibody. J Exp Med. 1970;132:898–903. doi: 10.1084/jem.132.5.898. [DOI] [PMC free article] [PubMed] [Google Scholar]
- 35.Hansch G, Seitz M, Martinotti G, et al. Macrophages release arachidonic acid, prostaglandin E2 and thromboxane in response to late complement components. J Immunol. 1984;133:2145–50. [PubMed] [Google Scholar]
- 36.Imagawa DK, Osifchin NE, Paznekas WA, et al. Consequence of cell membrane attack by complement: release of arachidonate and formation of inflammatory derivates. Proc Natl Acad Sci USA. 1983;80:6647–51. doi: 10.1073/pnas.80.21.6647. [DOI] [PMC free article] [PubMed] [Google Scholar]
- 37.Donowitz M. Arachidonic acid metabolites and their role in inflammatory bowel disease: an update requiring addition of a pathway. Gastroenterology. 1985;88:580–7. doi: 10.1016/0016-5085(85)90525-6. [DOI] [PubMed] [Google Scholar]
- 38.Lauritsen K, Laursen LS, Bukhave K, et al. Effects of topical 5-aminosalicylic acid and prednisolone on prostaglandin E2 and leukotriene B4 levels determined by equilibrium in vivo dialysis of rectum in relapsing ulcerative colitis. Gastroenterology. 1986;91:837–44. doi: 10.1016/0016-5085(86)90684-0. [DOI] [PubMed] [Google Scholar]


