

Abstract
Changes in the pattern of cytokines found in CD4 and CD8 T cells during the growth of Mycobacterium tuberculosis that resulted in the establishment of a latent infection were monitored. Subsets of T cells were identified based on their differential expression of CD45 and CD44 which allowed them to be classified as naive, activated or memory. We found that the T cells in the lung produced a predominantly type 1 cytokine response. The appearance of large numbers of Th1 cells coincided with the establishment of latency. In contrast, the predominant response in the mediastinal lymph node and spleen was a Th2-type response.
Keywords: tuberculosis, type 1 and type 2 cytokines, latent tuberculosis
INTRODUCTION
Infection of man with Mycobacterium tuberculosis results in the development of an immune response, control of Mycobacterial growth and the establishment of a latent infection [1–10]. Previous work in our laboratory has shown that intravenous (i.v.) or intranasal (i.n.) infection of mice with low doses of M. tuberculosis (Erdman) resulted in the establishment of a latent infection over the course of 12 weeks. The number of colony-forming units (CFU) isolated from the lungs or spleen of mice after that period remained low for up to 9 months [11,12].
Both CD4 and CD8 T cells have been shown to be important in the control of mycobacterial growth. Studies that have characterized the changes in splenic T cells following i.v. injection of M. tuberculosis have also found that the production of type 1 cytokines by CD4+ lymphocytes is important for the control of mycobacterial growth [13–18]. The results of these studies have been reinforced by the observation that knock-out mice that cannot produce interferon-gamma (IFN-γ) or cannot express the IFN-γ receptor are more susceptible to the growth of the tubercle bacillus then are mice with intact immune systems [19–23]. Similarly, β2-microglobulin (b2-m) knock-out mice, that lack functional CD8 T cells, have also been found to be more susceptible to Mycobacterial growth [24].
While it is generally agreed that CD4+ cells control mycobacterial growth by producing type 1 cytokines (IL-2, IFN-γ and tumour necrosis factor-beta (TNF-β)) [25–27], cytokine production by CD8+ T cells in mice infected with the tubercle bacillus has not been extensively evaluated [28,29]. The purpose of this study was to characterize both CD4 and CD8 T cells during the course of a primary infection with M. tuberculosis by multiparameter flow cytometry. The characterization, which was initially based on the differential expression of CD45 and CD44 by the T cell populations [28,30,31], also included an analysis for the presence of intracellular cytokines. Our results show that the control of mycobacterial growth in the lung was associated with the production of type 1 cytokines by both CD4 and CD8 activated and memory cell populations.
MATERIALS AND METHODS
Mice
Specific pathogen-free male BALB/c mice were obtained from Charles River Labs (Wilmington, MA). Mice were 6–8 weeks of age at the start of each experiment. The animals were housed under sterile conditions in microisolator cages (Lab Products, Maywood, NJ) in a BSL-3 facility and given food and water ad libitum.
Mycobacterial infection
Mycobacterium tuberculosis (Erdman) was obtained from the American Type Culture Collection (ATCC 35801, TMC 107; Rockville, MD) and initially cultured to a density of 5 × 10⁸ CFU/ml as previously described [11,12]. The bacteria were aliquoted in 1-ml amounts and stored frozen at −70°C until use. Prior to use the microorganisms were thawed, sonicated at 70 cycles/s at 50% efficiency and diluted in Hanks' balanced salt solution (HBSS). Mice were infected intranasally under anaesthesia (Ketamine/Xylacine mixture; Ketamine 48 μg/g (Vedco, St Joseph, MO), Xylacine 3.2 μg/g (Bayer, Shawnee Mission, KS)) in 25 μl intramuscularly. The mice were inoculated with 25 μl of the bacterial suspension containing 1000 CFU placed on the external nares using a micropipette as described by Saunders & Cheers [32]. The bacteria were inhaled. The number of microorganisms used was confirmed by plate count. Bacterial growth was monitored by plate count by determining the number of CFU in the lung and spleen at various times after inoculation. The course of this infection of the lungs, leading to the establishment of latency, has been described elsewhere [12].
Preparation of lymphocyte populations
Mice were killed at selected time points following infection and the spleen, mediastinal and superficial cervical lymph nodes were removed and placed separately into 5 ml of ice-cold Dulbecco's modified Eagle's medium (DMEM; Gibco BRL, Grand Island, NY) supplemented with 20% heat-inactivated fetal bovine serum (FBS; HyClone, Logan, UT) containing glutamine and penicillin/streptomycin. The lungs were placed into HBSS containing 1% bovine serum albumin (BSA; Sigma, St Louis MO), aspirated to remove blood and then cut into fine pieces using a surgical scissors. The lung tissue was then digested for 45 min with a prescreened lot of collagenase (150 U/ml; Worthington Biochemical, Cleveland, OH). The digested tissue was passed through 40 gauge stainless steel sieves and then through 18 and 21 G needles. The cell suspension was washed three times with HBSS. The lymphocytes were purified from the lung cell suspension by gradient centrifugation; cells were layered onto 5 ml of Ficoll–Paque (Pharmacia, Piscataway, NJ) in a 15-ml conical centrifuge tube and centrifuged at room temperature for 20 min at 1500 g. Following centrifugation the purified lymphocyte population was washed twice with PBS.
Single-cell suspensions of spleen and lymph node cells were prepared by passing the tissue through 40 gauge stainless steel mesh screens and then through 18 and 21 G needles to break up small tissue clumps. The erythrocytes were lysed by addition of distilled water to the spleen cell suspension followed immediately by the addition of 48 ml of complete DMEM and centrifugation of the cells at 400 g for 10 min. The spleen and lymph node suspensions were then washed three times in PBS and stored on ice.
CD4 and CD8 T lymphocytes were purified from spleen, lung and lymph node cell suspensions using the IMMULAN mouse T cell subpopulation kit for CD4/CD8 (Biotecx Labs, Inc., Houston, TX). The purity of the enriched lymphocyte subsets was confirmed by flow cytometric analysis and was always > 90%.
Flow cytometric analysis
Flow cytometric analysis was used to determine the expression of CD3, CD4 and CD8 to check the efficacy of the separation for the control of samples [12]. In separate staining procedures, antibodies reacting with CD44, CD45RB, IL-2, IFN-γ, IL-4, IL-10 were used in test samples. The following conjugated antibodies were obtained from Pharmingen (San Diego, CA): anti-CD3, cychrome-conjugated; anti-CD8, PE-conjugated; biotinylated anti-CD45RB; anti-CD44, cychrome-conjugated; IL-2 and IFN-γ, FITC-conjugated; IL-4 and IL-10, PE-conjugated. Strepavidin conjugated to RED 613 was obtained from Gibco-BRL (Burlingame, CA). Staining was performed as described by Pharmingen by incubating 1–2 × 10⁶ cells with antibody (1 μg/ml) for 25 min at 4°C. After washing twice the streptavidin-conjugated RED 613 was added and the samples incubated for an additional 20 min before washing with ice-cold PBS. For the test samples, the cells were fixed initially incubated with 1 mm monensin for 30 min before fixation with 4% paraformaldehyde for 30 min. The cells were then washed three times with cold PBS, resuspended with 50 μl of permeabilization buffer, dually stained for 30 min with either IL-2/IL-4 or IFN-γ/IL-10, and washed three times with cold PBS before flow cytometric analysis. Three-colour (controls) and four-colour (test) multiparameter analysis was performed using a Coulter EPICS Elite flow cytometer (Coulter Corp., Hialeah, FL) as described by Howard et al. [12]. For efficacy controls, the T cells were identified by gating of the CD3+ cells. Those cells were analysed for CD4 and CD8. In the test samples, purified CD4 and CD8 T cells were further analysed for the expression of CD45RB and CD44. The MoAbs to CD44 and CD45RB revealed a bimodal staining pattern which resulted in cells with bright and dim intensities indicating the presence of distinct phenotypic populations. Each subset was then analysed for the presence of intracellular cytokines. Cells from a pool of three mice were analysed separately and the data represent the means of three different time course experiments. The data are expressed as ratios of IL-2 and IFN-γ (type 1 cytokines) total cells to IL-4 and IL-10 (type 2 cytokines) total cells based on the total yield of cells and the percentage of each population. Cells that expressed both type 1 and type 2 cytokines, i.e. Th0 cells, were analysed separately.
Statistical analysis
The differences in the pattern of cytokine production by the T lymphocyte populations at each time point were determined by one-way analysis of variance (anova) (StatMost, Salt Lake City, UT). The differences in the cytokine pattern of the T lymphocyte populations from uninfected mice were evaluated, as was the effect of time and infection on changes in the cytokine patterns. The results were significant if they equalled or exceeded the 95% confidence level (P ≤ 0.05).
RESULTS
Cytokine production by naive, activated and memory T cells in the lungs of mice following infection with M. tuberculosis
Immediately prior to infection the naive (CD45hi/CD44lo) CD4 lymphocyte population in the lungs was characterized by the presence of the type 1 cytokines, IFN-γ and IL-2 (Fig. 1a). Similarly, a slight bias toward a type 1 cytokine response was observed within the memory (CD45lo/CD44hi) CD4+ T cells (Fig. 1c). The presence of type 1 producing activated and memory CD4+ T cells increased initially after infection and the presence of CD4+ cells that produced predominantly type 1 or type 2 cytokines appeared to be about equal until the establishment of latency [12], when the type 1 cytokine response by the memory CD4 population exceeded the type 2 response by more then 20-fold.
Fig. 1.
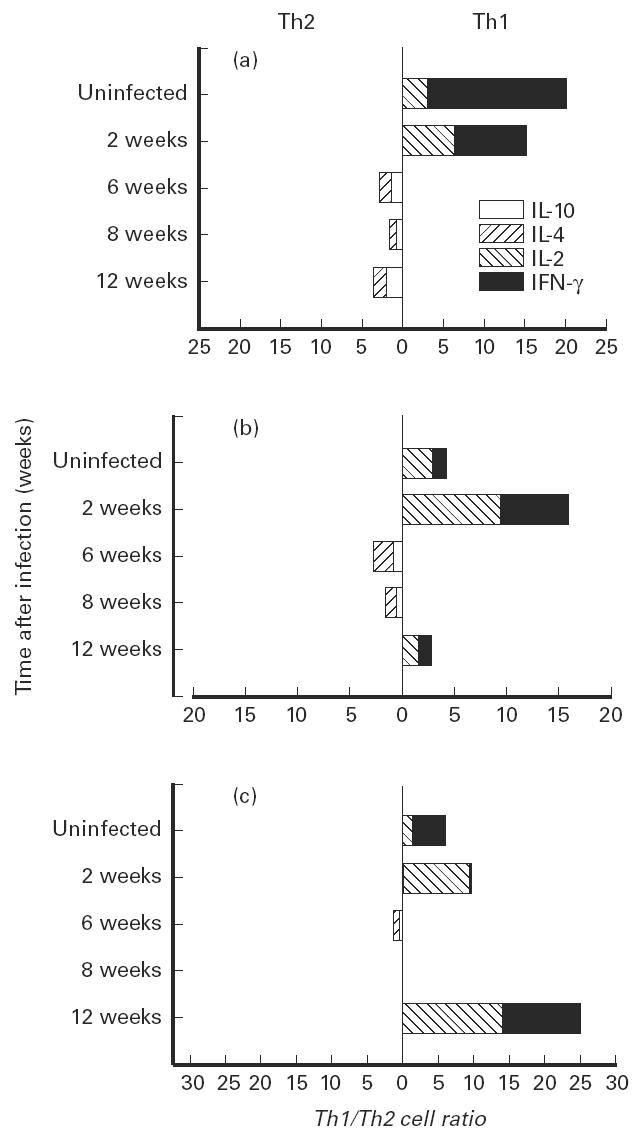
Cytokine production by CD4+ T cell subpopulations isolated from the lungs of mice during the growth of Mycobacterium tuberculosis. CD4+ cells were isolated using an IMMULAN mouse T cell isolation kit. Subpopulations of CD4+ cells were identified by the differential expression of CD45 and CD44 and the cytokines identified following permeabilization of the cells and the use of fluorochrome-labelled cytokine-specific antibody. (a) Naive cells (CD45hi, CD44lo). (b) Activated cells (CD45lo, CD44lo). (c) Memory cells (CD45lo, CD44hi). The Th1 cells are in the right panel and the Th2 cells are on the left. Uninfected mice were killed during the entire course of the experiment to serve as a control. These values did not differ over the course of the experiment. The changes in Th1/Th2 cell ratios during the course of infection were compared by anova. The effect of infection on the changes in cytokine production was significant at P < 0.003 for naive cells, P < 0.007 for activated cells and P < 0.01 for memory cells. The changes in scale represent the fold increase in one population relative to the other population. When the populations were equal the change in cell ratio was 0. Cell numbers ranged from 1 × 10⁴ to 74 × 104. The numbers of cells in the naive population decreased with time after infection, while the numbers of cells in the activated and memory populations increased.
The CD8+ T cell response in the lung, which was essentially neutral before infection (Fig. 2), was characterized by the presence of type 1 cytokines 2 weeks after infection. While the activated population remained essentially neutral until the establishment of latency (Fig. 2b), the type 1 producing cells within the memory population (Fig. 2c) exceeded the type 2 response by more then 20-fold after 8 weeks and by more then 10-fold at latency. IFN-γ appeared to be the most abundant cytokine produced by the CD8 memory T cells late in the infection.
Fig. 2.
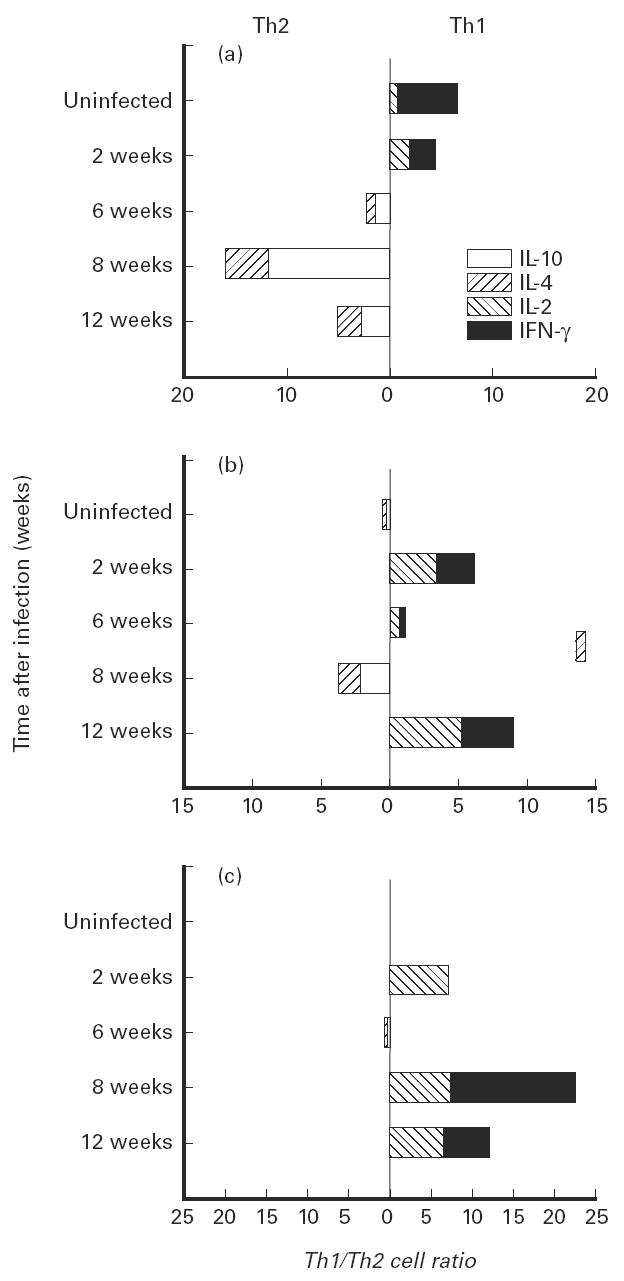
Cytokine production by CD8+ T cell subpopulations isolated from the lungs of mice during the growth of Mycobacterium tuberculosis. T cells were isolated and characterized as described in the legend for Fig. 1. (a) Naive cells. (b) Activated cells. (c) Memory cells. The effect of infection on the changes in the Th1 to Th2 cell ratios was significant for naive cells (P < 0.001), activated cells (P < 0.05) and memory cells (P < 0.001).
Cytokine production by Th0 naive, activated and memory cells
Th0 cells are characterized by the production of both type 1 and type 2 cytokines. We did not find substantial numbers of Th0 cells in either the CD4 or CD8 population during the period of active growth of the tubercle bacillus (Fig. 3). However, by week 12 after infection, at a time when the period of latency begins [12], significant numbers of Th0 naive CD4 and CD8 cells appeared in the lungs, as did a large number of Th0 CD4+ memory cells.
Fig. 3.
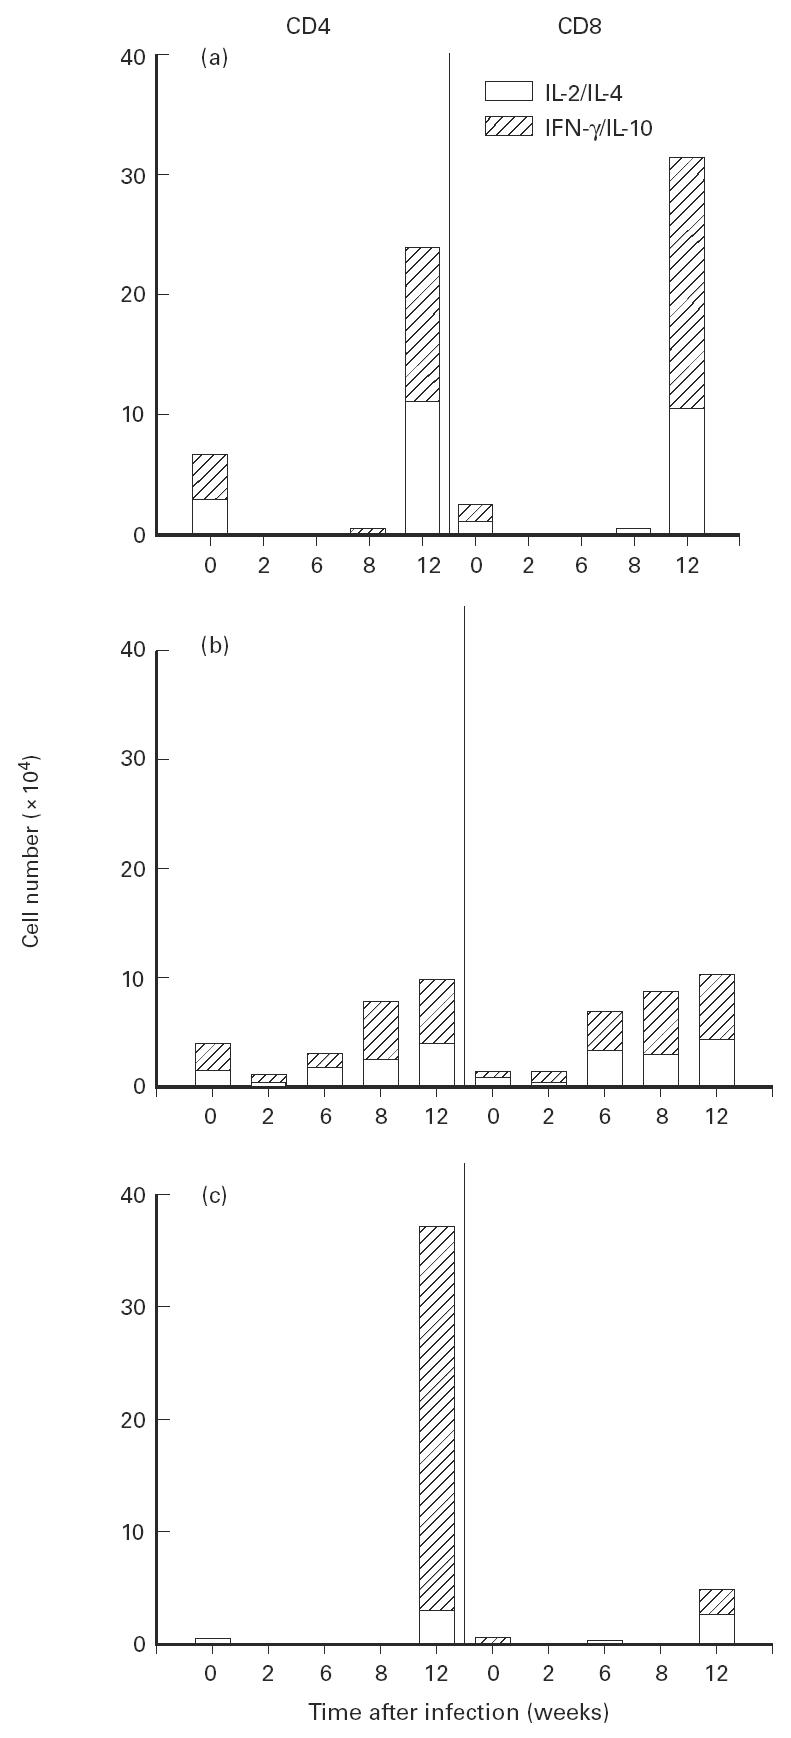
Cytokine production by CD4+ and CD8+ Th0 cells isolated from the lungs of mice during the growth of Mycobacterium tuberculosis. T cells were isolated from the lung as described in Fig. 1. (a) Naive cells. (b) Activated cells. (c) Memory cells. The effect of infection on the changes in the numbers of cells producing either IL-2 and IL-4 or IFN-γ and IL-10 is significant at 12 weeks following infection for naive cells (P < 0.01) and for CD4+ memory cells (P < 0.001).
Cytokine production by T cell populations from the mediastinal lymph node and spleen during infection by M. tuberculosis
The cytokines produced by the CD4 and CD8 memory, activated and naive populations from the lymph nodes and spleen during the course of infection with M. tuberculosis were similar to but different from those observed in the lungs. The data shown in Fig. 4 represent changes in the memory CD4 and CD8 populations in the mediastinal lymph node and spleen but are indicative of the changes in the naive and activated populations as well. A type 1 cytokine pattern was observed in these locations before infection. The pattern of cytokines present in the naive, activated and memory CD4 and CD8 cells changed to a predominantly type 2 response as infection progressed.
Fig. 4.
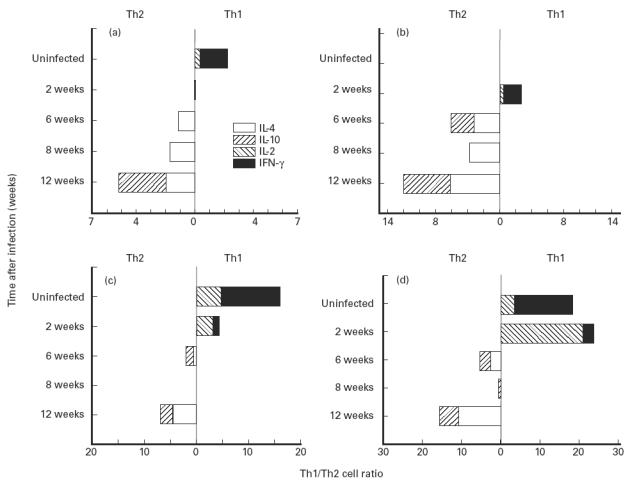
Cytokine production by CD4+ and CD8+ T cells from the mediastinal lymph node and spleen of mice during the growth of Mycobacterium tuberculosis. T cells were isolated as described in Fig. 1. (a,b) Mediastinal lymph node. (a) CD4 memory cells. (b) CD8 memory cells. (c,d) Spleen. (c) CD4 memory cells. (d) CD8 memory cells. The effect of infection on the changes in the Th1/Th2 cell ratio was significant at P < 0.01 for all cell populations.
DISCUSSION
The results of this investigation show that control of the growth of M. tuberculosis is associated with the development of a type 1 cytokine response in the lungs of mice infected intranasally. Both CD4 and CD8 cells produced predominantly type 1 cytokines. When we characterized these cells based on their differential expression of CD45 and CD44, that is into naive (CD45hi/CD44lo), activated (CD45lo/CD44lo) and memory (CD45lo/CD44hi) populations [28,30,31], we also found distinctly different patterns of intracellular cytokines. This was especially true at latency when the CD4 memory population exhibited a type 1 cytokine response while the naive and activated populations contained almost equal numbers of type 1 and type 2 producing cells. In contrast, the ratio of type 1 and type 2 CD8 cells in the activated and memory populations was equal in uninfected mice; a type 1 population predominated in the naive cells.
The cytokines present in cells in the spleen and mediastinal lymph nodes during the course of infection were different from those observed in the lungs. Since the mice were infected intranasally, the initial infection was limited to the lungs. The ratio of type 1 producing cells in the spleen and lymph nodes declined following infection, and by the time a latent infection was established there was a predominantly type 2 response in these anatomical locations. This difference may be due to the migration of type 1 producing cells from the draining mediastinal lymph nodes and spleen to the lungs [33]. These observations are similar to those reported by others, who found that a type 2 cytokine pattern emerged in the spleen of mice infected intravenously later during the course of infection, while a type 1 cytokine response predominated early [15,16,34,35].
The role of CD8 T cells in controlling the growth of M. tuberculosis has been thought to be primarily that of a cytolytic T cell. Thus, CD8 T cells lyse infected macrophages, releasing the tubercle bacillus into an environment that allows them to be taken up by recently arrived activated macrophages [4,23,24]. More recently, CD8 T cells have also been classified into Th1 and Th2 cells based on their differences in cytokine production [28]. Thus, cytokines produced by CD8 cells may also be important players in determining infectious disease outcomes. Our observations that the CD8 population contains significant numbers of type 1 cytokine producing cells at latency indicate that this population may be important in maintaining the latent state. This observation is supported by a recent study by Bonato et al. showing that CD8/CD44hi memory cells, obtained from heat shock protein (hsp)65-vaccinated mice, were able to adoptively transfer protection while the CD4/CD44hi cells were much less protective [36]. The CD8/CD44hi cells produced high levels of IFN-γ. In our studies we too found a high proportion of IFN-γ-producing CD8 memory cells at latency.
Our results reinforce the observations made by others concerning the role of CD4 T cells in controlling mycobacterial growth [13–18,34,35,37]. During the course of the growth of the bacteria it appears that there is a switch in the balance of cells that produce type 1 or type 2 cytokines. Thus, while type 1 producing cells predominated initially and later during the course of infection, there was also an increase in cells that produced type 2 cytokines. This was also the case for Th0 cells that produce both type 1 and type 2 cytokines. While the presence of IFN-γ is important in controlling mycobacterial growth, the presence of type 2 cytokines did not appear to influence the final disease outcome [36]. The host was able to control the growth of the mycobacteria and establish a latent infection. However, we have also found that a change in the cytokine pattern produced by these cells, following activation of the hypothalamic–pituitary–adrenal axis and increased levels of corticosteroids, correlates with the reactivation of growth of the tubercle bacillus (manuscript in preparation).
Acknowledgments
Supported by National Institutes of Grants MH54966, AI42901(MH45679), HL59795 and by Cancer Center Support Grant CA16058. The authors wish to thank Doug Trask for his expert technical assistance during the flow cytometric analysis.
References
- 1.Bloom BR. Tuberculosis, back to the frightening future. Science. 1992;358:538–9. doi: 10.1038/358538b0. [DOI] [PubMed] [Google Scholar]
- 2.Cooper AM, Flynn JL. The protective immune response to Mycobacterium tuberculosis. Curr Opinion Immunol. 1995;7:512–6. doi: 10.1016/0952-7915(95)80096-4. [DOI] [PubMed] [Google Scholar]
- 3.Hopewell PC. Overview of clinical tuberculosis. In: Bloom BR, editor. Tuberculosis: pathogenesis, protection and control. Washington DC: ASM Press; 1994. pp. 25–46. [Google Scholar]
- 4.Kaufmann SHE. Tuberculosis. The role of the immune response. The Immunologist. 1993;1:109–14. [Google Scholar]
- 5.Rook GAW. Macrophages and Mycobacterium tuberculosis. The key to pathogenesis. In: Zwilling BS, Eisenstein TK, editors. Macrophage pathogen interactions. New York: Marcel Dekker, Inc; 1994. pp. 249–61. [Google Scholar]
- 6.Rook GAW, Bloom BR. Mechanisms of pathogenesis in tuberculosis. In: Bloom BR, editor. Tuberculosis pathogenesis, protection and control. Washington DC: ASM Press; 1994. pp. 485–501. [Google Scholar]
- 7.Smith DW, Wiegeshaus EH, Edwards ML. The protective effects of BCG vaccination against tuberculosis. In: Bendinelli M, Friedman H, editors. Mycobacterium tuberculosis: interactions with the immune system. New York: Plenum Press; 1988. pp. 341–70. [Google Scholar]
- 8.Smith PG, Moss AR. Epidemiology of tuberculosis. In: Bloom BR, editor. Tuberculosis: pathogenesis, protection and control. Washington DC: ASM Press; 1994. pp. 47–59. [Google Scholar]
- 9.Snider DE, Jr, Raviglione M, Kochi A. Global burden of tuberculosis. In: Bloom BR, editor. Tuberculosis: pathogenesis, protection and control. Washington DC: ASM Press; 1994. pp. 3–11. [Google Scholar]
- 10.Wiegeshaus E, Balasubramanian V, Smith DW. Immunity to tuberculosis from the perspective of pathogenesis. Infect Immun. 1989;57:3671–6. doi: 10.1128/iai.57.12.3671-3676.1989. [DOI] [PMC free article] [PubMed] [Google Scholar]
- 11.Brown DH, Miles BA, Zwilling BS. Growth of Mycobacterium tuberculosis in BCG resistant and susceptible mice: establishment of latency and reactivation. Infect Immun. 1995;63:2243–7. doi: 10.1128/iai.63.6.2243-2247.1995. [DOI] [PMC free article] [PubMed] [Google Scholar]
- 12.Howard AD, Trask OJ, Weisbrode SE, Zwilling BS. Phenotypic changes in T cell populations during the reactivation of tuberculosis in mice. Clin Exp Immunol. 1998;111:309–15. doi: 10.1046/j.1365-2249.1998.00489.x. [DOI] [PMC free article] [PubMed] [Google Scholar]
- 13.Boom WH, Wallis RS, Chervenak KA. Human Mycobacterium tuberculosis reactive CD4+ T-cell clones: heterogeneity in antigen recognition, cytokine production, and cytotoxicity for mononuclear phagocytes. Infect Immun. 1991;59:2737–43. doi: 10.1128/iai.59.8.2737-2743.1991. [DOI] [PMC free article] [PubMed] [Google Scholar]
- 14.Conradt P, Kaufman SHE. Impact of antigen presenting cells on cytokine profiles of human Th clones established after stimulation with Mycobacterium tuberculosis antigens. Infect Immun. 1995;63:2079–81. doi: 10.1128/iai.63.5.2079-2081.1995. [DOI] [PMC free article] [PubMed] [Google Scholar]
- 15.Griffin JP, Orme IM. Evolution of CD4 T cell subsets following infection of naive and memory immune mice with Mycobacterium tuberculosis. Infect Immun. 1994;62:1683–90. doi: 10.1128/iai.62.5.1683-1690.1994. [DOI] [PMC free article] [PubMed] [Google Scholar]
- 16.Hernandez-Pando R, Orozcoe H, Sampier A, Pavon L, Velasquillo C, Larriva-Sahd J, Alcocer JM, Madrid MV. Correlation between the kinetics of Th1/Th2 cells and pathology in a murine model of experimental pulmonary tuberculosis. Immunology. 1996;89:26–33. [PMC free article] [PubMed] [Google Scholar]
- 17.Mutis T, Kraakman EM, Cornelisse YE, Haanen Jbag, Spits H, DeVries RRP, Ottenhoff THM. Analysis of cytokine production by Mycobacterium-reactive T cells. J Immunol. 1993;150:4641–51. [PubMed] [Google Scholar]
- 18.Orme I. Protective and memory immunity in mice infected with Mycobacterium tuberculosis. Immunobiol. 1993;191:503–8. doi: 10.1016/S0171-2985(11)80456-0. [DOI] [PubMed] [Google Scholar]
- 19.Cooper AM, Dalton DK, Stewart TA, Griffin JP, Russell DG, Orme IM. Disseminated tuberculosis in interferon-γ gene-disrupted mice. J Exp Med. 1993;178:2243–7. doi: 10.1084/jem.178.6.2243. [DOI] [PMC free article] [PubMed] [Google Scholar]
- 20.Dalton DK, Pitts-Meek S, Keshav S, Figari IS, Brakley A, Stewart TA. Multiple defects of cell function in mice with disrupted interferon-γ genes. Science. 1993;259:1739–45. doi: 10.1126/science.8456300. [DOI] [PubMed] [Google Scholar]
- 21.Flynn JL, Chan J, Triebold KJ, Dalton DK, Stewart TA, Bloom BR. An essential role for interferon γ in resistance to Mycobacterium tuberculosis infection. J Exp Med. 1993;178:2249–54. doi: 10.1084/jem.178.6.2249. [DOI] [PMC free article] [PubMed] [Google Scholar]
- 22.Kamijo R, Le J, Shapiro D, Havell EA, Huang S, Aguet M, Bosland M, Vilcek J. Mice that lack the interferon-γ receptor have profoundly altered responses to infection with Bacillus Calmette–Guérin and subsequent challenge with lipopolysaccharide. J Exp Med. 1993;178:1435–40. doi: 10.1084/jem.178.4.1435. [DOI] [PMC free article] [PubMed] [Google Scholar]
- 23.Kaufmann SHE, Ladel CH. Role of T cell subsets in immunity against intracellular bacteria: experimental infections of knock-out mice with Listeria monocytogenes and Mycobacterium bovis BCG. Immunobiol. 1994;191:509–19. doi: 10.1016/S0171-2985(11)80457-2. [DOI] [PubMed] [Google Scholar]
- 24.Flynn JL, Goldstein MM, Triebold KJ, Koller B, Bloom BR. Major histocompatibility complex class I restricted T cells are required for resistance to Mycobacterium tuberculosis infection. Proc Natl Acad Sci USA. 1992;89:12013–7. doi: 10.1073/pnas.89.24.12013. [DOI] [PMC free article] [PubMed] [Google Scholar]
- 25.Abbas AK, Murphy KM, Sher A. Functional diversity of helper T lymphocytes. Nature. 1996;383:787–93. doi: 10.1038/383787a0. [DOI] [PubMed] [Google Scholar]
- 26.Flynn JL, Goldstein MM, Chan J, et al. Tumor necrosis factor-α is required in the protective immune response against Mycobacterium tuberculosis in mice. Immunity. 1995;2:561–72. doi: 10.1016/1074-7613(95)90001-2. [DOI] [PubMed] [Google Scholar]
- 27.Mosmann TR, Coffman RL. Th1 and Th2 cells: different patterns of lymphokine secretion lead to different functional properties. Ann Rev Immunol. 1989;7:145–73. doi: 10.1146/annurev.iy.07.040189.001045. [DOI] [PubMed] [Google Scholar]
- 28.Croft M, Carter L, Swain SL, Dutton RW. Generation of polarized antigen-specific CD8 effector populations: reciprocal actions of interleukin (IL) 4 and IL-12 in promoting type 2 versus type 1 cytokine profiles. J Exp Med. 1994;180:1715–28. doi: 10.1084/jem.180.5.1715. [DOI] [PMC free article] [PubMed] [Google Scholar]
- 29.Torres M, Herrera T, Villareal H, Rich EA, Sada E. Cytokine profiles for peripheral blood lymphocytes from patients with active pulmonary tuberculosis and healthy household contacts in response to the 30 kilodalton antigen of Mycobacterium tuberculosis. Infect Immun. 1998;66:176–80. doi: 10.1128/iai.66.1.176-180.1998. [DOI] [PMC free article] [PubMed] [Google Scholar]
- 30.Croft M, Duncan DD, Swain SL. Response of naive antigen specific CD4+ T cells in vitro: characteristics and antigen presenting cell requirements. J Exp Med. 1994;176:1431–7. doi: 10.1084/jem.176.5.1431. [DOI] [PMC free article] [PubMed] [Google Scholar]
- 31.Croft M, Bradley LM, Swain SL. Naive versus memory CD4 T cells response to antigen. Memory cells are less dependent on accessory cell costimulation and can respond to any antigen presenting cell types including resting B cells. J Immunol. 1994;152:2675–85. [PubMed] [Google Scholar]
- 32.Saunders BM, Cheers C. Inflammatory response following intranasal infection with Mycobacterium avium complex: role of T cell subsets and gamma interferon. Infect Immun. 1995;63:2282–7. doi: 10.1128/iai.63.6.2282-2287.1995. [DOI] [PMC free article] [PubMed] [Google Scholar]
- 33.Morikawa Y, Tohya K, Ishida H, Matsuura N, Kakudo K. Different migration patterns of antigen presenting cells correlate with Th1/Th2 responses in mice. Immunology. 1995;85:575–81. [PMC free article] [PubMed] [Google Scholar]
- 34.Anderson P, Andersen AB, Sorensen AL, Nagai S. Recall of longed lived immunity to Mycobacterium tuberculosis. J Immunol. 1995;154:3359–72. [PubMed] [Google Scholar]
- 35.Orme IM, Roberts AD, Griffin JP, Abrams JS. Cytokine secretion by CD4 T lymphocytes acquired in response to Mycobacterium tuberculosis infection. J Immunol. 1993;151:518–25. [PubMed] [Google Scholar]
- 36.Bonato VLD, Lima VMF, Tascon RE, Lowrie BD, Silva CL. Identification and characterization of protective T cells in hsp 65 DNA vaccinated and Mycobacterium tuberculosis infected mice. Infect Immun. 1998;66:169–75. doi: 10.1128/iai.66.1.169-175.1998. [DOI] [PMC free article] [PubMed] [Google Scholar]
- 37.Orme IM. Characteristics and specificity of acquired immunologic memory to Mycobacterium tuberculosis infection. J Immunol. 1988;140:3589–93. [PubMed] [Google Scholar]