

Abstract
Tetraspanin antigens are implicated in the prognosis of different types of tumours. In this study we determine by semiquantitative reverse transcriptase-polymerase chain reaction (RT-PCR) the level of 13 tetraspan messages in 21 Burkitt lymphoma (BL) cell lines. All tumour cell lines have a common pattern of tetraspanin gene expression. There are five antigens which are detected in 90% of cell lines at high levels, CD53, CD81, CD63, SAS and CD82. Another two, CD9 and CD37, were detected in 60% of cell lines, and have a very variable level of expression. The remaining antigens, A15, CoO29, KRAG, L6, TI-1 and il-TMP, are expressed at low levels in very few cell lines without any specific pattern. The level of gene expression corresponds with the level of cell surface antigen determined by flow cytometry. The average number of tetraspan proteins expressed per cell line is six. These proteins may form subunits of an oligomeric structure with 24 transmembrane domains. There are no major differences in tetraspan expression pattern among sporadic or endemic tumours, type of translocation or Epstein–Barr virus status, suggesting the original cell of these tumours is the same, probably a late pre-B cell, at the CD9 to CD37 transition point. Tetraspanin gene expression is consistent with BL being a single entity, despite variations in other parameters.
Keywords: Burkitt lymphoma, tumour markers, tetraspanin antigen, gene expression
INTRODUCTION
Cancer is nowadays considered a genetic disease, but many of the genetic changes that differentiate a normal from a tumoural cell are quantitative rather than qualitative. Thus, in addition to genetic damage, many other important changes are related to the expression level of genes that because of their product function contribute to some aspect of the tumour phenotype [1]. The contribution to the tumoural phenotype of changes in expression levels is well known, such as the down-regulation of MHC class I antigens [2], or the over-expression of the epidermal growth factor (EGF) receptor [3] in many tumours, but so far most of the quantitative differences in tumour cells remain to be identified.
Tetraspanin or tetraspan transmembrane antigens (TST), or transmebrane-4-superfamily proteins, represent a novel group of proteins of unknown function [4,5], but whose implication in cancer biology is increasing. These proteins are defined by their structural characteristics and appear to be inversely correlated with the evolution of the tumour. There are at least 15 known tetraspanin proteins in human cells, most of them identified as tumour antigens, and having a heterogeneous cell type distribution [4,5]. In normal cells some tetraspan markers have been reported as essentially haematopoietic, such as is the case for CD53, a panleucocyte antigen, or CD37, a B cell marker [6]. Other antigens are more heterogeneous in cell type distribution, such as CD81, CD82, CD9, CD63, and SAS, and are detected in cells of very different origins. A group of them is mostly epithelial in its cellular distribution, such as CoO29, L6, II-1, il-TMP, and KRAG, which were detected in gastrointestinal tumours, such as colon, pancreas, and stomach carcinomas, or in melanomas as CD63. CD81 [7,8], CD53 and CD82 [9] have been shown to modulate proliferation and selection of T cells in the thymus. Others are involved in activation of B cells and monocytes as CD53 [10] or CD82 [9]. Several TST proteins when ligated are able to induce mobilization and changes in intracellular calcium levels in different cell types [10,11].
The expression level of several TST antigens has been correlated with the prognosis of different types of carcinomas. The initial correlation was reported for CD63/ME491 in melanomas, where the more aggressive the melanoma the lower the level of this protein [12]. More recently the level of CD82/KAI1 has been related to the evolution of prostate [13,14], pancreatic [15], and non-small lung cancer [16]. Similarly, CD9 levels in breast [17], and non-microcytic lung carcinoma [18] have also been associated to the prognosis of these tumours [19]. In all cases a low TST expression level was an indicator of poor prognosis and evolution. This effect has been postulated to result from their ability to modulate metastatic potential as a consequence of the effect of tetraspanin proteins on cell motility properties of the cell [19–21]. It has been demonstrated that several tetraspan proteins interact on the cell surface with members of the integrin family and appear to modulate cell adhesion properties [22–24]. Therefore, it is thought that TST proteins can control cell motility by acting as brakes, thus low levels will facilitate migration of the tumour cell [20,21], and the combination of different integrins with several TST proteins would determine the mobility properties of a given tumour cell [25].
Burkitt lymphomas (BL) represent a well defined type of tumour in terms of its major genetic alterations, Epstein–Barr virus (EBV) presence, and type of presentation, sporadic or endemic [26]. For this reason we determined if a specific type of tumour, such as BL, has a defined pattern of TST gene expression, with regard to number of antigens expressed, level of expression and ratio of different antigens in case they are forming a higher order superstructure [5], and concluded that these proteins have a well defined pattern in BL, thus defining the cells as a single entity from this point of view, and consequently must have a similar clinical evolution.
MATERIALS AND METHODS
Cell lines
BL cell lines used in this work were Daudi, Raji, BL60, Ly91, Namalwa, Maku, BL29, BL41, J1, JBL2, Ly65, Ly66, Ly67, BL2, BL37, BL28, BL47, P3 H1, Jijoye, Ramos, KK124 and PA682, and we also used the Bjab lymphoblastoid cell line. All cell lines, obtained from Professor G. Klein (Karolinska Institut, Stockholm, Sweden), were grown in RPMI 1640 medium supplemented with 10% fetal calf serum (FCS; Life Technologies, Paisley, UK) and antibiotics.
RNA extraction and reverse transcription
Total RNA from all cell lines was extracted with the guanidinium thiocyanate–CsCl centrifugation method [27] as previously described [28]. The reverse transcriptase (RT) reaction was performed using 2 U of Moloney Murine Leukaemia Virus reverse transcriptase from Pharmacia (Uppsala, Sweden) or Life Technologies according to manufacturer's instructions. For RT we used the following general primer: 5′-AACTGGAAGAATTCGCGGCGGCAGGAAT18-3′, specific for the polyA tail. As substrate for RT we used 1, 5 and 15 μg of total RNA in a final volume of 25 μl. After termination of the reaction the volume was diluted to a final 50 μl by the addition of DEPC-treated water.
Primers
The oligonucleotide primers used for each specific tetraspan cDNA are indicated in Table 1 with their corresponding position in the nucleotide sequence. All primers are located within the coding region of the cDNA and the size of the amplified bands corresponds to the mature, fully processed RNA messages.
Table 1.
Primers used for individual tetraspan transmembrane antigen (TST) amplification by polymerase chain reaction (PCR)

Polymerase chain reaction amplifications
From the RT reaction products we used 1/50th to determine the linearity of the polymerase chain reaction (PCR) amplification signals as a function of the starting RNA, equivalent to RT products from 20, 100 or 300 ng of total RNA, and number of PCR amplification cycles. For thermal amplification we used 2 U of Thermus brockianus DNA polymerase (Fynnzymes, Espoo, Finland), 200 μm of each deoxynucleotide, 1.5 mm MgCl2, 50 mm KCl, 0.1% Triton X-100, 10 mm Tris–HCl, pH 8.8, and 100 pmol of the corresponding primers. The reaction mix was denatured for 5 min at 94°C, followed by a programme consisting of three steps, 40 s at 94°C, 40 s at 55°C and 90 s at 72°C, followed by a final elongation step at 72°C for 5 min. These conditions were used for either 10, 20 or 30 amplification cycles. The control amplifications with primers for β-actin and glyceraldehyde-3-phosphate dehydrogenase (GAPDH) [16,18] were performed under the same conditions as those used for specific TST primers. The size of these two controls covers the size range of the PCR-amplified bands corresponding to specific TST antigen messages.
Southern blots
The PCR products were fractionated in 2% agarose gels and transferred to Hybond-N+ membranes (Amersham, Aylesbury, UK). Blots with PCR products were hybridized to the corresponding probe at high stringency conditions as previously described [28,29].
Gel quantification
The images from ethidium bromide-stained gels were captured with a CCD video camera and the light intensity of the bands was quantified using the GelWorks software package (UVP, Cambridge, UK). The blots hybridized with radioactive probes were directly quantified using a FUJIBAS-1000 phosphorimager (Fuji, Japan).
Antibodies
The MoAbs used were MEM53 (anti-CD53), MM2/57 (anti-CD9), JS64 (anti-CD81), WR17 (anti-CD37), CLB180 (anti-CD63). MoAbs were obtained from Serotec (Oxford, UK), or Pharmingen (San Diego, CA).
Flow cytometry
Briefly, 105 cells were incubated with MoAb against the indicated antigen for 30 min at 4°C. After washing in PBS the cells were stained with an FITC-labelled rabbit anti-mouse IgG antibody (Sigma, St Louis, MO). The cells were analysed in a flow cytometer EPICS 751 from Coulter Corp. (Hialeah, FL).
RESULTS
Linearity of the RT-PCR reaction
To standardize the semiquantitative approach used we first determined the linearity of the amplification, as a function of both the amount of starting total RNA used for the RT reaction and the number of PCR amplification cycles. In the RT reaction we used as starting template 1, 5 and 15 μg of total RNA, and for PCR amplification we tested 10, 20 or 30 cycles. In this PCR reaction we used 1/50 of the RT product, which is equivalent to 20, 100 and 300 ng of total RNA. This approach was used with both β-actin and GAPDH. Because of the abundance of these messages we expected them to become limiting for reaction earlier than less abundant RNA messages. To illustrate the approach in Fig. 1 we show the amplification of β-actin with three starting amounts of RT product. The reaction is linear for the three amplification numbers of cycles if the amount of RNA used for RT was lower than 5 μg. Linearity was lost when we used a 30-cycle reaction with 15 μg of total RNA as starting material for cDNA synthesis, of which the cDNA aliquot used for the PCR reaction corresponded to 1/50 (see Materials and Methods). Therefore, we only used for PCR quantification experiments the cDNA products derived from using 25–50 ng of total RNA as substrate of RT.
Fig. 1.
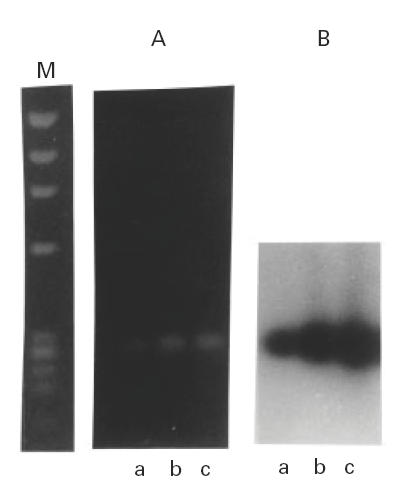
Linearity of the reverse transcriptase-polymerase chain reaction (RT-PCR) using different amounts of starting total RNA, 1 μg (a) 5 μg (b) or 15 μg (c), for the RT reaction. For the PCR amplification 1/50th of the product of RT was used. The data shown correspond to the amplification of a message that is abundant, such as β-actin, and therefore is likely to become limiting sooner than rarer messages. The proportionality on the starting amount of cDNA is detectable both in ethidium bromide-stained gel (A) and by specific hybridization (B). ϕX174 DNA digested with Hae III was used as size marker (M).
Antigen cell surface expression corresponds with PCR level of expression
To show that the relative level of PCR product is consistent with the level of cell surface antigen we determined in individual cell lines some of the antigens, such as CD53, CD81, CD63, CD9 and CD37. To illustrate this observation the data for the Raji cell line are shown in Fig. 2. The flow cytometry data correspond quite well with the variation detected by RT-PCR. As expected, there is at least 10-fold difference between CD53 and CD9, consistent with the expected difference determined by semiquantitative PCR, shown as an insert in the flow cytometry pattern. The good correlation between surface antigen level and PCR products was also applicable to the CD63 antigen; this antigen is known to localize on the membrane of intracellular granules in some cell types such as platelets [30]. In the case of cells derived from the B cell lineage, the good correlation might be explained by the fact that this lineage is not rich in intracellular granules.
Fig. 2.
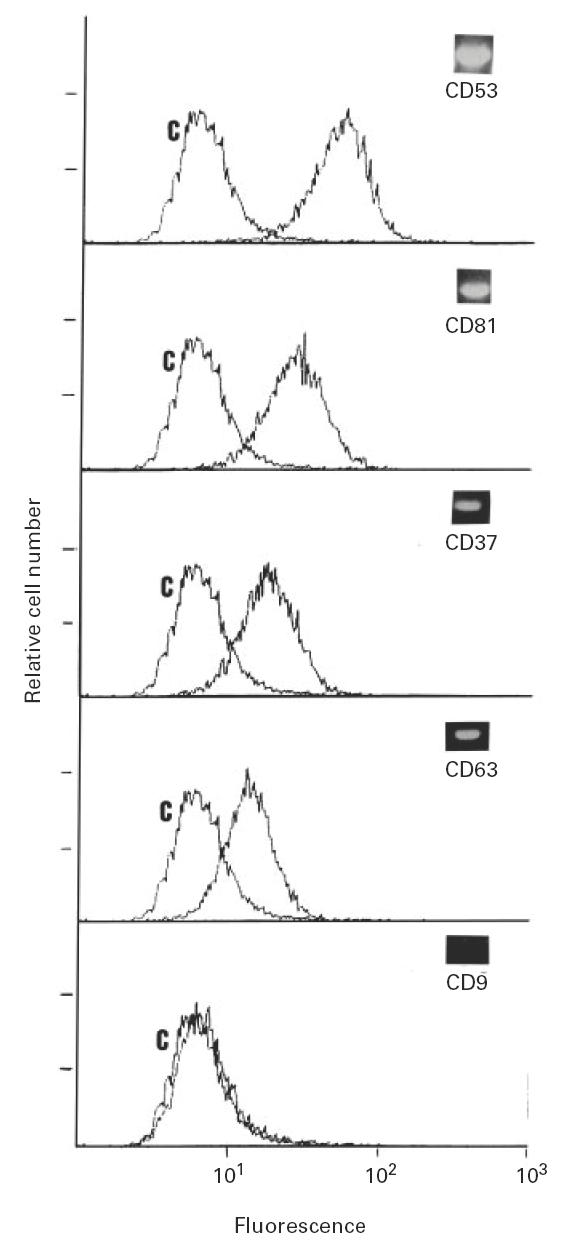
Flow cytometry pattern of the Raji cell line with several MoAbs against human CD53, CD81, CD63, CD37 and CD9 antigens, and a negative control (C). As an insert the polymerase chain reaction (PCR)-amplified band for each antigen is shown. As starting material we used 25–35 ng of total RNA for the synthesis of the cDNA which was utilized as target for 30 cycles of PCR amplification with gene-specific oligonucleotides.
TST antigen genes are expressed at different levels in BL
We determined the level of expression of the following genes coding for TST proteins, CD53, CD81, CD63, CoO29, A15, KRAG, SAS, CD37, L6, il-TMP, CD82, TI-1 and CD9. All band intensities were normalized using the internal controls, β-actin and GAPDH. In Fig. 3 we show the patterns obtained for several individual antigens in all cell lines. The size of the amplified bands corresponds to the expected value for the mature message based on the cDNA sequence (Table 1). There are antigens which are expressed in most of the cell lines at relatively very high levels (CD53, CD81). Other antigens are also expressed in many cell lines, but the level of expression is very variable, such as CD9 and CD37. These two antigens appear to follow an inverse correlation in their level of expression (Fig. 3). All the other antigens of the family are expressed in few cell lines or with a different origin, such as carcinomas or sarcomas (Fig. 3).
Fig. 3.
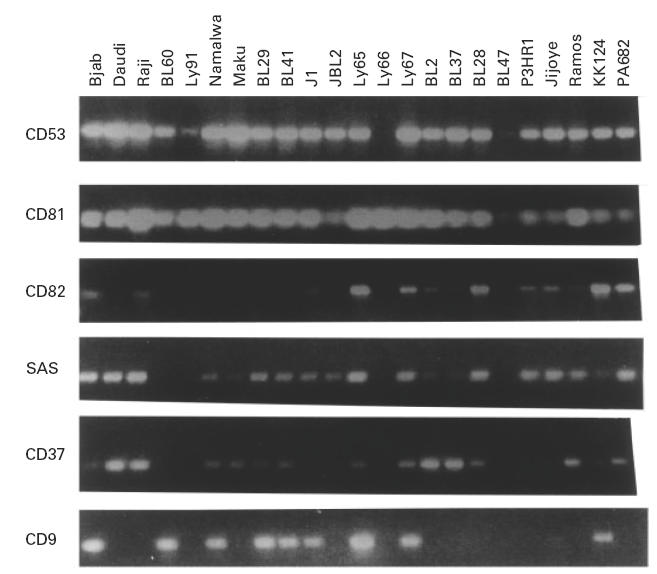
Pattern of expression of several antigens by reverse transcriptase-polymerase chain reaction (RT-PCR) in all the Burkitt lymphoma cell lines to illustrate the level and variation depending on antigen or cell line. As starting material we used 25–35 ng of total RNA for the synthesis of the cDNA which was utilized as target for 30 cycles of PCR amplification with gene-specific oligonucleotides.
Burkitt lymphomas have a common pattern of TST antigen expression
The comparison of the expression of all TST antigens in the 21 cell lines revealed that the individual pattern of expression is very similar for all cell lines. In Fig. 4 we show the expression pattern in several cell lines, where we detected antigens at high and low levels, commonly expressed antigens, or rarely expressed antigens. The minor differences were detected in the expression at low level of antigens which are mainly expressed in cells of non-lymphoid origin, and might reflect an ectopic expression, represented by A15 in the Jijoye cell line (Fig. 4).
Fig. 4.
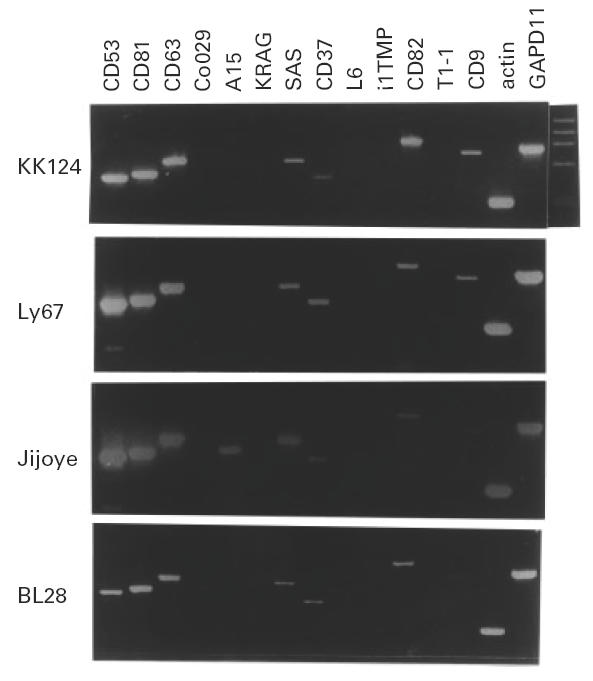
Pattern of expression of all tetraspan transmembrane antigen (TST) antigens in several cell lines (KK124, Ly67, Jijoye and BL28) to illustrate the detection of the major common pattern, the presence of strong signal for CD53, CD81 and CD63. As starting material we used 25–35 ng of total RNA for the synthesis of the cDNA which was utilized as target for 30 cycles of polymerase chain reaction (PCR) amplification with gene-specific oligonucleotides.
There is a major pattern of TST expression and six antigens are expressed per cell
Among the antigens expressed in BL, there are three groups, based on the level of expression. These data are summarized in Fig. 5, which presents the overall pattern of expression in all cell lines for all antigens. CD81, CD63, CD53 in general were expressed at very high levels. A second group of antigens include CD9, CD82, CD37 and SAS, which were expressed on almost all cell lines but their level was very variable. CD9 and CD37 level of expression appeared to be inversely correlated. The third group are TST antigens, expressed in general at relatively low levels in individual cell lines. In this latter group are the antigens known to be expressed mainly in cells of non-lymphoid origin, such as A15, KRAG or il-TMP, although A15 has also been described as the TALLA-1 antigen in T-acute lymphocytic leukaemia [31].
Fig. 5.
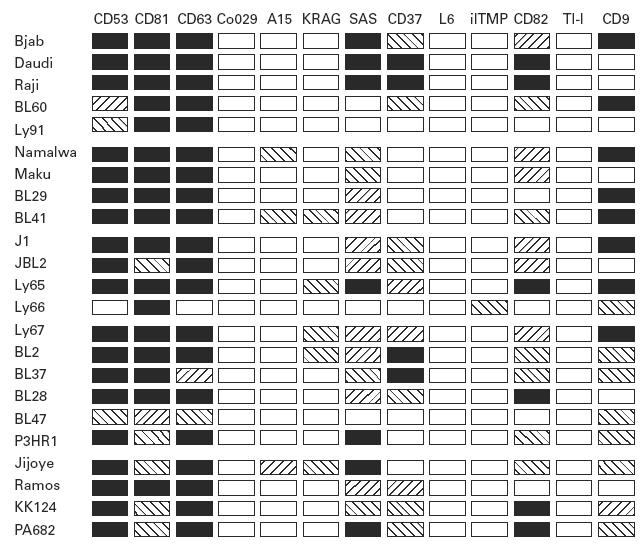
Diagram summarizing the relative expression of 13 tetraspan transmembrane antigen (TST) antigens in the Bjab lymphoblastoid cell line and in the 22 Burkitt lymphoma (BL) cell lines. For the relative quantification all samples were normalized with respect to both β-actin and glyceraldehyde-3-phosphate dehydrogenase, which cover the size range of all amplification targets. Similar results were obtained with both probes by quantification of fluorescence in agarose gels or specific hybridization signals in Southern blots.
The number of antigens expressed by each cell line was on average six, with a range of five to eight. Based on the different levels it appears as if they are major and minor subunits of a protein complex.
TST expression has no correlation with type of translocation and EBV status
The next task was to determine if any of these tetraspan subgroups could be correlated with any of the already known molecular parameters of BL. We used the EBV status, the endemic versus sporadic type of cancer, and specific translocation involving the MYC and immunoglobulin genes. We found no correlation between any of these parameters and TST gene expression.
DISCUSSION
The importance of the pattern of TST antigen expression in specific tumours is due to its potential as an indicator of the evolution of the tumour. We show in this study that the overall pattern of TST gene expression detected is very similar for all BL cell lines, and its determination by RT-PCR is in good agreement with the determination on the cell surface by flow cytometry. This major pattern of TST expression in BL cell lines is composed of antigens CD53, CD81, CD63 and SAS.
CD9 is expressed in pre-B cells within the B cell lineage, and CD37 is a more mature B cell antigen. The observation of a transition pattern in the BL cell lines between CD9 and CD37 (Fig. 3) suggests that the original cell precursor of BL might be located within the B cell developmental pathway near the transition point from CD9 to CD37 gene expression.
Variations in individual TST gene expression might account for particular phenotypic differences among tumours of the same type. The differences are observed in antigens which are mainly expressed in cells of epithelial origin. These antigens, such as A15, il-TMP, CoO29, KRAG or L6, were detected at low levels in isolated tumour cell lines. SAS is a gene which was identified as amplified and over-expressed in sarcomas, tumours of mesenchymal origin [32]. This antigen is expressed at relatively high levels in all BL cell lines studied.
There is experimental evidence for the close proximity of different TST proteins on the cell surface of B cells and monocytes, as demonstrated by experiments of energy transfer for CD53, CD81 and CD63 antigens [33]. Individual TST proteins, such as CD53, have also been shown to interact with MHC class II molecules [33]. This topological proximity has been confirmed by immunoprecipitation experiments where different TST proteins co-precipitate with each other, such as CD53, CD63, CD81 or CD9 [22–24,34]. Furthermore, the over-expression of one of them, such as CD9 by transfection, changes the proportion of different TST proteins forming the immunocomplex [35]. The expression of several TST genes in a cell line is consistent with the formation on the cell surface of a TST core complex that interacts with other membrane proteins. This has been extended in the last 2 years by the demonstration that a TST protein complex also co-precipitates with different integrins, mainly of the β1 type [23]. CD9, CD63 and CD81 have been shown to co-precipitate with α3β1, and CD63 with α6β1 [23]. The complex CD53/CD63/CD82 also co-precipitates with α4β1 [34]. These interactions with integrins might explain the effects on motility observed by transfection of CD9 [36] or CD63 [37] antigens on cell motility. In the Raji cell line, which has no detectable CD9 (Fig. 4), the reintroduction of either human or feline CD9 changes its motility properties on fibronectin and laminin [36]. These data are consistent with the clinical observations suggesting that TST levels can influence the biological evolution of the tumour, as shown in numerous tumours for several TST proteins, being the most relevant in their influence on metastatic potential.
It could be argued that TST proteins aggregate as a complex on the cell surface to form a structure of 24 transmembrane domains. Similar organization has already been described for other proteins with four transmembrane domains, as connexins [38]. Experimental evidence with uroplakin, a uroepithelial TST protein, suggests that they are indeed forming such a complex [39,40]. Around this central TST core other membrane proteins might attach, such as MHC class II [33] or integrins [25]. This type of organization would provide a link of TST antigens to cell signalling pathways, and at the same time, by changes in subunit composition, individual TST members might modulate functional properties of the molecules with which they interact [41]. The ectopic expression of TST antigens might represent phenotypic variants of the tumour if these proteins are indeed forming a membrane complex. Through the interactions between TST antigens and integrins, which allow many different possible combinations, the adhesion and migration properties of a given cell type could be specified and regulated. This aspect of tumour biology will only be understood when the function of TST proteins and their biological differences are known, and will have important consequences for the explanation of the biological behaviour of individual tumour types.
Acknowledgments
M.F. and M.Y. were supported by fellowships from Instituto de Salud Carlos III (FIS 97/4036). This work was funded by grants from Fondo de Investigación Sanitaria (FIS95/0413 and FIS98/0313) to P.A.L.
References
- 1.Sager R. Expression genetics in cancer: shifting the focus from DNA to RNA. Proc Natl Acad Sci USA. 1997;94:952–5. doi: 10.1073/pnas.94.3.952. [DOI] [PMC free article] [PubMed] [Google Scholar]
- 2.Garrido F, Ruiz-Cabello F, Cabrera T, Perez-Villar JJ, Lopez-Botet M, Duggan-Keen M, Stern PL. Implications for immunosurveillance of altered HLA class I phenotypes in human tumours. Immunol Today. 1997;18:89–95. doi: 10.1016/s0167-5699(96)10075-x. [DOI] [PubMed] [Google Scholar]
- 3.Hynes NE, Stern DF. The biology of erbB-2/neu/HER-2 and its role in cancer. Biochem Biophys Acta. 1994;1198:165–84. doi: 10.1016/0304-419x(94)90012-4. [DOI] [PubMed] [Google Scholar]
- 4.Wright MD, Tomlinson MG. The ins and outs of the transmembrane 4 superfamily. Immunol Today. 1994;15:588–94. doi: 10.1016/0167-5699(94)90222-4. [DOI] [PubMed] [Google Scholar]
- 5.Maecker HT, Todd SC, Levy S. The tetraspanin superfamily: molecular facilitators. FASEB J. 1997;11:428–42. [PubMed] [Google Scholar]
- 6.Horejsi V, Vlcek C. Novel structurally distinct family of leucocyte surface glycoproteins including CD9, CD37, CD53 and CD63. FEBS Letters. 1991;288:1–4. doi: 10.1016/0014-5793(91)80988-f. [DOI] [PubMed] [Google Scholar]
- 7.Todd SC, Lipps SG, Crisa L, Salomon DR, Tsoukas CD. CD81 expressed on human thymocytes mediates integrin activation and interleukin 2 dependent proliferation. J Exp Med. 1996;184:2055–60. doi: 10.1084/jem.184.5.2055. [DOI] [PMC free article] [PubMed] [Google Scholar]
- 8.Boismeau R, Rhein M, Fischer WH, Havran WL. A role for CD81 in early T cell development. Science. 1996;271:198–200. doi: 10.1126/science.271.5246.198. [DOI] [PubMed] [Google Scholar]
- 9.Lebel-Binay S, Lagaudriere C, Fradelizi D, Conjeaud H. CD82, member of the tetra-span-transmembrane protein family, is a costimulatory protein for T cell activation. J Immunol. 1995;155:101–10. [PubMed] [Google Scholar]
- 10.Rasmussen A, Blomhoff HK, Stokke T, Horejsi V, Smeland EB. Cross-linking of CD53 promotes activation of resting human B lymphocytes. J Immunol. 1994;153:4997–5007. [PubMed] [Google Scholar]
- 11.Boscá L, Lazo PA. Induction of nitric oxide release by MRC OX-44 (anti-CD53) through a protein kinase C-dependent pathway in rat macrophages. J Exp Med. 1994;179:1119–26. doi: 10.1084/jem.179.4.1119. [DOI] [PMC free article] [PubMed] [Google Scholar]
- 12.Hotta H, Ross AH, Huebner K, et al. Molecular cloning and characterization of an antigen associated with early stages of melanoma tumor progression. Cancer Res. 1988;48:2955–62. [PubMed] [Google Scholar]
- 13.Dong J, Lamb PW, Rinker-Schaeffer CW, Vukanovic J, Ichikawa T, Isaacs JT, Barrett JC. KAI1, a metastasis suppressor gene for prostate cancer on human chromosome 11p11.2. Science. 1995;268:884–6. doi: 10.1126/science.7754374. [DOI] [PubMed] [Google Scholar]
- 14.Dong J, Suzuki H, Pin SS, Bova GS, Schalken JA, Isaacs WB, Barrett JC, Isaacs JT. Down-regulation of the KAI1 metastasis suppressor gene during the progression of human prostatic cancer infrequently involves gene mutation or allelic loss. Cancer Res. 1996;56:4387–90. [PubMed] [Google Scholar]
- 15.Guo X, Friess H, Graber HU, Kashigawi M, Zimmerman A, Korc M, Buchler MW. KAI1 expression is up-regulated in early pancreatic cancer and decreased in the presence of metastases. Cancer Res. 1996;56:4876–80. [PubMed] [Google Scholar]
- 16.Adachi M, Taki T, Ieki Y, Huang C, Higashiyama M, Miyake M. Correlation of KAI1/CD82 gene expression with good prognosis in patients with non-small cell lung cancer. Cancer Res. 1996;56:1751–5. [PubMed] [Google Scholar]
- 17.Miyake M, Nakano K, Ieki Y, Adachi M, Huang C, Itoi S, Koh T, Taki T. Motility related protein 1 (MRP1/CD9) expression: inverse correlation with metastases in breast cancer. Cancer Res. 1995;55:4127–31. [PubMed] [Google Scholar]
- 18.Higashiyama M, Taki T, Ieki Y, et al. Reduced motility related protein-1 (MRP1/CD9) gene expression as a factor of poor prognosis in non-small cell lung cancer. Cancer Res. 1995;55:6040–4. [PubMed] [Google Scholar]
- 19.Ikeyama S, Koyama M, Yamaoko M, Sasada R, Miyake M. Suppression of cell motility and metastasis by transfection with human motility-related protein (MRP1/CD9) DNA. J Exp Med. 1993;177:1231–7. doi: 10.1084/jem.177.5.1231. [DOI] [PMC free article] [PubMed] [Google Scholar]
- 20.Marx J. New clue to prostate cancer spread. Science. 1995;268:799–800. doi: 10.1126/science.7754364. [DOI] [PubMed] [Google Scholar]
- 21.Coffey DS. Prostate cancer metastasis: talking the walk. Nature Med. 1996;2:1305–6. doi: 10.1038/nm1296-1305. [DOI] [PubMed] [Google Scholar]
- 22.Berditchevski F, Bazzoni G, Hemler ME. Specific association of CD63 with VLA-3 and VLA-6 integrins. J Biol Chem. 1995;270:17784–90. doi: 10.1074/jbc.270.30.17784. [DOI] [PubMed] [Google Scholar]
- 23.Berditchevski F, Zutter MM, Hemler ME. Characterization of novel complexes on the cell surface between integrins and proteins with 4 transmembrane domains (TM4 proteins) Mol Biol Cell. 1996;7:193–207. doi: 10.1091/mbc.7.2.193. [DOI] [PMC free article] [PubMed] [Google Scholar]
- 24.Rubinstein E, La Naour F, Lagaudriere-Gesbert C, Billard M, Conjeaud H, Boucheix C. CD9, CD63, CD81, and CD82 are components of a surface tetraspan network connected to HLA-DR and VLA integrins. Eur J Immunol. 1996;26:2657–65. doi: 10.1002/eji.1830261117. [DOI] [PubMed] [Google Scholar]
- 25.Hemler ME, Mannion BA, Berditchevski F. Association of TM4SF proteins with integrins: relevance to cancer. Biochem Biophys Acta. 1996;1287:67–71. doi: 10.1016/0304-419x(96)00007-8. [DOI] [PubMed] [Google Scholar]
- 26.Magrath I. The pathogenesis of Burkitt's lymphoma. Adv Cancer Res. 1990;53:133–270. doi: 10.1016/s0065-230x(08)60470-4. [DOI] [PubMed] [Google Scholar]
- 27.Chomczynski P, Sacchi N. Single-step method of RNA isolation by acid guanidinium thiocyanate-chloroform extraction. Anal Biochem. 1987;162:156–62. doi: 10.1006/abio.1987.9999. [DOI] [PubMed] [Google Scholar]
- 28.Gallego MI, Lazo PA. Deletion in human chromosome region 12q13-15 by integration of human papillomavirus DNA in a cervical carcinoma cell line. J Biol Chem. 1995;270:24321–6. doi: 10.1074/jbc.270.41.24321. [DOI] [PubMed] [Google Scholar]
- 29.Lazo PA, Tsichlis PN. Recombination between two integrated proviruses, one of which was inserted near c-myc in a retrovirus-induced rat thymoma: implications for tumor progression. J Virol. 1988;62:788–94. doi: 10.1128/jvi.62.3.788-794.1988. [DOI] [PMC free article] [PubMed] [Google Scholar]
- 30.Nishibori M, Cham B, McNicol A, Shalev A, Jain N, Gerrad JM. The protein CD63 is in platelet dense granules, is deficient in a patient with Hermansky–Pudlak syndrome, and appears identical to granulophysin. J Clin Invest. 1993;91:1775–82. doi: 10.1172/JCI116388. [DOI] [PMC free article] [PubMed] [Google Scholar]
- 31.Takagi S, Fujikawa K, Imai T, et al. Identification of a highly specific surface marker of T-cell acute lymphoblastic leukemia and neuroblastoma as a new member of the transmembrane 4 superfamily. Int J Cancer. 1995;61:706–15. doi: 10.1002/ijc.2910610519. [DOI] [PubMed] [Google Scholar]
- 32.Reifenberger G, Ichimura K, Reifenberger J, Elkahloun AG, Meltzer PS, Collins VP. Refined mapping of 12q13-15 amplicons in human malignant gliomas suggests CDK4/SAS and MDM2 as independent amplification targets. Cancer Res. 1996;56:5141–5. [PubMed] [Google Scholar]
- 33.Szollosi J, Horejsi V, Bene L, Angelisova P, Damjanovich S. Supramolecular complexes of MHC class I, MHC class II, CD20, and tetraspan molecules (CD53, CD81, and CD82) at the surface of a B cell line JY. J Immunol. 1996;157:2939–46. [PubMed] [Google Scholar]
- 34.Mannion BA, Berditchevski F, Kraeft S, Chen LB, Hemler ME. Transmembrane-4-superfamily proteins CD81 (TAPA-1), CD82, CD63, and CD53 specifically associate with integrin α4β1 (CD49d/CD29) J Immunol. 1996;157:2039–47. [PubMed] [Google Scholar]
- 35.Rubinstein E, Poindessous-Jazat V, Le Naour F, Billard M, Boucheix C. CD9, but not other tetraspans, associates with the B1 integrin precursor. Eur J Immunol. 1997;27:1919–27. doi: 10.1002/eji.1830270815. [DOI] [PubMed] [Google Scholar]
- 36.Shaw ARE, Domanska A, Mak A, et al. Ectopic expression of human and feline CD9 in a human B cell line confers B1 integrin-dependent motility on fibronectin and laminin substrates and enhanced tyrosine phosphorylation. J Biol Chem. 1995;270:24092–9. doi: 10.1074/jbc.270.41.24092. [DOI] [PubMed] [Google Scholar]
- 37.Radford KJ, Mallesh J, Hersey P. Suppression of human melanoma cell growth and metastasis by the melanoma-associated antigen CD63 (ME491) Int J Cancer. 1995;62:631–5. doi: 10.1002/ijc.2910620523. [DOI] [PubMed] [Google Scholar]
- 38.Beyer EC, Paul DL, Goodenough DA. Connexin family of gap junction proteins. J Mem Biol. 1990;116:187–94. doi: 10.1007/BF01868459. [DOI] [PubMed] [Google Scholar]
- 39.Wu X-R, Lin J-H, Walz T, Haner M, Yu J, Aebi U, Sun T-T. Mammalian uroplakins: a group of highly conserved urothelial differentiation-related membrane proteins. J Biol Chem. 1994;269:13716–24. [PubMed] [Google Scholar]
- 40.Walz T, Haner M, Wu X-R, Henn C, Engel A, Sun T-T, Aebi U. Towards the molecular architecture of the asymmetric unit membrane of the mammalian urinary bladder epithelium: a closed ‘twisted ribbon’ structure. J Mol Biol. 1995;248:887–900. doi: 10.1006/jmbi.1995.0269. [DOI] [PubMed] [Google Scholar]
- 41.Tedder TF, Inaoki M, Sato S. The CD19–CD21 complex regulates signal transduction thresholds governing humoral immunity and autoimmunity. Immunity. 1997;6:107–18. doi: 10.1016/s1074-7613(00)80418-5. [DOI] [PubMed] [Google Scholar]