

Abstract
An imbalance of interferon-gamma (IFN-γ)-bearing CD4+ T (Th1) cells in the pathogenesis of AD is well recognized; however, a possible role in AD for CD8+ T cells secreting Th1-like cytokines (Tc1) has not been properly addressed. In this study, two- and three-colour FACS analysis allowed us to discriminate the Th1 from the Tc1 subset. AD patients had half the number of IFN-γ-producing circulating T cells (P < 0.005; 13.6 ± 1.9% (mean ± s.d.)) compared with normal donors (25.0 ± 2.4%). Specifically, both Th1 (4.8 ± 0.7%) and Tc1 (8.1 ± 1.1%) cells in AD were decreased compared with Th1 (8.8 ± 0.8%) and Tc1 (15.0 ± 1.5%) cells in controls. Moreover, at the mRNA level, the ratios of IFN-γ/IL-4 and IFN-γ/IL-10 were lower in cells from AD patients compared with controls. In conclusion, the decrease of IFN-γ-producing T lymphocytes in AD is due to a reduction in both Th1 and Tc1 IFN-γ-secreting cells; this may not only contribute to the over-production of IgE, but also explain the high incidence of cutaneous infections observed in AD patients.
Keywords: CD4+ cells, CD8+ cells, FACS analysis, IGMB17 monoclonal antibody
INTRODUCTION
Recent studies have subdivided T helper (Th) cells into mutually exclusive Th1 (producing especially IL-2 and interferon-gamma (IFN-γ)) and Th2 (producing especially IL-4, IL-5, IL-9, IL-10 and IL-13) subsets, together with cells that exhibit an unrestricted cytokine profile (namely Th0), both in the mouse [1] and in humans [2]. Similarly, CD8+ T cells have recently been subdivided into CD8+ T cells secreting a Th1-like cytokine pattern, which are defined as Tc1 (T cytotoxic type 1) cells, versus CD8+ T cells secreting a Th2-like pattern (Tc2 cells) [3,4].
A quantitative and functional disturbance of IFN-γ-producing lymphocytes is probably important for the development of AD [5,6]. Previously, T cells producing IFN-γ were generally identified in AD either by detecting IFN-γ mRNA [2,5–7] or by measuring IFN-γ secretion in supernatants [6,8–11], thus failing both to identify IFN-γ-producing cells at the single-cell level, and to discriminate between Th1 and Tc1 cells. Moreover, other workers have published conflicting results [8,12–20].
Therefore, we have investigated T lymphocytes from patients suffering from AD and from normal volunteers, using techniques to measure both mRNA and intracellular cytokine levels.
MATERIALS AND METHODS
Antibodies and reagents
We produced IGMB17, a mouse IgG1 that reacts specifically with human IFN-γ. By binding to a conformational epitope, it inhibits IFN-γ binding to its cellular receptor and therefore inhibits all the lymphokine's biological activities [21]. FITC-labelled F(Ab)2 goat anti-mouse IgG was supplied by Dako (Glostrup, Denmark). Peridinal chlorophyll protein-conjugated MoAb Leu-4 (anti-CD3, pan-T), and PE-conjugated Leu-3 (anti-CD4; helper/inducer T) and Leu-2 (anti-CD8; suppressor/cytotoxic T), were all supplied by Becton Dickinson (Palo Alto, CA). Phorbol 12-myristate 13-acetate (PMA) and ionomycin—known to induce peripheral blood mononuclear cells (PBMC) to synthesize IFN-γ [13,14]—saponin, paraformaldehyde, l-lysine monohydrochloride, formalin, natrium metaperiodate, PBS, bovine serum albumin (BSA), and monensin were supplied by Sigma (St Louis, MO). Cell culture was performed with RPMI 1640 supplemented with 10% fetal calf serum (FCS), 2 mml-glutamine, 1 mm sodium pyruvate, 100 U/ml penicillin and 100 μg/ml streptomycin, all supplied by Gibco Labs (Paisley, UK). RNase inhibitor was from Ambion (Austin, TX). Oligo d(T)16 and Taq polymerase were from Perkin-Elmer Corp. (Norwalk, CT). Deoxynucleoside triphosphates and reverse transcriptase (RT) of Moloney murine leukaemia virus were from Boehringer Mannheim (Mannheim, Germany); primers were from Genset (Paris, France).
Subjects
Blood was obtained from 15 patients with chronic, moderate to severe AD, chosen according to well defined diagnostic criteria [22,23]. Their average age was 28.2 ± 6.8 years (six males). All patients had a history of AD dating back to early infancy and had flexural eczema. Twelve patients previously had received oral steroid, but had not been on drugs, particularly local or oral steroids, for several months.
Control blood samples were obtained from 15 age- and gender-matched healthy volunteers, who had no personal or familial history of atopic disease, asthma, or skin disease. Informed consent was obtained from all subjects.
Cell culture
PBMC were separated from heparinized blood by Ficoll–Hypaque density gradient (Pharmacia, Uppsala, Sweden). PBMC (2 × 10⁶/500 μl) were cultured in 24-well plates (Nunc, Roskilde, Denmark) in complete medium. Cells were stimulated with PMA (10 ng/ml) plus ionomycin (1 μm), in the presence of monensin (1 μm) which prevents the export of proteins from the Golgi, and leads to accumulation in the cell [24]. As previously demonstrated, PMA at a concentration of 10 ng/ml was found more efficient in inducing IFN-γ synthesis in the largest number of lymphocytes, compared with lower concentrations [21]. Plates were incubated at 37°C in 7% CO2 in air. PBMC were collected for IFN-γ staining at 6 h and 12 h after addition of stimulants.
Indirect, two- and three-colour immunofluorescence assay
PBMC indirect staining was performed as described by others [24,25], with minor alterations. Briefly, PBMC were washed three times with PBS pH 7.2, then fixed in suspension using ice-cold periodate-lysine-paraformaldehyde solution for 15 min at −10°C [26]. After two washes in PBS, the cells were resuspended to 1 × 10⁶ in 300 μl PBS containing 1% BSA (w/v), 0.2% NaN3 (v/v), and 0.1% saponin (saponin buffer). After 15 min of incubation at room temperature, the cells were spun down, and MoAb IGMB17, diluted in saponin buffer at a concentration of 1 μg/ml, was added to cultures. Cells were then incubated for 30 min at 4°C, washed twice with saponin buffer, and subsequently incubated with an appropriate concentration of FITC-labelled F(ab)2 goat anti-mouse IgG diluted in saponin buffer for 30 min at 4°C.
For two- and three-colour immunofluorescence assay, the cells, after the IFN-γ staining, were washed twice with PBS containing 1% BSA and 0.2% NaN3 and allowed to react with peridinal chlorophyll protein-conjugated anti-CD3 MoAb and/or PE-conjugated MoAbs to different cell surface antigens (namely, anti-CD4 or anti-CD8 MoAb) for 30 min at 4°C.
Flow cytometry
A fluorescence-activated flow cytometer (FACScan; Becton Dickinson) was used to analyse stained PBMC. The data were first collected into a forward scatter versus 90° scatter cytogram, which displayed cell size and degree of granularity. Fluorescence signals were measured on cells satisfying forward scatter and 90° scatter criteria, which were established so as to include small and large lymphocytes. Live gating was used to collect 10 000 events within the lymphocyte gate. Analysis was performed using Consort 32 and LYSYS II software.
RNA isolation and cDNA synthesis
PBMC obtained from the AD patients and the healthy donors were stimulated, or not, with PMA and ionomycin for 6 h, washed twice with PBS and subjected to RNA extraction as described [27]. Briefly, total RNA was extracted by the RNAzol method (Tel.Test, Friendswood, TX). RNA (1 μg) was reverse-transcribed in the presence of RT buffer (5 mm MgCl2, 50 mm KCl, and 10 mm Tris–HCl), pH 8.3, 1 mm dNTPs, Oligo d(T)16 (2.5 μm), 20 U of RNase inhibitor and 50 U of RT. The reaction mixture was incubated at 42°C for 40 min, heated to 94°C for 5 min to inactivate the RT, and cooled on ice for 5 min. The final reaction volume was diluted 1:6 with sterile distilled water and stored at −20°C until polymerase chain reaction (PCR) amplification.
Cytokine RT-PCR
PCR amplification was performed using oligonucleotide primers specific for β-actin, IFN-γ, IL-2, IL-4, IL-5 and IL-10 [28]. Primers for the ubiquitously expressed β-actin gene were used as a control for PCR efficiency. Primer specificity was determined by the production of PCR products of the predicted size. The PCR reaction mixture contained 10 mm Tris–HCl pH 8.3, 50 mm KCl, 1.5 mm MgCl2, 0.8 mm dNTP, 0.4 μm 5′ and 3′ oligonucleotide primers, and 1 U Taq polymerase. Aliquots were then amplified by 35 or 40 cycles in a DNA Thermocycler (Perkin-Elmer). Each cycle consisted of denaturation at 94°C for 1 min, followed by 1 min of annealing at 45°C (for IFN-γ and IL-5) or 50°C (for β-actin, IL-2, IL-4 and IL-10) and by 1.5 min of extension. Amplification of reverse transcribed deionized water was used as negative control to ensure that reagents were not contaminated. An aliquot of PCR product was visualized by 1.5% agarose gel electrophoresis and ethidium bromide staining. φX174 DNA HaeIII digest was used as the molecular weight marker. The gels were inspected by an ultraviolet transilluminator BioRad gel-doc 1000 that allows semiquantification of PCR products. The β-actin amplification product obtained from each sample was used as external standard, and the amount of each cytokine amplification product was evaluated as the ratio of cytokine mRNA:β-actin mRNA × 100.
Statistical analysis
The data were expressed as the mean ± s.d. and analysed by variance analysis. Student's t-test was then used to determinate significant differences between group averages. Significance was defined as P < 0.05.
RESULTS
IFN-γ-producing T cells and T cell subsets are significantly decreased in AD patients compared with healthy donors
PBMC obtained from 15 AD patients and 15 healthy individuals were tested for IFN-γ expression after PMA and ionomycin stimulation. Peaks of cytokine expression were always observed after 12 h of mitogenic stimulation in both patients and controls. The percentage of IFN-γ-expressing T lymphocytes was decreased in AD patients compared with healthy individuals. Specifically, 25.0 ± 2.4% (mean ± s.d.) T lymphocytes from healthy donors were IFN-γ+, while only 13.6 ± 1.9% T lymphocytes from patients with AD were IFN-γ+ (Table 1). The difference between the two groups was statistically significant (P < 0.001).
Table 1.
IFN-γ-producing T cells and T cell subsets are significantly decreased in AD patients compared with healthy donors
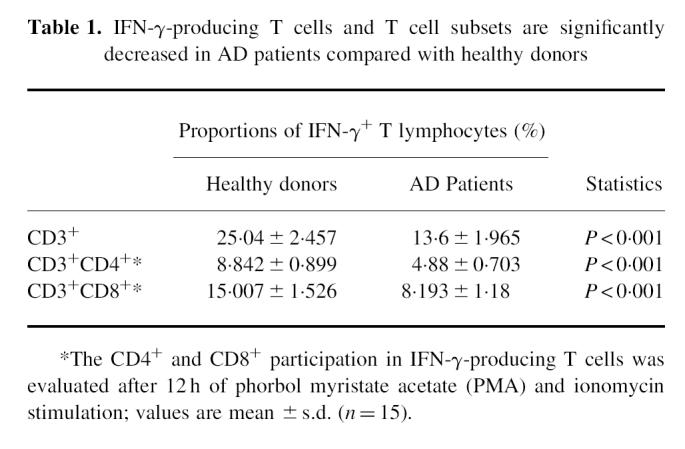
The characterization of CD4+ and CD8+ T cell subsets participating in IFN-γ production after a 12-h culture was limited because of the down-regulation of CD4 and, to a lesser extent, CD8 antigen expression by PMA activity. The percentage of IFN-γ-expressing CD4+ and CD8+ T cell subsets was decreased in the AD patients compared with healthy individuals. Figure 1 shows an example of three-colour staining phenotype analysis of IFN-γ-expressing T cell subsets from a patient with AD (Fig. 1a,c) and from a healthy individual (Fig. 1b,d). As shown in Table 1, some Th1 cells were detected in AD, 4.8 ± 0.7%, compared with 8.8 ± 0.8% in healthy donors; on the other hand, 8.1 ± 1.1% Tc1 cells were detected in AD, compared with 15.0 ± 1.5% in healthy donors.
Fig. 1.
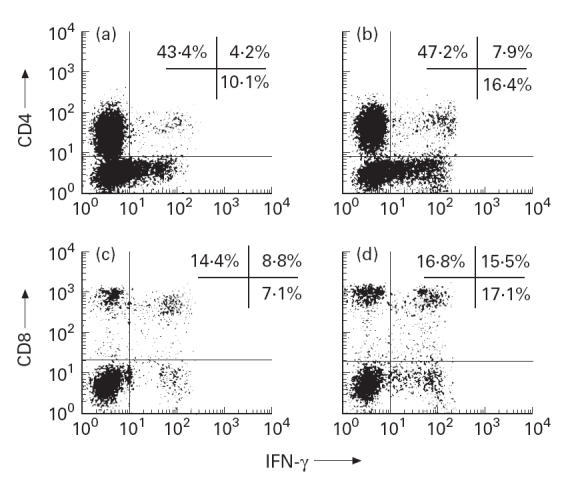
Flow cytometry analysis of CD4 versus IFN-γ (a,b) and CD8 versus IFN-γ (c,d) shows that production of IFN-γ by CD8+ (Tc1) cells exceeds production of IFN-γ by CD4+ (Th1) cells, both in AD and in control. Peripheral blood mononuclear cells (PBMC) from randomly selected AD patient (a,c) and healthy donor (b,d) were stained using anti-IFN-γ MoAb and FITC-labelled F(ab)2 goat anti-mouse IgG (abscissa), and subsequently incubated with a PE-conjugated anti-CD4 MoAb (a,b) or anti-CD8 MoAb (c,d) (ordinate), and counterstained for the surface expression of the CD3 marker, using a peridinal chlorophyll protein-conjugated MoAb Leu-4. IFN-γ expression was evaluated on the CD3-gated lymphocyte subpopulation.
Tc1 cells outnumber Th1 cells, both in AD patients and in healthy donors
Of IFN-γ-bearing T cells, 35.4 ± 14.6% were CD4+ (Th1) in AD patients (35.7 ± 14.3% in healthy donors), whereas 60.0 ± 14.1% of IFN-γ-bearing T cells were CD8+ (Tc1) (60.0 ± 12.8% in healthy donors).
Freshly collected unstimulated PBMC from AD patients had decreased production of IFN-γ and an increased production of type 2 cytokines
Figure 2 shows the pattern of cytokine gene expression in PBMC from a representative AD patient and a healthy donor. Amplification with β-actin primers produced strong signals, indicating consistency in RNA extraction, cDNA synthesis and PCR efficiency in all the samples tested.
Fig. 2.
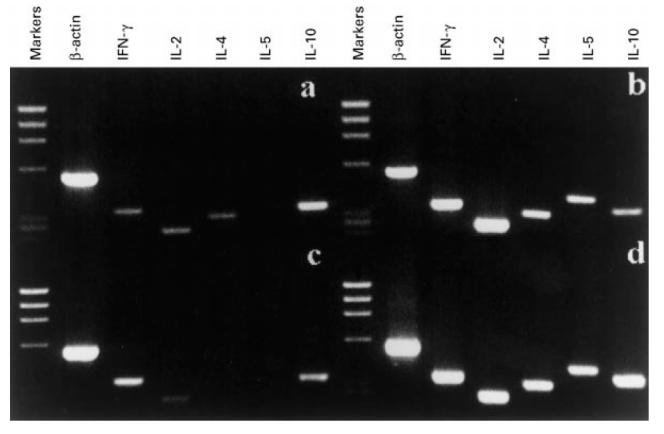
Cytokine mRNA profile of unstimulated peripheral blood mononuclear cells (PBMC) reveals decreased production of IFN-γ, production of IL-4, and increased production of IL-10 in AD patient compared with healthy donor. Cytokine gene expression in PBMC of an AD patient (a,b) and a healthy subject (c,d), unstimulated (a,c) and stimulated for 6 h with phorbol myristate acetate (PMA) and ionomycin (b,d). Reverse transcriptase-polymerase chain reaction (RT-PCR) products were analysed on a 15% agarose gel and detected by ethidium bromide staining. The molecular weight marker used is φX174 DNA HaeIII digest.
Freshly collected unstimulated PBMC from the 15 AD patients were analysed for baseline cytokine gene expression and compared with the pattern of cytokine gene expression obtained from unstimulated PBMC of the 15 healthy individuals. As shown in Fig. 2, PBMC from the AD patients (Fig. 2a) spontaneously expressed IL-4, which was not expressed in PBMC from the healthy individuals (Fig. 2c). Moreover, PBMC from AD patients expressed lower levels of IFN-γ and higher levels of IL-10 compared with control PBMC.
The semiquantification of PCR products revealed that the ratio IFN-γ:β-actin mRNA × 100 was 15.33 ± 2.84 in the AD patients, and 22.53 ± 1.84 in the healthy subjects, and the IL-10:β-actin mRNA × 100 ratio was 35.1 ± 5.55 in the AD subjects and 18.13 ± 3.24 in the healthy donors.
Specific PCR products for all the cytokines tested were observed in mitogen-stimulated PBMC from AD patients (Fig. 2b) and healthy subjects (Fig. 2d), showing that the AD subjects maintain an intact capability to express both type 1 and type 2 cytokines.
DISCUSSION
We have shown that the percentage of IFN-γ+ T cells in patients with AD is significantly decreased compared with normal volunteers; similarly, the ratio of IFN-γ:β-actin mRNA in PBMC of patients with AD is lower when compared with normal volunteers. This confirms the work of several other groups who have found that IFN-γ-secreting cells are decreased in AD patients [8,12–15,18–20]. By contrast, only two previous reports have shown increased or equivalent levels of IFN-γ production in AD compared with normal controls [16,17].
The quantitative demonstration that, of IFN-γ-producing T cells, Tc1 cells outnumber Th1 in both AD patients and controls is consistent with the fact that most CD8+ T cells produce IFN-γ and, at least in the rat, are the major source of IFN-γ in the spleen [29]. Indeed, CD8+ T cells have often been considered a rather uniform class producing IFN-γ and tumour necrosis factor (TNF) [30]. CD8+ cells activated with either mitogens or antigens developed the typical CD8+, cytotoxic, IFN-γ-producing phenotype. Interestingly, priming with IL-12 generated CD4 effectors producing both IL-2 and IFN-γ, whilst CD8 effectors produced no IL-2 but elevated quantities of IFN-γ [31]. Finally, CD8+ T cells often secrete a Th1-like cytokine pattern: previous difficulty in identifying Tc2 cells may have been due to the strong bias of CD8+ T cells toward differentiation into IFN-γ-producers [3].
Our results demonstrate that not only was the Th1 subset affected in AD, but a parallel decrease was also evident for Tc1 cells. Since the total IFN-γ-producing lymphocytic population, including both Th1 and Tc1 cells, was significantly defective in AD without any imbalance of the Th1/Tc1 ratio, both Th1 and Tc1 cells are likely to be involved in the pathophysiology of AD. Moreover, the decrease in numbers of Tc1 cells with their high cytolytic capacity [32] may be a contributing factor to the increased incidence of cutaneous infections observed in AD patients [33]. Furthermore, this Tc1 defect could favour IgE over-production: it is known that Tc1 cells are able to regulate IgE production, both by the inhibitory effect of IFN-γ on B cells and by affecting the differentiation and function of the Th2 cells which support IgE production [29].
On the other hand, the Tc2 subset is not decreased in AD, and an increase in IL-4-producing CD8+ cells in the peripheral blood of AD patients has been previously documented [19]. Similarly, we show that PBMC from AD patients had increased Th2 and Tc2 cytokines (namely, IL-4 and IL-10), whilst IFN-γ mRNA was decreased. Such a relative predominance of Tc2 over Tc1 cells in AD may induce at least three effects: (i) although Tc2 cells do not help B cells in a cognate helper assay [34] due to their strong cytolytic activity, it is possible that B cell help by Tc2 cells occurs ‘in vivo’, due to either Tc2 expression of CD40L [35] or Tc2 secretion of type 2 cytokines which can help B cells, activated by Th2 cells, to produce IgE [3]; (ii) the Th2-like CD8+ cells may suppress CD8+ Tc1 cell-mediated cytotoxicity and IFN-γ production, thereby predisposing AD patients to cutaneous infections; (iii) alternatively, Tc2 cells may have a desirable anti-inflammatory role, and reduce the inflammation associated with AD [36].
REFERENCES
- 1.Mosmann TR, Cherwinski H, Bond MW, Giedlin MA, Coffman RL. Two types of murine helper T cell clones. I. Definition according to profiles of lymphokine activities and secretory proteins. J Immunol. 1986;136:279–85. [PubMed] [Google Scholar]
- 2.Del Prete GF, De Carli M, Mastromauro C, Macchia D, Biagiotti R, Ricci M. Purified protein derivative of Mycobacterium tuberculosis and excretory/secretory antigen(s) of Toxocara canis expand in vitro human T cell with stable and opposite (type 1 T helper or type 2 T helper) profile of cytokine production. J Clin Invest. 1991;88:346–50. doi: 10.1172/JCI115300. [DOI] [PMC free article] [PubMed] [Google Scholar]
- 3.Mosmann TR, Sad S. The expanding universe of T-cell subsets. Th1, Th2 and more. Immunol Today. 1996;17:138–46. doi: 10.1016/0167-5699(96)80606-2. [DOI] [PubMed] [Google Scholar]
- 4.Romagnani S. The Th1/Th2 paradigm. Immunol Today. 1997;18:263–6. doi: 10.1016/s0167-5699(97)80019-9. [DOI] [PubMed] [Google Scholar]
- 5.Ohmen JD, Hanifin JM, Nickoloff BJ, et al. Overexpression of IL-10 in atopic dermatitis. J Immunol. 1995;154:1956–63. [PubMed] [Google Scholar]
- 6.Werfel T, Morita A, Grewe M, Renz H, Wahn U, Krutmann J, Kapp A. Allergen specificity of skin-infiltrating T cells is not restricted to a type-2 cytokine pattern in chronic skin lesions of atopic dermatitis. J Invest Dermatol. 1996;107:871–6. doi: 10.1111/1523-1747.ep12331164. [DOI] [PubMed] [Google Scholar]
- 7.Grewe M, Gyufko K, Schoph E, Krutman J. Lesional expression of interferon-γ in atopic eczema. Lancet. 1994;343:25–36. doi: 10.1016/s0140-6736(94)90879-6. [DOI] [PubMed] [Google Scholar]
- 8.Wierenga EA, Snoek M, de Groot C, Chretien I, Bos JD, Jansen HM, Kapsenberg ML. Evidence for compartmentalization of functional subsets of CD4+ T lymphocytes in atopic patients. J Immunol. 1990;144:4651–6. [PubMed] [Google Scholar]
- 9.Reinhold U, Kukel S, Goeden B, Neumann C, Kreysee HW. Functional characterization of skin-infiltrating lymphocytes in atopic dermatitis. Clin Exp Immunol. 1991;86:444–8. doi: 10.1111/j.1365-2249.1991.tb02951.x. [DOI] [PMC free article] [PubMed] [Google Scholar]
- 10.Kapsenberg ML, Wierenga EA, Stiekema FE, Tiggelman AM, Bos JD. Th1 lymphokine production profiles of nickel-specific CD4+ T-lymphocyte clones from nickel contact allergic and non-allergic individuals. J Invest Dermatol. 1992;82:825–32. doi: 10.1111/1523-1747.ep12494841. [DOI] [PubMed] [Google Scholar]
- 11.Reekers R, Beyer K, Niggemann B, Wahn U, Freihorst J, Kapp A, Werfel T. The role of circulating food antigen-specific lymphocytes in food allergic children with atopic dermatitis. Br J Dermatol. 1996;135:935–41. doi: 10.1046/j.1365-2133.1996.d01-1098.x. [DOI] [PubMed] [Google Scholar]
- 12.Reinhold U, Wehrmann W, Kuteel S, Kreysel HW. Evidence that defective interferon-gamma production in atopic dermatitis patients is due to intrinsic abnormalities. Clin Exp Immunol. 1990;79:374–9. doi: 10.1111/j.1365-2249.1990.tb08098.x. [DOI] [PMC free article] [PubMed] [Google Scholar]
- 13.Wierenga EA, Snoek M, Jansen HM, Bos JD, van Lier RAW, Kapsenberg ML. Human atopen-specific types 1 and 2 helper cell clones. J Immunol. 1991;147:2942–9. [PubMed] [Google Scholar]
- 14.Van Der Heijden F, Wierenga EA, Bos JD, Kapsenberg JL. High frequency of IL-4 producing CD4+ allergen-specific T lymphocytes in atopic dermatitis lesional skin. J Invest Dermatol. 1991;97:389–94. doi: 10.1111/1523-1747.ep12480966. [DOI] [PubMed] [Google Scholar]
- 15.Jujo K, Renz H, Abe J, Gelfand EW, Leung DY. Decreased interferon-gamma and increased interleukin-4 production in atopic dermatitis promotes IgE synthesis. J Allergy Clin Immunol. 1992;90:323–31. doi: 10.1016/s0091-6749(05)80010-7. [DOI] [PubMed] [Google Scholar]
- 16.Tang M, Kemp A. Production and secretion of interferon-gamma (IFN-γ) in children with atopic dermatitis. Clin Exp Immunol. 1994;95:66–72. doi: 10.1111/j.1365-2249.1994.tb06016.x. [DOI] [PMC free article] [PubMed] [Google Scholar]
- 17.Jung T, Lack G, Schauer U, Uberuck W, Renz H, Gelfand EW, Rieger CHL. Decreased frequency of interferon-γ- and interleukin-2-producing cells in patients with atopic diseases measured at the single cell level. J Allergy Clin Immunol. 1995;96:515–27. doi: 10.1016/s0091-6749(95)70296-2. [DOI] [PubMed] [Google Scholar]
- 18.Lester MR, Hofer MF, Gately M, Trumble A, Leung DYM. Down-regulating effects of IL-4 on the IFN-gamma response in atopic dermatitis. J Immunol. 1995;154:6174–81. [PubMed] [Google Scholar]
- 19.Nakazawa M, Sugi N, Kawaguchi H, Ishii N, Nakajima H, Minami M. Predominance of type 2 cytokine-producing CD4+ and CD8+ cells in patients with atopic dermatitis. J Allergy Clin Immunol. 1997;99:673–82. doi: 10.1016/s0091-6749(97)70030-7. [DOI] [PubMed] [Google Scholar]
- 20.Nakagawa S, Aiba S, Tagami H. Decreased frequency of interferon-γ-producing CD4+ cells in the peripheral blood of patients with atopic dermatitis. Exp Dermatol. 1998;7:112–8. doi: 10.1111/j.1600-0625.1998.tb00310.x. [DOI] [PubMed] [Google Scholar]
- 21.Caruso A, Canaris AD, Licenziati S, et al. CD4+ and CD8+ lymphocytes of patients with AIDS synthesize increased amounts of interferon-γ. J AIDS Human Retrovir. 1995;10:462–70. doi: 10.1097/00042560-199512000-00010. [DOI] [PubMed] [Google Scholar]
- 22.Hanifin JM, Rajka G. Diagnostic features atopic dermatitis. Acta Dermatol Venereol. 1980;92:44–50. [Google Scholar]
- 23.Leung DYM, Rhodes AR, Geha PS, Schneider L, Ring J. Atopic dermatitis. In: Fitzpatrick TB, Eisen AZ, Wolff K, et al., editors. Dermatology in general medicine. New York: McGraw-Hill; 1993. pp. 1543–64. [Google Scholar]
- 24.Sanders B, Andersson J, Andersson U. Assessment of cytokines by immunofluorescence and the paraformaldehyde-saponin procedure. Immunol Rev. 1991;119:65–93. doi: 10.1111/j.1600-065x.1991.tb00578.x. [DOI] [PubMed] [Google Scholar]
- 25.Jung T, Schauer U, Heusser C, Neumann C, Rieger C. Detection of intracellular cytokines by flow cytometry. J Immunol Methods. 1993;157:197–207. doi: 10.1016/0022-1759(93)90158-4. [DOI] [PubMed] [Google Scholar]
- 26.Borthwich NJ, Bofill M, Gombert WM, et al. Lymphocyte activation in HIV-1 infection. II. Functional defects of CD28− T cells. AIDS. 1994;8:431–41. doi: 10.1097/00002030-199404000-00004. [DOI] [PubMed] [Google Scholar]
- 27.Graziosi C, Pantaleo G, Gantt KR, Fortin JP, Demarest JF, Cohen OJ, Sékaley RP, Fauci AS. Lack of evidence for the dichotomy of Th1 and Th2 predominance in HIV-infected individuals. Science. 1994;265:248–52. doi: 10.1126/science.8023143. [DOI] [PubMed] [Google Scholar]
- 28.Yamamura M, Wang XH, Ohmen JD, Uyemura K, Rea TH, Bloom BR, Modlin RL. Cytokine patterns of immunologically mediated tissue damage. J Immunol. 1992;149:1470–5. [PubMed] [Google Scholar]
- 29.Kemeny DM, Noble A, Holmes BJ, Diaz-Sanchez D. Immune regulation: a new role for the CD8+ T cell. Immunol Today. 1994;15:107–12. doi: 10.1016/0167-5699(94)90152-X. [DOI] [PubMed] [Google Scholar]
- 30.Fong TAT, Mosmann TR. Alloreactive murine CD8+ T cell clones secrete the Th1 pattern of cytokines. J Immunol. 1990;144:1744–52. [PubMed] [Google Scholar]
- 31.Croft M, Carter L, Swain SL, Dutton RW. Generation of polarized antigen-specific CD8 effector populations: reciprocal action of interleukin (IL)-4 and IL-12 in promoting type 2 versus type 1 cytokine profiles. J Exp Med. 1994;180:1715–28. doi: 10.1084/jem.180.5.1715. [DOI] [PMC free article] [PubMed] [Google Scholar]
- 32.Carter LL, Dutton RW. Relative perforin- and Fas-mediated lysis in T1 and T2, CD8 effector populations. J Immunol. 1995;155:1028–31. [PubMed] [Google Scholar]
- 33.Lacour M, Hauser C. The role of microorganisms in atopic dermatitis. Clin Rev Allergy. 1993;11:491–503. [PubMed] [Google Scholar]
- 34.Sad S, Marcotte R, Mosmann TR. Cytokine-induced differentiation of precursor mouse CD8+ T cells into cytotoxic CD8+ T cells secreting Th1 or Th2 cytokines. Immunity. 1995;2:271–9. doi: 10.1016/1074-7613(95)90051-9. [DOI] [PubMed] [Google Scholar]
- 35.Cronin DC, Stack R, Fitch FW. IL-4 producing CD8+ T cell clones can provide B cell help. J Immunol. 1995;154:3118–27. [PubMed] [Google Scholar]
- 36.Seder RA, Le Gros GG. The functional role of CD8+ T helper type 2 cells. J Exp Med. 1995;181:5–7. doi: 10.1084/jem.181.1.5. [DOI] [PMC free article] [PubMed] [Google Scholar]