Abstract
The objective of this study was to identify an immunological correlate of protection for a two-component subunit vaccine for plague, using a mouse model. The components of the vaccine are the F1 and V antigens of the plague-causing organism, Yersinia pestis, which are coadsorbed to alhydrogel and administered intramuscularly. The optimum molar ratio of the subunits was determined by keeping the dose-level of either subunit constant whilst varying the other and observing the effect on specific antibody titre. A two-fold molar excess of F1 to V, achieved by immunizing with 10 μg of each antigen, resulted in optimum antibody titres. The dose of vaccine required to protect against an upper and lower subcutaneous challenge with Y. pestis was determined by administering doses in the range 10 μg F1 + 10 μg V to 0.01 μg F1 + 0.01 μg V in a two-dose regimen. For animals immunized at the 1-μg dose level or higher with F1 + V, an increase in specific IgG1 titre was observed over the 8 months post-boost and they were fully protected against a subcutaneous challenge with 105 colony-forming units (CFU) virulent Y. pestis at this time point. However, immunization with 5 μg or more of each subunit was required to achieve protection against challenge with 107 CFU Y. pestis. A new finding of this study is that the combined titre of the IgG1 subclass, developed to F1 plus V, correlated significantly (P < 0.05) with protection. The titres of IgG1 in vaccinated mice which correlated with 90%, 50% and 10% protection have been determined and provide a useful model to predict vaccine efficacy in man.
Keywords: sub-unit vaccine, plague, immunological correlates, protection
INTRODUCTION
The ancient disease of plague is still endemic in parts of the world and its resurgence from time-to-time, as in the 1994 epidemic in India, is feared [1]. Existing vaccines licensed for human use to protect against infection with Yersinia pestis, the causative organism of plague, suffer serious drawbacks. These killed whole-cell vaccines have been used for many years, but they are reactogenic, require frequent boosting to maintain adequate immunity and there is evidence that they do not induce appropriate immunity to protect against the pneumonic form of plague [2, 3]. A subunit vaccine, comprising the Fraction 1 (F1) and V antigens of Y. pestis, provides superior protection against parenteral and against aerosol challenge with virulent Y. pestis [4]. Recent studies have shown that multiple doses of the single subunits can protect mice against challenge with wild-type Y. pestis [5–8]. Several studies have demonstrated that by combining the subunits in a vaccine an additive protective effect is achieved [5, 9]. A recent study has demonstrated that intramuscular administration of two doses of the combined subunit vaccine in mice confers protection against the pneumonic form of the disease, and that protection was mediated largely by a high level of IgG systemically and in the lung [4]. Further, passive immunization of severe combined immunodeficient (SCID) mice with F1- and V-specific IgG conferred protection against s.c. challenge with plague [10].
Thus evidence is accumulating to indicate that protection against plague is antibody-mediated and this would be appropriate to counter this predominantly extracellular infection. In an effort to determine the operative protective mechanism, an immunological correlate of protection has been sought in this study. This has entailed an optimization of the vaccine formulation. To this end, the optimum molar ratio of the vaccine components and also the dose levels of the vaccine required to achieve protection against an escalating challenge with Y. pestis have been investigated. This has enabled the determination of protective titres and a positive correlation between specific antibody titre of the IgG1 subclass to the F1 + V subunits and the degree of protection conferred against plague.
MATERIALS AND METHODS
Vaccines
The components of the subunit vaccine were prepared as previously described [5]. Briefly, the F1 antigen was precipitated from the supernate of Y. pestis grown at 37°C by the addition of 40% (w/v) ammonium sulphate and purified by repeated resuspension and centrifugation of the pellet in 20 mm Tris–HCl at pH 8 [5]. The V antigen was produced as a fusion protein with glutathione-s-transferase in Escherichia coli, cleaved with Factor Xa (Boehringer Mannheim UK Ltd, Lewes, UK) for 18 h at 22°C and purified by affinity absorption [5]. The killed whole-cell vaccine for plague was purchased from the Greer Labs (Lenoir, NC) as a formaldehyde-killed suspension (2 × 10⁹/ml) of Y. pestis.
Animals
Female 6-week-old BALB/c mice (Charles River UK Ltd, Margate, UK), free of mouse pathogens, were used throughout this study. All animal experimentation strictly adhered to the 1986 Scientific Procedures Act and to the Guidance on the Operation of the Animals (Scientific Procedures) Act, as promulgated by the Home Office in the UK and adopted by the ethics committee on animal experimentation within this research establishment.
Blood and tissue sampling
Serial blood samples were taken through the immunization schedule on the stated days for each study by superficial venepuncture of the tail veins of six animals per group, selected at random (representing one quarter of each group). Equal aliquots of these individual samples were pooled to determine the group mean antibody titre to F1 and V. At the end of the schedule, and concomitant with challenge of a cohort of vaccinees, six to eight animals per group were anaesthetized intraperitoneally with 6 μg of Domitor (SmithKline Beecham, UK) and 3 mg of Ketalar (Parke-Davies, Pontypool, UK) prior to the collection of a terminal blood sample by cardiac puncture. These animals were humanely killed by cervical dislocation and their spleens removed and amalgamated by group into ice-cold Dulbecco's modified Eagle's medium (DMEM; Sigma, Poole, UK) for subsequent analysis.
Analysis of blood samples
The measurement of isotype and titre of the antibody response was performed on serum samples by means of a modified ELISA [4]. Peroxidase conjugates against mouse IgG, IgG1, IgG2a, IgG2b and IgG3 (Sera-Lab, Crawley Down, UK) were each used at a maximum dilution of 1:2000. These secondary antibody conjugates have previously been shown to be entirely specific for the homologous IgG subclass and not to be cross-reactive with any heterologous IgG subclass [11]. Antibody titre was estimated as the maximum dilution of serum giving an absorbance414nm reading 0.1 units over background and is presented as log10 of the reciprocal of that dilution. From this, mean titres have been derived per treatment group.
Analysis of antibody secretion by spleen cells
Spleens were amalgamated by treatment group, prior to the preparation of crude suspensions of spleen cells for the determination of quantity and specificity of antibody secretion in vitro, by means of a modified ELISA as described previously [4]. The amount of antibody secreted by a suspension of cells representative of each group was quantified by measuring A414nm and the mean log10 antibody titre was derived ± s.e.m.
Purification of splenic T cells
Lymphocytes were isolated by density gradient centrifugation from the crude spleen cell suspensions prepared for each immunization group. Subsequently, T cells were isolated by immunomagnetic separation as described previously [12] for the assay of in vitro recall responses to F1 and V antigens. The in vitro recall response to equimolar amounts (0.18 nmol) of F1 (3.2 μg/ml) and V (6.3 μg/ml) was measured in T cells aliquoted at constant dilution into microtitre wells precoated with autologous peritoneal macrophages. Proliferation was quantified by the incorporation of 3H-thymidine into cells from which the stimulation index (SI) was derived as: mean ct−1min−1 per treatment group/mean ct−1 min−1 per negative control. The SI was calculated from a minimum of three replicates. Control samples were derived by isolation of T cells from untreated control groups.
Challenge with Y. pestis
On the indicated day of the schedule for each study, the remaining animals in each immunization group were randomly divided into groups of six and were challenged by the subcutaneous route with doses of the F1+ strain (GB) of Y. pestis in the range 105−107 colony-forming units (CFU). The challenge inoculum was prepared at 28°C as described previously [13]. Challenged mice were closely observed over a 14-day period for the development of symptoms, and where appropriate, time to death (TTD) was carefully recorded. Malaise was noted in some animals as immobility and ruffled coat. Humane end-points were strictly observed so that no animal became distressed. Animals that succumbed to the challenge were autopsied. Livers and spleens were scored for enlargement and any evidence of abnormality was noted. Sections of liver, spleen and lungs were smeared onto Congo red agar or Yersinia selective agar (YSA; Oxoid, Basingstoke, UK), and the plates were incubated at 28°C and observed for growth after 48 h. At the end of the 14-day observation period, survivors were humanely culled and tissues were removed for bacteriological and gross morphological analysis, as above.
Statistical analysis
Student's t-test was applied to determine the significance of the difference between treatment group means [14]. The technique of Probit analysis [15] was applied to investigate the relationship between percentage survival against s.c. challenge with Y. pestis and the log10 IgG, and more specifically, IgG1 titre to F1 and V. Further, a comparison of parallel probit slopes generated by the individual and combined subunits enabled a determination of the potency ratio of the subunits in inducing an IgG and, more specifically, an IgG1 titre which correlated with protection.
Determination of optimum molar ratio of subunits
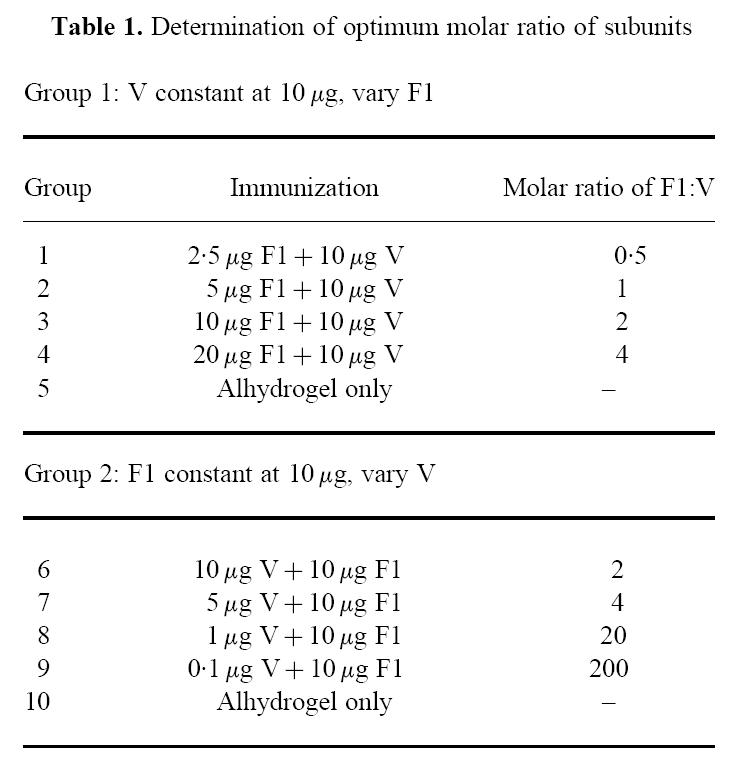
In previous studies, a 10-μg dose level of each subunit has been demonstrated to induce protective immunity against injected and inhalational challenge with the plague-causing organism, Y. pestis. In this study, the optimum molar ratio of one subunit to the other was determined by keeping either subunit constant at 10 μg and varying the dose level of the other subunit.
Eight groups of 24 BALB/c mice were immunized with the combined subunits at various dose levels to achieve a molar ratio of F1:V in the range 0.5–200, as shown in Table 1. The subunits were delivered adsorbed to 25% (v/v) alhydrogel (Superfos Biosector, Frederikssund, Denmark) in 0.1 ml PBS per animal. Further groups of 24 mice received 0.1 ml alhydrogel (25% v/v) only and served as vehicle controls. Mice in all groups were dosed on a single occasion only, in order to observe fine differences in response between groups. All doses were delivered intramuscularly, divided equally between two injection sites in order to maximize the response in the draining lymph nodes. Tail vein blood samples were removed from six animals per group on days 45 and 68 of the schedule, for the determination of antibody titre.
Table 1.
Determination of optimum molar ratio of subunits
 |
Determination of dose level of vaccine required for protection
Six groups of 24 BALB/c mice were immunized with the combined subunits at doses in the range 10 μg F1 + 10 μg V to 0.01 μg F1 + 0.01 μg V. The subunits were delivered adsorbed to 25% (v/v) alhydrogel (Superfos Biosector) in 0.1 ml PBS per animal. A further group of 24 mice was given the killed whole cell vaccine (KWCV) comprising 2 × 10⁸ CFU 0.1/ml per mouse, as before [6] and this equates to one fifth of the human dose. Group 8 animals received 0.1 ml alhydrogel (25% v/v) only and served as vehicle controls. Mice in all groups were dosed as indicated on day 1 and this dosing was repeated on day 21 to achieve a booster immunization. All doses were delivered intramuscularly, divided equally between two injection sites. Serial blood samples were collected on days 21, 68 and 168 from six individual animals per group. On day 240, terminal blood samples were collected from six animals per group for antibody titration and spleens were removed for assay of B cell antibody secretion by modified ELISA and of T cell recall response to the subunit antigens. At this time point also, the remaining 12 animals in each immunization group were randomly divided into two groups and were challenged by the subcutaneous route with either 107 CFU or with 105 CFU of Y. pestis strain GB.
RESULTS
Determination of optimum molar ratio of subunits
Development of IgG titre after a single vaccine dose
The group mean log10 IgG titre to F1, V and the combined titre to F1 + V at day 45 is shown in Fig. 1a,b. From Fig. 1a it is clear that when the dose level of V was held constant at 10 μg, there was little effect on combined titre to F1 + V of increasing dose level of F1 in the range (2.5–20) μg. In contrast, it is clear from Fig. 1b that when F1 was held constant at 10 μg there was a large reduction in the total titre when the dose level of V was reduced from 10 μg down to 0.1 μg. In the absence of a booster dose, the total titre had not increased beyond log10 8 for any immunization group by day 68 (data not shown). Between days 45 and 68, there were increases in the titre to V in groups 7 and 8, further illustrating the more gradual development of a titre to V.
Fig 1.
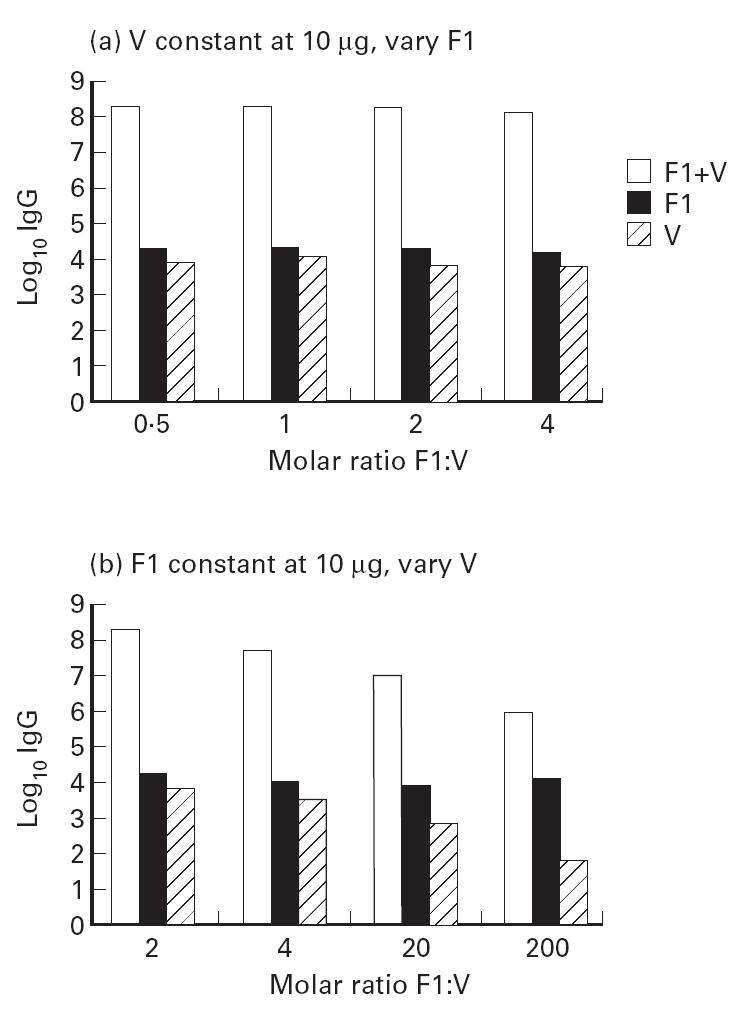
Effect of molar ratio of F1:V on titre at day 45.
From this study, it appeared that the dose level of the V subunit was critical and that as long as F1 was present, the precise dose level in the range (2.5–20) μg made no significant difference. To achieve maximum total titres early in the schedule (by day 45) the combination of F1 + V at the 10-μg dose level is indicated. This represents a molar excess of F1:V of 2. However, by day 68 the differences in response to the dose levels representing molar ratios of F1:V in the range 2–20 (groups 6–8) had largely been lost. Only group 9, given a 200 molar excess of F1:V, still had not produced a total titre in excess of log10 6, some 2 logs lower than the other groups.
Determination of dose level of vaccine required for protection
In the second part of this study, to determine the protective dose level of vaccine, a two-fold molar excess of F1:V was adopted for each dose level of vaccine trialled in the range 10 μg F1 + 10 μg V to 0.01 μg F1 + 0.01 μg V.
Development of IgG titres to F1 and V with time
The development of serum IgG titre was measured at intervals throughout the immunization schedule and is plotted for each dose level against time in Fig. 2. On each of days 21, 68, and 168, a dose–response effect was observed with F1- and V-specific IgG generally increasing as the dose level of F1 + V increased. At day 21, the IgG titre to F1 exceeded the IgG titre to V at all dose levels (data not shown). From day 68 onwards, the IgG titre to V was of the same order as the titre to F1, and from this time on, the anti-V titre dominated the response, at all dose levels. By day 68, all individuals within each group had responded with an IgG titre to F1 and to V, with a standard error which was < 3% of the group mean.
Fig 2.
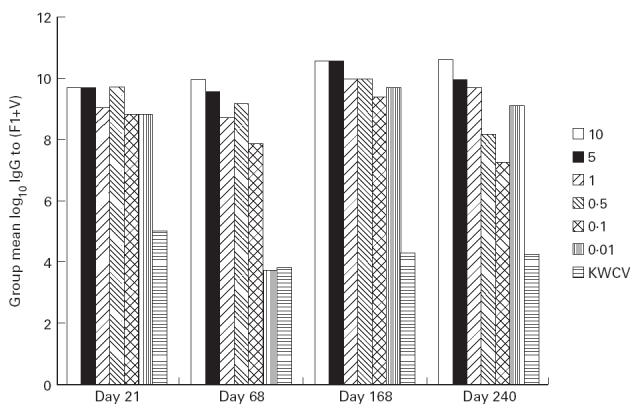
Development of total serum IgG titre to (F1 + V) with time.
In general, for each dose level total IgG titre increased with time up to day 168, but by day 240 was in decline. There were two exceptions to this: first, the total IgG titre in the group receiving 10 μg F1 + 10 μg V was maintained constant between days 168 and 240; and second, the IgG titre induced to the KWCV, which was entirely F1-specific, had declined by more than one log between days 21 and 68 and then remained at this level to day 240.
Distribution of IgG titre across subclasses
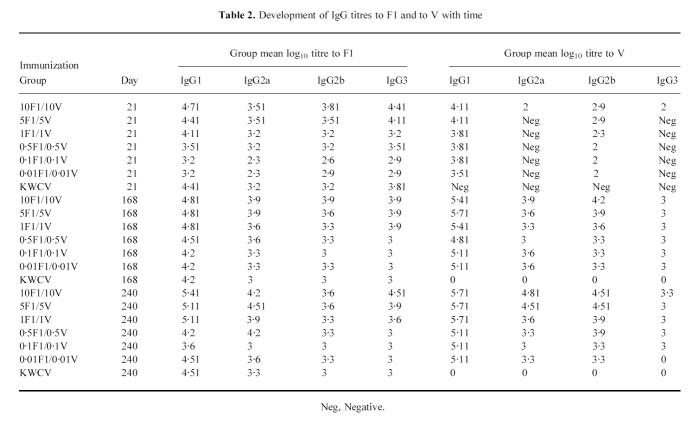
The distribution of F1- and V-specific IgG titres across the subclasses was measured on the corresponding days 21–240 (Table 2). From these data it is clear that the IgG1 titre dominated the response to either antigen on all days in a dose-related manner. This pattern was not altered by the administration of a booster dose of vaccine on day 21. As reported previously [5] the anti-F1 response induced by the KWCV was also predominantly of the IgG1 isotype.
Table 2.
Development of IgG titres to F1 and to V with time
Persistence of IgG1 titre to (F1 + V)
When total IgG1 titre to F1 + V was plotted against time for each dose level (Fig. 3), it was apparent that titres were elevated above log10 10 and still rising at day 240 for the first three dose levels (10 μg F1 + 10 μg V, 5 μg F1 + 5 μg V and 1 μg F1 + 1 μg V) only and were below log10 10 and variable for the lower dose levels (0.5 μg F1 + 0.5 μg V, 0.1 μg F1 + 0.1 μg V and 0.01 μg F1 + 0.01 μg V). The total IgG1 titre was maximal for the group receiving the 10 μg F1 + 10 μg V dose level. In contrast, the entirely anti-F1 IgG1 titre induced to the KWCV remained at a value around log10 4.0 throughout the schedule, not increasing significantly in response to the booster dose at day 21.
Fig 3.
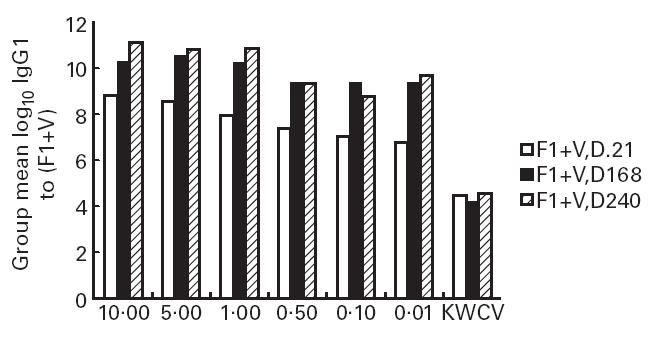
Persistence of serum IgG1 titre to (F1 + V) with time.
In vitro T cell recall response at day 240
The in vitro recall response of T cells isolated at day 240 from each immunization group is shown in Fig. 4. A significantly increased SI (P < 0.005) was measured for T cells isolated from animals in the 10 μg F1 + 10 μg V group on re-exposure to 6.3 μg/ml of the V antigen, compared with T cells isolated from the negative control group. However, T cells isolated from this group did not have a significantly increased SI on re-introduction of the F1 antigen at 3.2 μg/ml. No significant proliferation to either F1 or V was measured for T cells isolated from animals immunized at any other dose level or from the KWCV group.
Fig 4.
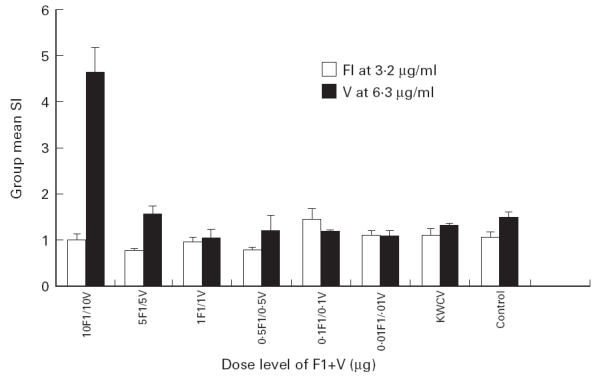
In vitro T cell recall response at day 240.
In vitro B cell memory response at day 240
The memory response of B cells in spleen cell homogenates prepared from animals in each immunization group at day 240 was measured by a modified ELISA. Antibody secretion by splenic B cells with specificity for both the F1 and V antigens was detected after an 18-h incubation with F1 or V coated to the solid phase. The results shown in Fig. 5 indicate the distribution of total titre to (F1 + V) across the IgG subclasses, for each immunization group. As for serum, the predominant subclass was IgG1 and as the dose level of F1 + V was increased from 0.5 μg F1 + 0.5 μg V to 10 μg F1 + 10 μg V, there was a logarithmic increase in the total titre of specific IgG1. The predominant isotype secreted by splenic B cells from the KWCV group was also IgG1, but with specificity for the F1 antigen only.
Fig 5.
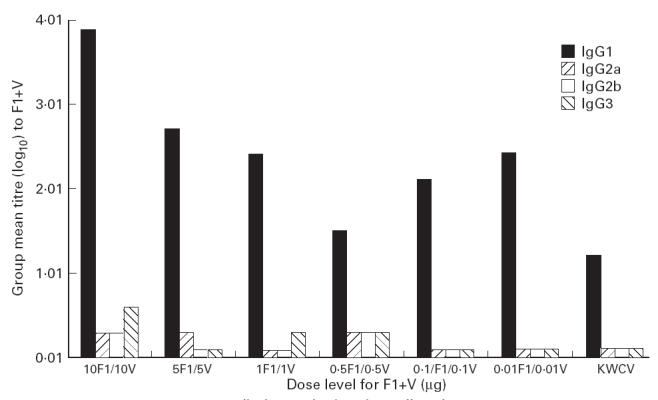
In vitro antibody secretion by spleen cells at day 240.
Protection against subcutaneous challenge
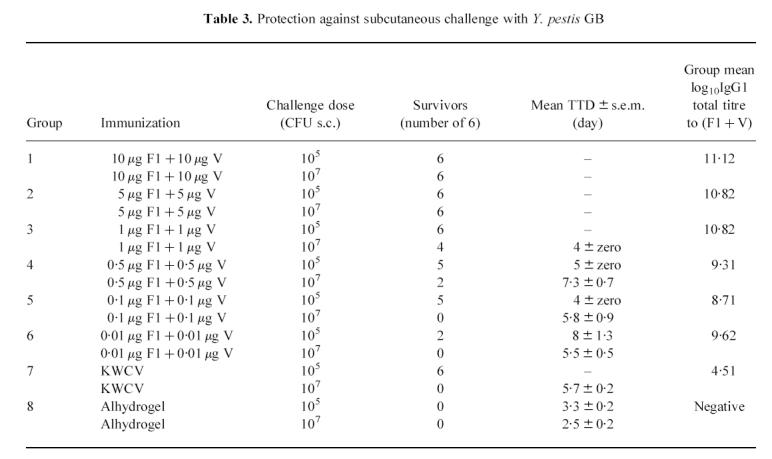
In order to measure the protective dose level of F1 + V, 12 animals from each immunization group were challenged with Y. pestis strain GB by the subcutaneous route in the dose range (105−107 CFU). The number of survivors per group at day 14 post-challenge is shown in Table 3. Animals immunized with 10 μg F1 + 10 μg V or with 5 μg F1 + 5 μg V withstood a challenge of up to 107 CFU, but there was breakthrough in protection against 107 CFU for animals immunized at dose levels of 1 μg F1 + 1 μg V, or less. At the 105 CFU Y. pestis challenge level, the breakthrough in protection occurred amongst vaccinees given 0.5 μg F1 + 0.5 μg V, or less. Mice immunized with the KWCV were fully protected against 105 CFU Y. pestis, but none survived challenge with 107 CFU, and this is approximately equivalent to the protective efficacy of the subunit vaccine administered at the 0.1 μg F1 + 0.1 μg V dose level. Because of the relatively small numbers of animals in each challenge group, it was not possible to carry out a statistical analysis, so that the minimum protective dose could not be precisely determined.
Table 3.
Protection against subcutaneous challenge with Y. pestis GB
 |
At day 14 post-challenge, surviving vaccinees were humanely killed and autopsied for macroscopic and bacteriological analysis of their tissues. The spleens, livers and lungs of all the animals in the F1 + V-immunized groups appeared normal, and Y. pestis was not recovered on culture of the tissue sections collected. These observations confirmed that surviving animals in the F1 + V-immunized groups had effectively cleared Y. pestis from the blood, liver and spleen by day 14 post-challenge.
Correlation of total IgG1 titre to F1 + V with protection
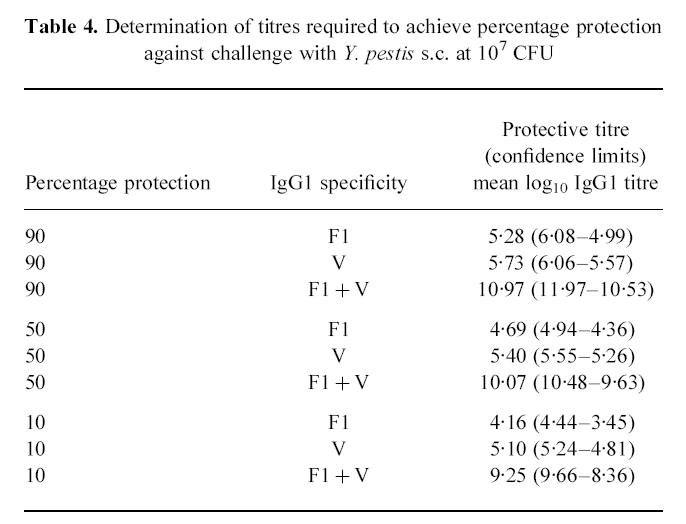
Probit analysis was used to investigate the relationship between the protection achieved against s.c. challenge with Y. pestis by immunization with F1 + V, and the antibody titre induced by the vaccine components (Table 3). A significant correlation (P < 0.05) was identified between the predominant IgG subclass, IgG1, titre to F1 + V and the level of protection achieved. From this it was possible to correlate the percentage protection with IgG1 titre to the individual and combined subunits (Table 4). Thus the log10 IgG1 titre to F1 + V required to achieve 90% protection against challenge was derived as 10.97 (confidence limits 10.53–11.97).
Table 4.
Determination of titres required to achieve percentage protection against challenge with Y. pestis s.c. at 107 CFU
 |
Evidence for synergistic activity between vaccine components
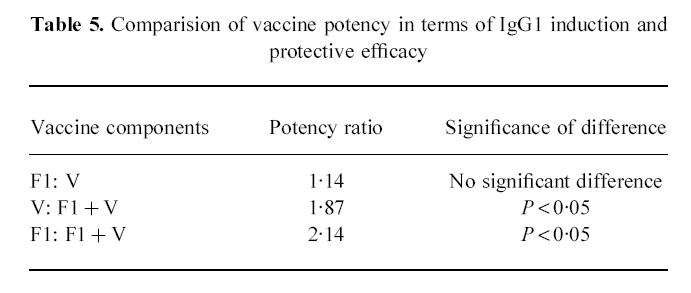
Probit analysis was also used to compare the potency ratio of the vaccine components in terms of the IgG1 titres induced and the level of protection achieved. This was achieved by comparing the probit slopes derived for the subunits, having established that the slopes were parallel and that their intercepts with the abscissa could be used to compare their potency in terms of protective efficacies. When the IgG1 titres induced by F1 and V individually were compared, it was clear that there was no significant difference in their contribution to protection against s.c. challenge with 107 CFU Y. pestis (Table 5). The combined IgG1 titre to F1 + V was significantly more protective (P < 0.05) against 107 CFU s.c. of Y. pestis than the IgG1 titre to V (potency ratio 1.87) or to F1 (potency ratio 2.14). If the enhanced protection achieved with the combined subunits was due to an additive effect of the individual subunits, then a potency ratio of 2 would be expected. The data derived here suggest that the combined subunits had an additive effect in terms of protective efficacy, over and above the individual subunits.
Table 5.
Comparision of vaccine potency in terms of IgG1 induction and protective efficacy
 |
DISCUSSION
The studies reported in this paper were designed to optimize fully the formulation of the recombinant subunit vaccine for plague in the mouse model. To this end, a dose level of 10 μg each of F1 and V, giving an optimum molar ratio of F1:V of 2, has been identified to maximize the IgG titre induced at an early stage of the immunization schedule (day 45 or less). This 10 μg F1 + 10 μg V combination induced a durable response for > 8 months. To optimize the early (day 45) immune response to the subunit vaccine it has been shown here that the dose level of the V antigen is critical and that F1 is equally effective when present within a range of concentrations from 2.5 μg up to 20 μg. This may be because the development of an immune response, as evidenced by the appearance of an IgG titre, is slower for the V antigen compared with the F1 antigen when both are given at the same dose level; during the first 6 weeks of the two-dose immunization regimen, the F1 antigen was the more immunogenic. However, beyond this time point, the anti-V titre consistently exceeded the anti-F1 titre. These observations have been made before [4, 12] and may be explained by differences in in vivo processing of the subunits which may influence the initial response to each as immunogens.
In this two-dose regimen, the IgG titre to F1 and to V antigens developed in a dose-dependent manner with maximum titres to the top dose level of 10 μg F1 + 10 μg V. The predominant IgG subclass raised to both F1 and to V was IgG1 and this remained so throughout the schedule. The predominantly IgG1 titre was established after priming and was not altered by boosting at day 21. The IgG1 titre was persistently elevated over the 8 months of the study in animals receiving the three upper dose levels of F1 + V. This effect was most marked in the 10 μg F1 + 10 μg V group, in which the IgG1 titre was still rising at day 240, > 8 months after the primary and booster immunizations. At day 240, there was evidence of a memory B cell response to F1 and to V in all immunization groups. The size of the B cell memory response correlated with dose level, with a maximum response being achieved in the 10 μg F1 + 10 μg V group. At this time point also, only the 10 μg F1 + 10 μg V group had significant T cell memory and this was directed entirely towards the V subunit. No significant T cell memory to the V or F1 subunit was recorded for any other group. Previously, animals given 25 μg of each subunit in a microencapsulated formulation retained a significant T cell response to both F1 and V at day 162 [12]. It is likely that the recall response is dependent on numbers of T cells recruited on initial exposure to the subunit antigen, as well as on duration of exposure.
The development of an IgG1 titre to F1 and to V was observed in vaccinees, both in serum and on direct secretion from spleen cells. An IgG1 titre is indicative of an ongoing Th2 response [16], which is the typical response to dosing with purified protein antigens in alhydrogel [17]. Recently, the appearance of a predominantly IgG1 titre in animals immunized subcutaneously with the V antigen only in alhydrogel has been positively correlated with enhanced survival against injected or aerosolized plague [7]. Although the KWCV also induced an IgG1 response to F1, its lower protective efficacy against injected or aerosol challenge may be attributed partly to its lower content of F1 antigen, but more importantly, to its deficiency in the V antigen [4, 7].
The total IgG1 titre to (F1 + V) correlated with protection. Because total IgG1 titre has been demonstrated to correlate with protection, the titres required for protection against escalating s.c. challenge doses of Y. pestis can be calculated. In combination, the subunits were significantly more potent in inducing the immunological correlate of protection (IgG1) than the individual subunits. This suggests that the subunits are additive in inducing protection. However, because antibody to the individual subunits serves to inhibit very different virulence mechanisms, the possibility that the subunits are synergistic in the protective efficacy they induce against Y. pestis, cannot be dismissed.
This study has identified a valid immunological correlate of protection against s.c. Y. pestis, in the mouse model. Work is ongoing to determine whether F1- and V-specific IgG1 is the only subclass of antibody required for protection against Y. pestis and the precise mechanisms underlying clearance of the organism in vaccinees. However, this study has identified a correlate of protective immunity, the equivalent of which can be sought across the species in which the vaccine is trialled. If the correlation of a Th2 subclass of IgG with protection holds true across the species, this will then constitute a surrogate marker of protective immunity when the vaccine is trialled in the clinic.
Acknowledgments
We thank Miss J. Trouten for carrying out the ELISAs; Mrs D. Rogers, Ms D. Bell and Ms D. Whittington for technical assistance. We are indebted to Dr E. Allen, Mr K. L. Martin and Mr R. Gwyther for their help with the statistical analysis.
References
- 1.Perry RD, Fetherston JD. Yersinia pestis-etiologic agent of plague. Clin Microbiol Rev. 1997;10:35–66. doi: 10.1128/cmr.10.1.35. [DOI] [PMC free article] [PubMed] [Google Scholar]
- 2.Marshall JD, Bartelloni PJ, Cavanaugh DC, Kadull PJ, Meyer KF. Plague immunisation. II. Relation of adverse clinical reactions to multiple immunisations with killed vaccine. J Infect Dis. 1974;129:S19–s25. doi: 10.1093/infdis/129.supplement_1.s19. [DOI] [PubMed] [Google Scholar]
- 3.Meyer KF. Effectiveness of live or killed plague vaccines in man. Bull WHO. 1970;42:653–66. [PMC free article] [PubMed] [Google Scholar]
- 4.Williamson ED, Eley SM, Stagg AJ, Green M, Russell P, Titball RW. A sub-unit vaccine elicits IgG in serum, spleen cell cultures and bronchial washings and protects immunised animals against pneumonic plague. Vaccine. 1997;15:1079–84. doi: 10.1016/s0264-410x(96)00303-9. [DOI] [PubMed] [Google Scholar]
- 5.Williamson ED, Eley SM, Griffin KF, et al. A new improved sub-unit vaccine for plague: the basis of protection. FEMS Immunol Med Microbiol. 1995;12:223–30. doi: 10.1111/j.1574-695X.1995.tb00196.x. [DOI] [PubMed] [Google Scholar]
- 6.Andrews GP, Heath DG, Anderson GW, Welkos SL, Friedlander AM. Fraction 1 capsular antigen (F1) purification from Yersinia pestis CO92 and from an Escherichia coli recombinant strain and efficacy against lethal plague challenge. Infect Immun. 1996;64:2180–7. doi: 10.1128/iai.64.6.2180-2187.1996. [DOI] [PMC free article] [PubMed] [Google Scholar]
- 7.Anderson GW, Leary SEC, Williamson ED, Titball RW, Welkos SL, Worsham PL, Friedlander AM. Recombinant V antigen protects mice against pneumonic and bubonic plague against F1 capsule positive and negative strains of Y. pestis. Infect Immun. 1996;64:4580–5. doi: 10.1128/iai.64.11.4580-4585.1996. [DOI] [PMC free article] [PubMed] [Google Scholar]
- 8.Leary SEC, Williamson ED, Griffin KF, Russell P, Eley SM, Titball RW. Active immunisation with recombinant V antigen from Yersinia pestis protects mice against plague. Infect Immun. 1995;63:2854–8. doi: 10.1128/iai.63.8.2854-2858.1995. [DOI] [PMC free article] [PubMed] [Google Scholar]
- 9.Anderson GW, Heath DG, Bolt CR, Welkos SL, Friedlander AM. Short and long term efficacy of single dose sub-unit vaccines against Yersinia pestis in mice. Am J Hyg Trop Med. 1998;58:793–9. doi: 10.4269/ajtmh.1998.58.793. [DOI] [PubMed] [Google Scholar]
- 10.Green M, Rogers D, Russell P, Stagg AJ, Bell DL, Eley SM, Titball RW, Williamson ED. The SCID/Beige mouse as a model to investigate protection against Yersinia pestis. FEMS Immunol Med Microbiol. 1999;23:107–13. doi: 10.1111/j.1574-695X.1999.tb01229.x. [DOI] [PubMed] [Google Scholar]
- 11.Titball RW, Howells AM, Oyston PCF, Williamson ED. Expression of the Yersinia pestis capsular antigen (F1 antigen) on the surface of an aroA mutant of Salmonella typhimurium induces high levels of protection against plague. Infect Immun. 1997;65:1926–30. doi: 10.1128/iai.65.5.1926-1930.1997. [DOI] [PMC free article] [PubMed] [Google Scholar]
- 12.Williamson ED, Sharpe GJE, Eley SM, Vesey PM, Pepper TC, Titball RW, Alpar HO. Local and systemic immune response to a microencapsulated sub-unit vaccine for plague. Vaccine. 1996;14:1613–9. doi: 10.1016/s0264-410x(96)00151-x. [DOI] [PubMed] [Google Scholar]
- 13.Russell P, Eley SM, Hibbs SE, Manchee RJ, Stagg AJ, Titball RW. A comparison of Plague Vaccine USP and ev76 vaccine induced protection against Yersinia pestis in a murine model. Vaccine. 1995;13:1551–6. doi: 10.1016/0264-410x(95)00090-n. [DOI] [PubMed] [Google Scholar]
- 14.Leonard JM. The arithmetic of decision-making. London: The English Universities Press Ltd,; 1971. [Google Scholar]
- 15.Finney DJ. Probit analysis. 3. Cambridge: Cambridge University Press; 1971. p. 34. [Google Scholar]
- 16.Snapper CM, Finkelman FD, Paul WE. Differential regulation of IgG1 and IgE by synthesis of Interleukin 4. J Exp Med. 1988;167:183–96. doi: 10.1084/jem.167.1.183. [DOI] [PMC free article] [PubMed] [Google Scholar]
- 17.Lindblad ER. In: The theory and practical application of adjuvants. Stewart-Tull DES, editor. Chichester: John Wiley and Sons; 1995. pp. 21–36. [Google Scholar]


