Abstract
Increased levels of IL-1β and IL-1 receptor antagonist (IL-1Ra) have been found in serum of patients with chronic liver diseases, although their expression in liver tissue has not been extensively investigated. The aim of this study was therefore to examine the relationship between IL-1β and IL-1Ra at tissue level in patients with HCV-related chronic active hepatitis (CAH) of varying degrees of severity. IL-1β and IL-1Ra mRNA expression was investigated by semiquantitative reverse transcription-polymerase chain reaction (RT-PCR) in 31 patients with CAH of varying severity (classified as minimal/mild in 13 cases and moderate/severe activity in 18 cases) and in 12 control subjects. Quantitative evaluation of IL-1β and IL-1Ra corresponding bands was performed by densitometric image analysis, and expressed in arbitrary units. The 12 controls expressed a similar pattern with a mean IL-1β/IL-1Ra ratio of 1.03 (1.03 ± 0.15 (mean ± s.e.m.), median 0.92, range 0.71–1.45). Minimal/mild activity CAH showed a prevalence of IL-1Ra mRNA expression (1.14 ± 0.64, median 0.43, range 0–8.75) when compared with controls (0.27 ± 0.04, median 0.23, range 0.11–0.45) and with moderate/severe activity CAH (0.20 ± 0.04, median 0.12, range 0–0.67; P = 0.01). Since IL-1β expression was similar in the three groups, a significantly different IL-1β/IL-1Ra ratio emerged between controls, patients with moderate/severe CAH (2.22 ± 0.48, median 2.76, range 0–6.12) and those with minimal/mild activity CAH (0.62 ± 0.15, median 0.5, range 0–1.58, P = 0.005). Patients with higher grades of fibrosis showed a higher IL-1β/IL-1Ra ratio (2.49 ± 0.56, median 2.15, range 0.35–6.12) in comparison with lower grade fibrosis (1.06 ± 0.30, median 0.59, range 0.03–4.50) and control patients (P = 0.01). These results suggest that an imbalance between IL-1β and IL-1Ra, at the tissue level, may contribute to the pathogenesis and the activity of chronic active hepatitis C.
Keywords: IL-1β, IL-1 receptor antagonist, chronic active hepatitis, HCV
INTRODUCTION
Studies of the natural history of HCV-related chronic liver disease suggest that a significant proportion of these patients eventually develops cirrhosis [1].
Cytokines are thought to play a central role in liver metabolism and in the immune response to viral agents [2] and increased intrahepatic levels of IL-2, IL-6 and IL-8 were demonstrated by reverse transcription-polymerase chain reaction (RT-PCR) in patients with cirrhosis [3]. IL-1β production is an important initiating factor in the cascade of events resulting in inflammation and it is inhibited specifically by naturally occurring antagonists, including IL-1 receptor antagonist (IL-1Ra) [4].
A recent study supports the hypothesis that an imbalance between IL-1 and IL-1Ra production at tissue level is of pathogenic importance in chronic inflammation, as has been demonstrated in inflammatory bowel diseases [5] and in rheumatoid arthritis [6,7]. Patients with acute and chronic liver disease may have elevated serum levels of both IL-1β and IL-1Ra [8–12]. However, cytokine serum levels do not always predict liver parenchymal levels, which are those relevant functionally, since cytokines mainly act in a local or paracrine way. To our knowledge, data on IL-1β/IL-1Ra balance at the tissue level are lacking in patients with chronic liver diseases.
This study was undertaken to examine the in vivo IL-1β and IL-1Ra mRNA expression in liver biopsy specimens from patients with HCV-related chronic active hepatitis (CAH) of varying activity.
PATIENTS AND METHODS
Patients
Thirty-one patients (47.9 ± 2.7 years old (mean ± s.e.m.)) with suspected CAH, undergoing percutaneous liver biopsy, and 12 control subjects (48.7 ± 2.4 years old) undergoing cholecystectomy, with no clinical and biochemical signs of liver disease, were enrolled in this study. Informed consent was obtained from all patients and the study protocol conformed to the ethical guidelines of the 1994 Declaration of Helsinki. Patients with suspected CAH included 16 men (49.5 ± 4.0 years old) and 15 women (46.4 ± 3.8 years old). These patients were admitted consecutively to the liver unit to confirm the diagnosis of CAH (suspected on the basis of a rise in serum transaminase levels for at least 1 year (1–35 years)) and to assess the activity and the stage of the disease. All patients were anti-HCV+ (ELISA; Ortho Diagnostic Systems, Raritan, NJ) and HCV-RNA+ at PCR (Amplicor HCV; Roche Diagnostic System, Neuilly, France). HBsAg+ patients and patients with detectable serum HBc and HBs antibodies were excluded from the study, as well as patients with other causes of liver disease (a history of alcohol abuse, autoimmune diseases, exposure to toxic agents and inherited metabolic disorders, etc.), patients taking immunomodulatory drugs and patients with systemic diseases influencing the immune system.
Liver tissue
Echo-guided percutaneous liver biopsy was undertaken using a Surecut 18 G needle and when enough tissue was obtained (length of the specimen > 3 cm), a small portion was snap-frozen immediately in liquid nitrogen and stored at −80°C until use. The remaining part of the biopsy was formalin fixed and processed for conventional histological examination. The presence of CAH was confirmed histopathologically and CAH activity was assessed according to the Histological Activity Index (HAI) proposed by Knodell and co-workers [13], considering the first three categories (periportal necrosis with or without bridging necrosis, intralobular degeneration and focal necrosis, portal inflammation) for grading purposes as proposed recently by Desmet and co-workers [14]. Extent of fibrosis was considered separately, as a method of staging [14,15].
RNA extraction, RT and PCR
Total RNA was isolated using the RNAzol B method (Tel Test, Inc., Friendswood, TX), based on the technique described previously by Chomczynski & Sacchi [16] as described by the manufacturer. Total RNA (1 μg) was reverse-transcribed in a 20-μl reaction solution containing 2 mm dNTPs (Promega, Madison, WI), 1× first-strand buffer (Gibco BRL, Bethesda, MD), 5 mm dTT, 500 ng oligo-dT (Gibco BRL), 250 ng random primers (Gibco BRL) and 200 U of Superscript II reverse transcriptase (Gibco BRL). Samples were incubated at 75°C for 5 min, cooled on ice for 2 min and then incubated at 42°C for 60 min. The reaction was stopped by inactivating the enzyme at 95°C for 5 min. To monitor the cDNA synthesis, 5 μl of this reaction were removed at the beginning of the synthesis and 5 mCi of α32 Phosphorus dATP (800 mCi/ml; Amersham, Aylesbury, UK) were added to the reaction. After incubation at 42°C, the radioactive reaction was purified through Sephadex Nick Spin Columns according to the manufacturer's instructions (Pharmacia, Uppsala, Sweden), and then counted on a β-scintillation counter (Packard, Downers Grove, IL) to evaluate the cDNA synthesis.
On the basis of the cDNA count for each sample, the PCR reactions were conducted with an equivalent amount of non-radioactive cDNA for each case. The amplified β-actin (22 cycles), run on 2% agarose gel, usually confirmed that the cDNA amount was almost the same for all the cases considered in this study.
PCR reaction was carried out with a normalized volume of RT reaction product, 30 pm of each primer, 200 μm NTPs, 1.5–2 mm MgCl2, in a total volume of 50 μl in a Perkin Elmer 9600 thermocycler. PCR amplification was carried out under the following conditions: denaturing for 30 s at 93°C, annealing at 55°C for 30 s, elongation at 72°C for 40 s. For each set of primers the number of cycles of the PCR was determined previously in order to remain in the exponential phase of the amplification process, so that the difference in band intensity could reflect the difference in mRNA amount.
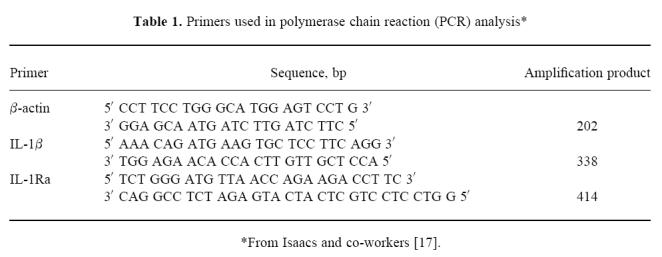
The primers used for PCR analysis are reported in Table 1 [17].
Table 1.
Primers used in polymerase chain reaction (PCR) analysis*

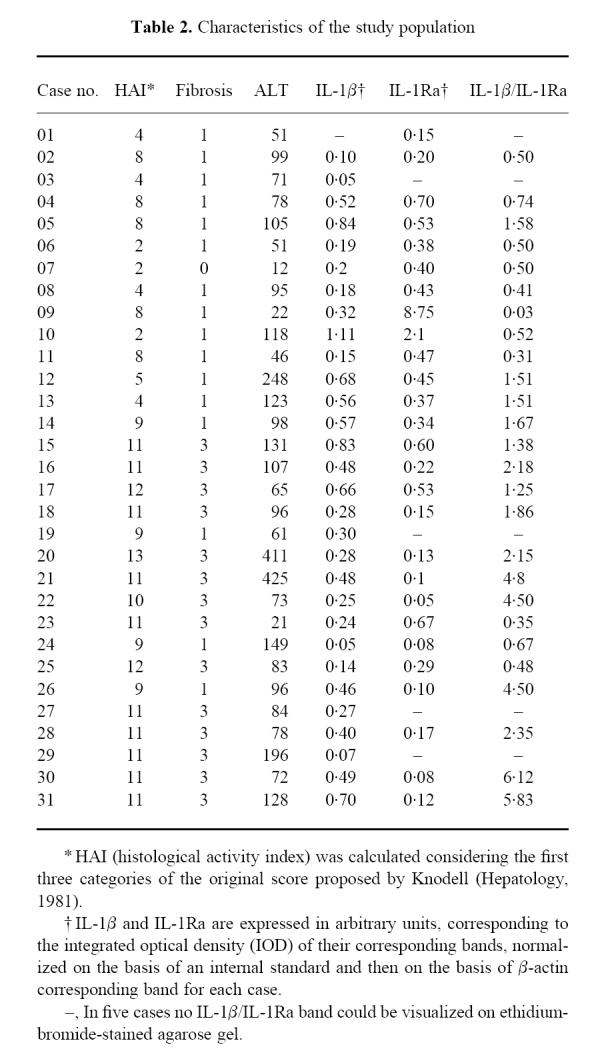
Amplified products were run on a 2% agarose gel stained with ethidium bromide. Quantitative evaluation of IL-1β and IL-1Ra corresponding bands was undertaken by densitometric image analysis, using a specific software (Gel-Pro-Analyser; Immagini e Computer, Milano, Italy) and a ‘Scan Maker II sp’ (Microtek) scanner for image acquisition. For each case, the computer-assisted analysis system normalized the β-actin, IL-1β and IL-1Ra corresponding bands on the basis of an internal, fixed standard (a fixed band of the molecular weight markers loaded in the same quantity in each gel) and the integrated optical density (IOD) was expressed in arbitrary units. For semiquantitative purposes, the IOD of IL-1β and IL-1Ra bands was referred to the IOD of β-actin corresponding band (Table 2). Every sample was amplified twice and the resulting bands were quantified. All the cases included in this study gave similar results at two repeated examinations.
Table 2.
Characteristics of the study population

Statistical analysis
Differences between IL-1β and IL-1Ra mRNA among patients with CAH of varying activity and control subjects were compared by means of the Kruskal–Wallis one-way non-parametric analysis of variance [18]. Differences between the ratios of IL-1β and IL-1Ra mRNA expression in livers from patients with CAH of varying severity and in control patients were also verified by the Kruskal–Wallis test. Differences in transaminase levels in patients with different cytokine patterns were analysed by the Mann–Whitney U-test [18]. Statistical tests were carried out using a 5% level of significance. All statistical procedures were carried out using Statistix (Analytical Software, Tallahassee, FL).
RESULTS
Histopathological examination yielded the diagnosis of CAH in all the patients and excluded liver damage in the 12 control cases. Thirteen cases showed lower (< 8) HAI and were considered minimal/mild activity CAH; the remaining 18 cases with an HAI score > 8 were considered moderate/severe CAH (Table 2). As proposed by Desmet and co-workers [14], the HAI for grading purposes included only the first three categories of the original scoring system proposed by Knodell and co-workers [13], and the presence and extent of fibrosis were considered separately in order to stage the disease. No difference was found in duration of the disease (starting from the first finding of increased transaminase serum levels) between patients with different HAI.
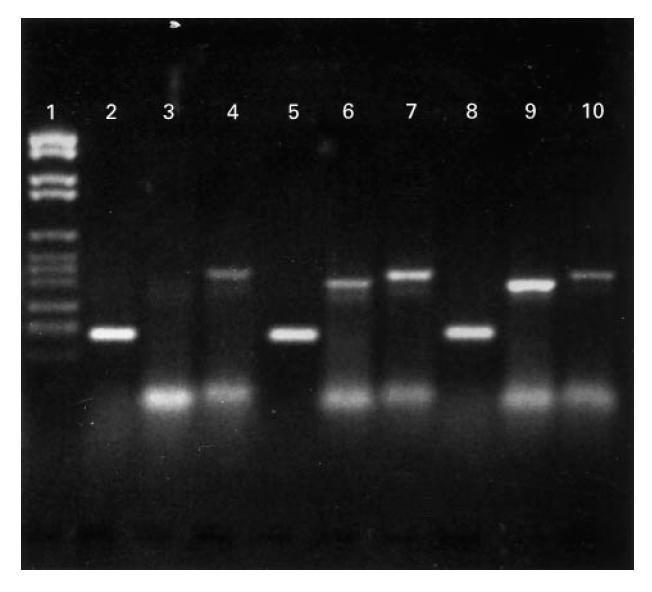
RT-PCR amplification resulted in PCR products of predicted size on ethidium bromide-stained gels (Fig. 1).
Fig. 1.

Reverse transcription-polymerase chain reaction (RT-PCR) products visualized on 2% agarose gel stained with ethidium bromide. Lane 1, molecular weight markers VI (Boehringer Mannheim). Lanes 2–4, case no. 1; lane 2, β-actin; lane 3, IL-1β; lane 4, IL-1Ra. Lanes 5–7, case no. 6; lane 5, β-actin; lane 6, IL-1β; lane 7, IL-1Ra. Lanes 8–10, case no. 31; lane 8, β-actin; lane 9, IL-1β; lane 10, IL-1Ra.
All 12 control cases showed a similar IL-1β and IL-1Ra mRNA expression pattern, with bands of similar intensity after RT-PCR amplification and an IL-1β/IL-1Ra ratio ranging from 0.71 to 1.45 (1.03 ± 0.15, median 0.92).
In five cases, after the PCR amplification, one of the two bands was too weak to be visualized on the agarose gel, in the presence of regular amounts of β-actin mRNA (Fig. 1). These five cases were included in the statistical analysis using the χ2 test (Table 2).
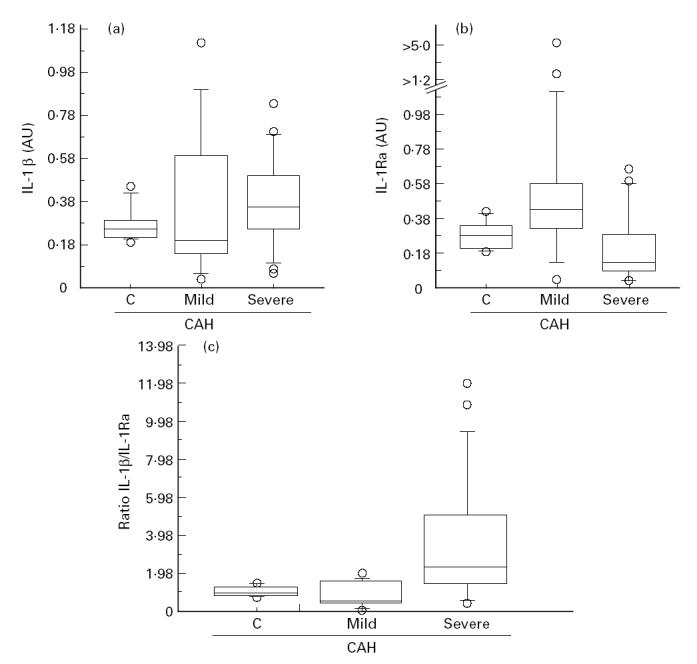
The semiquantitative analysis of PCR products did not show any statistical difference in IL-1β mRNA expression among controls (0.27 ± 0.03, median 0.25, range 0.20–0.45), minimal/mild CAH (0.37 ± 0.09, median 0.20, range 0–1.11) and moderate/severe CAH (0.38 ± 0.05, median 0.35, range 0.05–0.83). With regard to IL-1Ra, a statistically significant difference was found between controls (0.27 ± 0.04, median 0.23, range 0.11–0.45) and patients with CAH of minimal/mild (1.14 ± 0.64, median 0.43, range 0–8.75) and moderate/severe (0.20 ± 0.04, median 0.12, range 0–0.67) activity (P = 0.01, Kruskal–Wallis test), but the difference was not statistically significant between controls and moderate/severe CAH (post hoc means comparison).
Patients with moderate/severe CAH showed a higher IL-1β/IL-1Ra ratio (2.22 ± 0.48, median 1.76, range 0–6.12) when compared with normal controls and with patients with minimal/mild CAH (0.62 ± 0.15, median 0.50, range 0–1.58; P = 0.005, Kruskal–Wallis test), although control patients were not significantly different from minimal/mild CAH (post hoc means comparison) (Fig. 2).
Fig. 2.

Box-plot graphic display of IL-1β integrated optical density (IOD), IL-1Ra IOD and IL-1β/IL-1Ra ratio distribution in chronic active hepatitis (CAH) of different severity. AU, Arbitrary unit; C, control livers; mild, minimal/mild CAH; severe, moderate/severe CAH. The three horizontal bars in the box from top to bottom are the 75th, 50th (median) and 25th percentiles, respectively. The upper line ends at the 90th percentile and the lower line at the 10th percentile. Outliers are represented by circles. (a) IL-1β IOD versus CAH. (b) IL-1Ra IOD versus CAH. (c) IL-1β/IL-1Ra ratio versus CAH.
Similar findings were reported on the staging of the disease: patients with the highest grades of fibrosis (scoring 3 and 4 according to HAI) had a higher IL-1β/IL-1Ra ratio (2.49 ± 0.56, median 2.15, range 0.35–6.12) compared with the lowest (scoring 1 and 2 according to HAI) grade fibrosis (1.06 ± 0.30, median 0.59, range 0.03–4.50) and with control patients (P = 0.01, Kruskal–Wallis test; P = 0.01, χ2 test).
Cases with higher HAI did not show significantly higher serum ALT levels compared with cases with lower HAI. On the other hand, higher ALT serum levels were found in patients with an increased IL-1β/IL-1Ra tissue ratio (140.42 ± 24.81, median 98, range 61–425) compared with patients with a lower IL-1β/IL-1Ra tissue ratio (72.92 ± 11.95, median 78, range 12–149; P = 0.03, Mann–Whitney U-test).
DISCUSSION
IL-1β is one of the most important cytokines with respect to the liver [19]. By binding to specific high-affinity cell surface receptors, IL-1β shows pleiotropic effects that include costimulation of T lymphocytes, B cell proliferation, growth of fibroblasts, induction of adhesion molecules, stimulation of the production of other cytokines and inflammatory mediators in an autocrine and paracrine way, growth-inhibitory and cytocidal effect for several cell lines [20].
IL-1Ra is a naturally occurring inhibitor that counterbalances the biological activity of IL-1β by a competitive binding to IL-1 receptors, without inducing signal transduction. The induction of IL-1Ra, coupled with IL-1β induction, was demonstrated both in healthy subjects in whom endotoxaemia was produced by injection of Escherichia coli endotoxin [4] and in cancer patients receiving IL-1β as a therapeutic agent [21,22]. Liver tissue and Hep G2 cells produce IL-1Ra, as demonstrated by Steinkasserer et al. [23], and increased serum levels of IL-1 and IL-1Ra were found in patients with chronic liver diseases [9–11]. These findings are indeed controversial [24], possibly due to the selection of patients (different aetiology and stage of the disease might be associated with varying cytokine production) and circulating cytokine levels are almost non-specific regarding the site of production. Sekiyama and co-workers [25] tested serum concentrations of IL-1β and IL-1Ra in patients with fulminant hepatic failure and acute hepatitis and found a significantly reduced IL-1Ra/IL-1β ratio in patients who died compared with subjects who survived.
Since data about intrahepatic IL-1/IL-1Ra balance are lacking, mRNA expression of these cytokines was examined in liver biopsy samples from untreated patients with HCV-related chronic liver disease. We used semiquantitative RT-PCR rather than Northern blot analysis to detect cytokine mRNA because this technique is very sensitive and enables the identification of low expression mRNA even starting from small tissue specimens. The reproducibility of the analysis was tested by repeating PCR amplification and densitometric image analysis quantification on two separate occasions, by two different operators. Each sample gave reproducible results with repeated assays. The cDNA synthesis efficiency was evaluated by means of ct/min of parallel RT reactions for each case, as described in Patients and Methods. The β-actin amplification with equivalent cDNA amounts confirmed that cDNA quantity was almost the same for the cases included in the study.
Recently, mRNA expression of IL-2, IL-6, IL-8, transforming growth factor-beta (TGF-β) and interferon-gamma (IFN-γ), evaluated by semiquantitative RT-PCR, was found to be increased significantly in cirrhotic liver tissue [3]. IL-1β showed an increased expression in cirrhotic patients with autoimmune CAH, but did not appear significantly up-regulated when the total cirrhotic group was compared with controls. Our data agree with these previous findings [3], since any significant increase of IL-1β mRNA expression was not found in CAH. As in the above study [3], we did not carry out immunohistochemical analysis in this study, due to the small amount of tissue available. We preferred to carry out an mRNA instead of a histochemical analysis, because the detection of these cytokines in liver tissue could also be the result of blood flow transportation from the gut and the spleen, in the absence of hepatic synthesis.
The findings suggest a loss of the normal IL-1β/IL-1Ra balance at tissue level. We found, indeed, a mild reduction of the normal IL-1β/IL-1Ra balance in minimal/mild CAH and a strong increase in the IL-1β/IL-1Ra ratio in moderate/severe CAH, regardless of the duration of the disease. As far as the staging of the disease is concerned, a higher IL-1β/IL-1Ra ratio was found in livers with porto-portal and porto-central septa documented histopathologically, when compared with CAH with minimal fibrosis. Naveau and co-workers [26] demonstrated recently that IL-1Ra plasma concentration is specifically increased by IFN-α2a treatment in patients with HCV-related chronic liver disease, and they proposed that the modulation of the IL-1/IL-1Ra balance may be a key mechanism of the action of IFN-α treatment in these patients.
Previous studies [5] carried out on biopsy specimens from patients with inflammatory bowel disease found a significant decrease in the IL-1Ra/IL-1β ratio both at the protein [5] and at the mRNA level [17]. The decreased intestinal IL-1Ra/IL-1 ratio was found to correlate with the severity of the disease, thus supporting the hypothesis that an imbalance between IL-1 and IL-1Ra is of pathogenic importance in these patients [5]. Similarly, our data, obtained by semiquantitative evaluation of IL-1β and IL-1Ra mRNA levels, suggest that the evolution to more aggressive forms of CAH might be associated with an excess of IL-1β over IL-1Ra at tissue level and, conversely, the predominant local expression of IL-1Ra might be associated with milder liver damage, possibly due to the protective role of IL-1Ra from the cytokine-mediated tissue injury.
The prognostic value of these findings for the natural history of the disease and its possible response to interferon therapy remains to be established.
References
- 1.Di Bisceglie AM, Goodman ZD, Ishak KG, Hoofnagle JH, Melpolder JJ, Alter HJ. Long term clinical and histopathological follow-up of chronic posttranfusion hepatitis. Hepatology. 1991;14:969–74. doi: 10.1016/0270-9139(91)90113-a. [DOI] [PubMed] [Google Scholar]
- 2.Andus T, Bauer J, Gerok W. Effects of cytokines on the liver. Hepatol. 1991;13:364–75. [PubMed] [Google Scholar]
- 3.Napoli J, Bishop GA, McCaughan GW. Increased intrahepatic messenger RNA expression of interleukins 2, 6, and 8 in human cirrhosis. Gastroenterology. 1994;107:789–98. doi: 10.1016/0016-5085(94)90128-7. [DOI] [PubMed] [Google Scholar]
- 4.Granowitz EV, Santos AA, Poutsiaka DD, Cannon JG, Wilmore DW, Wolff SM, Dinarello CA. Production of interleukin 1 receptor antagonist during experimental endotoxiemia. Lancet. 1991;338:1423–4. doi: 10.1016/0140-6736(91)92725-h. [DOI] [PubMed] [Google Scholar]
- 5.Casini-Raggi V, Kam L, Chong YJT, Fiocchi C, Pizarro TT, Cominelli F. Mucosal imbalance of IL1 and IL1-receptor antagonist in inflammatory bowel disease. J Immunol. 1995;154:2434–40. [PubMed] [Google Scholar]
- 6.Chomarat P, Vannier E, Dechanet J, Rissoan MC, Banchereau J, Dinarello CA, Miossec P. Balance of IL1 receptor antagonist/IL1 beta in rheumatoid synovium and its regulation by IL4 and IL10. J Immunol. 1995;154:1432–9. [PubMed] [Google Scholar]
- 7.Fujikawa Y, Shingu M, Torisu T, Masumi S. Interleukin 1 receptor antagonist production in cultured synovial cells from patients with rheumatoid arthritis and osteoarthritis. Ann Rheum Dis. 1995;54:318–20. doi: 10.1136/ard.54.4.318. [DOI] [PMC free article] [PubMed] [Google Scholar]
- 8.Muto Y, Nouri-Aria KT, Meager A, Alexander GJM, Eddleston ALWF, Williams R. Enhanced tumour necrosis factor and interleukin 1 in fulminant hepatic failure. Lancet. 1988;2:72–74. doi: 10.1016/s0140-6736(88)90006-2. [DOI] [PubMed] [Google Scholar]
- 9.Tilg H, Wilmer A, Vogel W, Herold M, Nolchen B, Judmaier G, Huber C. Serum levels of cytokines in chronic liver diseases. Gastroenterology. 1992;103:264–74. doi: 10.1016/0016-5085(92)91122-k. [DOI] [PubMed] [Google Scholar]
- 10.Khoruts A, Stahnke L, McClaine CJ, Logan G, Allen JI. Circulating tumor necrosis factor, interleukin-1 and interleukin 6 concentrations in chronic alcoholic patients. Hepatology. 1991;13:267–76. [PubMed] [Google Scholar]
- 11.Tilg H, Vogel W, Wiedermann CJ, Shapiro L, Herold M, Judmaier K, Dinarello CA. Circulating interleukin 1 and tumor necrosis factor antagonists in liver diseases. Hepatology. 1993;18:1132–8. [PubMed] [Google Scholar]
- 12.Mc Clain CG, Cohen DA, Dinarello CA, Cannon JG, Shedlovski SI, Kaplan M. Serum interleukin 1 (IL1) activity in alcoholic patients. Life Sci. 1986;39:1479–85. doi: 10.1016/0024-3205(86)90554-0. [DOI] [PubMed] [Google Scholar]
- 13.Knodell RG, Ishak KG, Black WC, et al. Formulation and application of a numerical scoring system for assessing histologic activity in asymptomatic chronic active hepatitis. Hepatology. 1981;1:431–5. doi: 10.1002/hep.1840010511. [DOI] [PubMed] [Google Scholar]
- 14.Desmet VJ, Gerber M, Hoofnagle JH, Manns M, Scheuer PJ. Classification of chronic hepatitis: diagnosis, grading and staging. Hepatol. 1994;19:1513–20. [PubMed] [Google Scholar]
- 15.Ishak K, Baptista A, Bianchi L, et al. Histological grading and staging of chronic hepatitis. J Hepatol. 1995;22:696–9. doi: 10.1016/0168-8278(95)80226-6. [DOI] [PubMed] [Google Scholar]
- 16.Chomczynski P, Sacchi N. Single-step method of RNA isolation by acid guanidium thiocyanate-phenol-chloroform extraction. Anal Biochem. 1987;162:156–9. doi: 10.1006/abio.1987.9999. [DOI] [PubMed] [Google Scholar]
- 17.Isaacs KL, Sartor RB, Haskill S. Cytokine messenger RNA profiles in inflammatory bowel disease mucosa detected by polymerase chain reaction amplification. Gastroenterology. 1992;103:1587–95. doi: 10.1016/0016-5085(92)91182-4. [DOI] [PubMed] [Google Scholar]
- 18.Snedecor GW, Cochran WG. Statistical methods. Ames: Iowa State University; 1990. [Google Scholar]
- 19.Peters M. Actions of cytokines on the immune response and viral interactions. An overview. Hepatol. 1996;23:909–16. doi: 10.1053/jhep.1996.v23.ajhep0230909. [DOI] [PubMed] [Google Scholar]
- 20.Onozaki K, Matsushima K, Aggarwal BB, Oppenheim JJ. Human interleukin 1 is a cytocidal factor for several tumor cell lines. J Immunol. 1985;135:3962–8. [PubMed] [Google Scholar]
- 21.Bargetzi MJ, Lantz M, Smith CG, Torti FM, Olsson I, Eisenberg SP, Starnes HF. Interleukin 1β induces interleukin 1 receptor antagonist after interleukin 1 therapy in patients with cancer. Clin Cancer Res. 1996;2:501–6. [Google Scholar]
- 22.Kopp WC, Urba WJ, Rager HC, Alvord WJ, Oppenheim JJ, Smith JW, Longo DL. Induction of interleukin 1 receptor antagonist after interleukin 1 therapy in patients with cancer. Clin Cancer Res. 1996;2:501–6. [PubMed] [Google Scholar]
- 23.Steinkasserer A, Estaller C, Weiss EH, Sim RB. Human interleukin 1 receptor antagonist is expressed in liver. FEBS Letters. 1992;310:60–62. doi: 10.1016/0014-5793(92)81146-d. [DOI] [PubMed] [Google Scholar]
- 24.Ledesma Castano F, Echevarria Vierna S, Lozano Polo JL, Oloriz Rivas R, Alvarez Moreno C, Pons Romero F. Interleukin 1 in alcoholic cirrhosis of the liver: the influence of nutrition. Eur J Clin Nutr. 1992;46:527–33. [PubMed] [Google Scholar]
- 25.Sekiyama KD, Yoshiba M, Thomson AW. Circulating proinflammatory cytokines (IL-1β, TNF-α, and IL-6) and IL-1 receptor antagonist (IL-1Ra) in fulminant hepatic failure and acute hepatitis. Clin Exp Immunol. 1994;98:71–77. doi: 10.1111/j.1365-2249.1994.tb06609.x. [DOI] [PMC free article] [PubMed] [Google Scholar]
- 26.Naveau S, Emilie D, Borotto E, et al. Interleukin 1 receptor antagonist plasma concentration is specifically increased by alpha-2A-interferon treatment. J Hepatol. 1997;27:272–5. doi: 10.1016/s0168-8278(97)80171-7. [DOI] [PubMed] [Google Scholar]


