

Abstract
The immune response of PBMC to gliadin was investigated in patients with coeliac disease (CoD) by examining proliferation, MHC restriction and cytokine production. Gliadin induced low levels of proliferation in 63% of eight untreated patients, 32% of 28 treated patients and 35% of 31 healthy control subjects. In MHC restriction studies, the proliferative response to gliadin was inhibited (range 47–98% inhibition) in the presence of a MoAb to HLA-DR in each of three coeliac and three control donors studied. Using flow cytometry, increased expression of activation markers (HLA-DR and IL-2R) was demonstrated on gliadin-stimulated T cells from four of nine coeliac patients and three of seven healthy control donors. Cytokines were studied in culture supernatants using ELISA. Gliadin was a potent inducer of IL-6 and IL-10 in 100% of coeliac patients and controls, whereas IL-4 was not produced in either subject group. Gliadin induced IL-2 production in 40% of untreated patients, 42% of treated patients and 35% of healthy control donors. Interferon-gamma (IFN-γ) in gliadin-stimulated cultures was found only in coeliac patients, observed in 33% of untreated patients and 25% of treated patients. Spontaneous secretion of both IL-2 and IFN-γ was found more frequently in patients with untreated disease (87% of cases versus 21% of controls for IFN-γ and 40% versus 0% for IL-2). These results suggest, as manifest by IFN-γ production, that gliadin stimulates a Th1/Th0-like response in coeliac patients and a Th0-like response in healthy controls.
Keywords: gliadin, cytokines, peripheral blood, coeliac disease
INTRODUCTION
Coeliac disease (CoD) is an inflammatory disorder of the small intestinal mucosa which is characterized by varying degrees of villous atrophy and crypt cell hyperplasia. The disease is precipitated in susceptible individuals by ingestion of cereal proteins, in particular the gliadins of wheat gluten and similar prolamins in rye and barley [1,2]. There is increasing evidence to support the view that this disorder is caused by a T cell-mediated hypersensitivity to gliadin, and the characteristic lesion is partly caused by the subsequent release of cytokines [3,4].
Previous investigators have reported varying results for peripheral blood lymphocyte responses to gliadin. In some reports, blood mononuclear cells from coeliac patients but not healthy control donors proliferated in vitro to an enzymic digest of gliadin [5,6]. Recently, proliferative responses to a similar gliadin digest were reported in both coeliac patients and healthy control donors [7]. It is known, however, that while cells fail to proliferate in response to stimulation with specific antigen, they may nonetheless secrete cytokines. Moreover, T cells have been divided into at least two subsets (Th1 and Th2) based on cytokine profiles that they secrete upon antigen stimulation. Th1 cells characteristically secrete IL-2, interferon-gamma (IFN-γ) and tumour necrosis factor-alpha (TNF-α) and are involved in cell-mediated immune responses characterized by macrophage activation and DTH reactions, while Th2 cells, secreting IL-4, IL-5, IL-6 and IL-10, are involved in humoral immunity [8,9]. Although Th1- and Th2-type cytokine profiles were originally identified through analysis of murine T cell clones [10], there is evidence that chronically stimulated human T cells are polarized into Th1 or Th2 patterns of cytokine synthesis [11].
Gliadin-specific T cells were recently cloned from the peripheral blood [7] and small intestinal mucosa of coeliac patients [12] and the cytokine profiles have been reported [13,14]. The cytokines secreted by these clones were variable, with cytokines typical of both Th1 and Th2 cells being produced. The possibility exists, however, that the technique involved in preparation of T cell clones may bias the cytokine profile and may not accurately reflect the in vivo situation [15,16].
The aims of the present study were: (i) to examine the proliferative responses of PBMC to gliadin in patients with active (untreated) or inactive (treated with a gluten-free diet) CoD and healthy control donors; (ii) to investigate whether the response is restricted by HLA-DR molecules; (iii) to investigate activation of gliadin-specific T cells by studying activation marker expression after in vitro stimulation; (iv) to analyse a range of cytokines secreted spontaneously by freshly isolated and gliadin-stimulated PBMC in coeliac patients and control donors.
PATIENTS AND METHODS
Subject populations
Thirty-six patients with CoD were studied. Eight patients were untreated (seven women, one man; age 35 ± 3.2 years (mean ± s.e.m.); range 17–59 years) and were on normal diets at the time of study. The mucosa of these patients showed subtotal villous atrophy on histological examination. Twenty-eight treated coeliac patients (25 women, three men; age 39 ± 4.4 years; range 25–58 years) were studied. All were on gluten-free diets for a minimum of 2 months, showing histological improvement following gluten exclusion. Biopsies from 21 of the treated patients were histologically normal while the remaining seven individuals showed partial villous atrophy. The control group consisted of 31 healthy laboratory staff (22 women, nine men; age 31 ± 4.2 years; range 24–50 years). These individuals had no clinical signs of CoD and were negative for antibodies against gliadin.
Antigen preparation
Gliadin (Sigma, St Louis, MO) was dissolved in 0.1 m acetic acid, prepared as a stock solution of 10 mg/ml and stored at −20°C. The stock preparation was filtered using a sterile 0.22-μm membrane filter and working dilutions were prepared in RPMI (Gibco BRL, Eggenstein, Germany) based on dilutions of the stock solution. The optimum concentration of gliadin for use in lymphocyte proliferation and cytokine studies was determined in preliminary experiments. Purified protein derivative (PPD) of Mycobacterium tuberculosis (Evans Medical Ltd, Horsham, UK) was used as a positive control at a final concentration of 2500 U/ml in culture.
Separation of PBMC
PBMC were isolated from heparinized blood by density gradient centrifugation using Lymphoprep (Nycomed, Oslo, Norway), washed twice in Hanks' balanced salt solution (HBSS; Gibco) and resuspended in RPMI with 10% heat-inactivated autologous serum, 100 U/ml penicillin/streptomycin (Gibco) and 2 mml-glutamine (Gibco). Cell number and viability were determined using ethidium bromide/acridine orange staining.
Cell culture and proliferation studies
PBMC, resuspended at a final concentration of 1 × 10⁶ cells/ml (200 μl volume) were incubated in three replicate cultures with varying amounts of gliadin, PPD or medium alone. Cellular proliferation was measured on day 7 by adding 0.5 μCi of tritiated thymidine for the last 18 h of culture. All samples were measured in triplicate. The cultured cells were harvested on Whatman paper using a cell harvester (Inotech, Dottikon, Switzerland). Radioactivity incorporated into cells was determined using a liquid scintillation beta counter (Packard 1500; Tri Carb, UK). The results are reported as stimulation indices (SI), where SI = (ct/min test/ct/min spontaneous cultures). A significant proliferative response was defined as SI ≥ 3, and by an increment of ≥ 200 ct/min.
To investigate whether the proliferative response to gliadin was inhibited in the presence of anti-HLA-DR, PBMC were cultured with gliadin in the presence and absence of (i) an antibody directed against a monomorphic HLA-DR epitope, RFDR1 (a gift from Dr L. Poulter, Royal Free Hospital, London, UK), or (ii) a non-specific isotype-matched control antibody (Dako Ltd, Cambridge, UK). Each antibody was dialysed to remove preservatives and was used at an optimized final concentration of 10 μg/ml. Proliferation was measured after 7 days in culture by thymidine incorporation as described above. The proliferative response in the presence of antigen alone was taken as 100% and the percentage inhibition calculated based on the response in the presence of the antibody.
Cell activation
PBMC were cultured with gliadin or PPD and the expression of activation markers (HLA-DR and IL-2R) assessed by two-colour flow cytometry using a FACSort flow cytometer and CellQuest lysis software (Becton Dickinson, Oxford, UK). In preliminary studies, kinetics experiments were performed. In these studies, antigenic stimulation was found to induce HLA-DR and IL-2R to maximum levels after 7 days in culture (data not shown). At this time point, cells were harvested and washed twice in PBS containing 0.1% bovine serum albumin and 0.1% NaN3 (PBS–BSA). Cells (1 × 10⁵) were incubated with FITC-conjugated anti-HLA-DR or FITC-conjugated anti-CD25 (Becton Dickinson) for 30 min at 4°C. After incubation, cells were washed using PBS–BSA and incubated for 10 min with PE-conjugated anti-CD3. Five thousand cells were acquired initially and cells visualized on the basis of size (FSC) and granularity (SSC). During analysis, a gate was drawn around the lymphocyte population excluding monocytes and debris. Quadrants were set using control FITC/PE-conjugated antibodies (Simultest Control γ1γ2a; Becton Dickinson). Results are expressed as the percentage of positive cells expressing activation markers and differences of ≤ 2% compared with the control antibody were considered not significant. All results were compared with activation marker expression in unstimulated cells.
Cytokine assays
For cytokine measurement, supernatants were harvested from cell cultures and stored at −20°C pending analysis. Kinetic experiments were performed initially to determine the optimum time point for induction of cytokines in short-term cultures of fresh PBMC. Cytokine concentrations were measured by means of specific sandwich ELISA. Peak IL-2 production was typically seen after 24 h and after 72 h for IL-4, IL-6, IL-10 and IFN-γ (data not shown). IL-2 and IL-6 levels were determined using commercial kits from Genzyme (Cambridge, UK), IL-4 and IL-10 using paired antibodies from Cambridge Biosciences and IFN-γ levels using a kit from Mabtech (Nacka, Sweden). IL-6 concentrations were assayed using paired antibodies provided by Dr K. Mills (St Patrick's College, Maynooth, Ireland). For each cytokine, the antibody concentrations (capture and biotinylated secondary) were optimized and standard curves were established to quantify reproducibly the levels of cytokine in the culture supernatants. The assay sensitivities for each cytokine ELISA were as follows: IL-2 (31 pg/ml), IL-4 (31 pg/ml), IFN-γ (0.3 ng/ml), IL-6 (31 U/ml) and IL-10 (78 pg/ml). Specific cytokine production in response to antigen was calculated by subtracting concentrations measured in unstimulated cultures (i.e. background) from those measured in gliadin- or PPD-stimulated cultures. Results are expressed as mean and ranges.
Statistical analysis
Analysis of results between patient groups was compared using Mann–Whitney U-test for non-parametric data. All statistics were performed using Instat software.
RESULTS
Proliferative responses of PBMC to gliadin
PBMC from 31 healthy controls, 28 treated coeliac patients and eight untreated coeliac patients were stimulated in vitro with gliadin (100 μg/ml), a concentration found to give maximal proliferation in preliminary experiments. Proliferative responses to gliadin were detected in nine (32%) of the treated patients, in five (63%) untreated patients and in eleven (35%) healthy controls (Fig. 1). The SI values did not differ in coeliac patients compared with controls. Mean values were 5.5 (range 3–13.5) in treated coeliac patients, 8.2 (range 3–19) in untreated coeliac patients and 7.9 (range 3–17) in healthy controls. A strong proliferative response to the control antigen, PPD, was found in over 90% of subjects studied. The SI values ranged from 6 to 73 (mean 40) for coeliac patients and from 7 to 69 (mean 32) for healthy controls (data not shown).
Fig. 1.
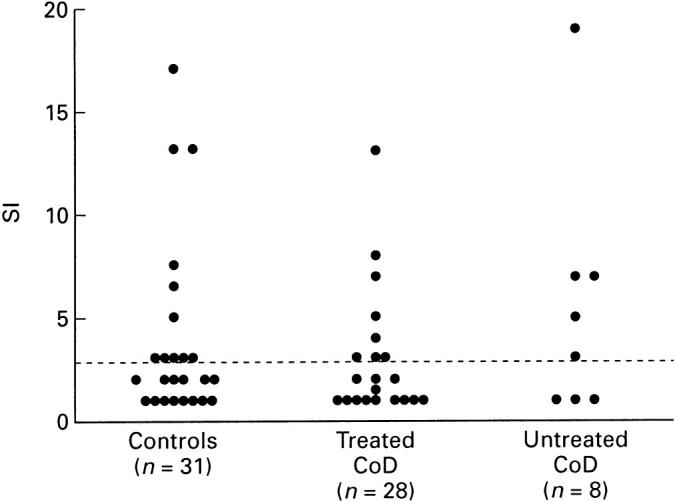
Proliferative responses of PBMC to gliadin in patients with treated and untreated coeliac disease (CoD) and healthy control donors. Values are shown as stimulation indices (SI) and the horizontal bar indicates the positive cut off value.
In inhibition studies, the proliferative response to gliadin was inhibited by an IgM antibody to a specific HLA-DR monomorphic determinant (RFDR1), but not by a control IgM antibody (Fig. 2). The percentage inhibition ranged from 47% to 98% in the coeliac patients and from 63% to 97% in controls. With the control antibody, inhibition of proliferation was < 25% in five of the six individuals studied.
Fig. 2.
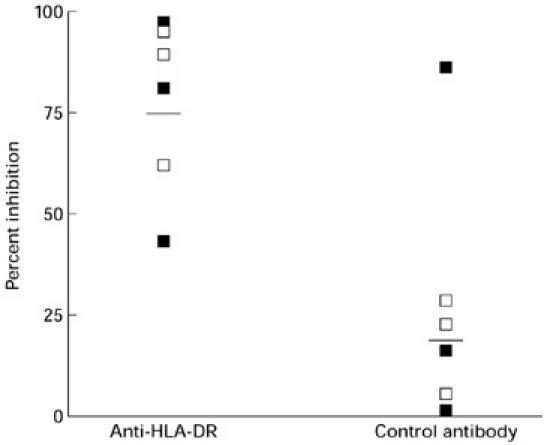
Inhibition of gliadin-induced proliferation by anti-HLA-DR and control antibodies. Horizontal bars indicate the mean percentage inhibition. ▪, Coeliac; □, healthy control.
Expression of activation markers on gliadin-specific T cells
The expression of activation markers, HLA-DR and IL-2R (CD25), on T cells (CD3+) was examined after 7 days in culture with gliadin or PPD. A flow cytometric dot plot from one individual (a healthy control donor) is shown in Fig. 3 and the results for all subjects studied are summarized in Table 1. It can be seen from the dot plot that stimulation with gliadin up-regulated expression of both activation antigens on a small percentage of peripheral blood T cells. Individuals in both the coeliac and control subject groups showed increased activation marker expression in response to gliadin stimulation with no difference in the percentage of activated T cells in coeliac patients compared with control donors (Table 1). PPD stimulated a more pronounced increase in HLA-DR and IL-2R expression on peripheral blood T cells in all individuals studied (Table 1).
Fig. 3.
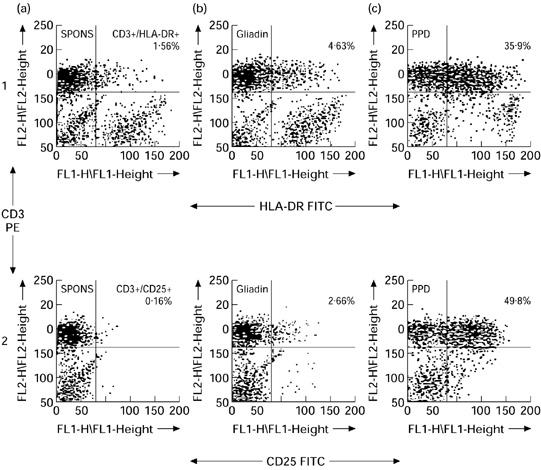
Two-colour flow cytometric profiles of HLA-DR and IL-2R expression on peripheral blood T cells after stimulation for 168 h with medium alone (a), gliadin (b), or purified protein derivative (PPD) (c). The percentage of CD3+HLA-DR+ T cells and CD3+IL-2R+ T cells is shown in the upper right quadrants of dot plots in rows 1 and 2, respectively. The quadrants were set on the basis of control FITC/PE-conjugated antibodies.
Table 1.
Increases in HLA-DR and IL-2R expression on CD3+ peripheral blood T cells after stimulation with gliadin or purified protein derivative (PPD)
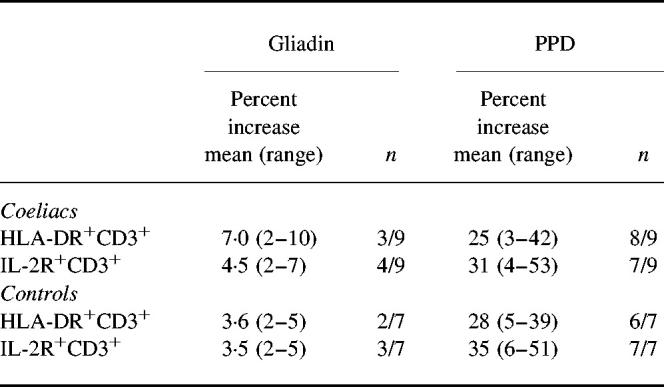
Data represent the increases in the percentage of CD3+ T cell (mean (range)) expressing HLA-DR or IL-2R in the presence of antigen compared with antigen alone after 168 h in culture. n equals number of subjects with a positive response over the total number studied.
Cytokine production by gliadin-stimulated PBMC
IL-2
Gliadin stimulated IL-2 production by PBMC (≥ 31.2 pg/ml) from six of 14 (42%) treated coeliac patients, from two of five (40%) untreated patients and from six of 17 (35%) healthy control donors (Fig. 4). The levels of IL-2 in gliadin-stimulated cultures did not differ significantly between the subject groups, ranging from 0 to 293 pg/ml (mean 59 pg/ml) in treated coeliac patients, from 0 to 58 pg/ml (mean 35 pg/ml) in untreated patients and from 0 to 150 pg/ml (mean 40 pg/ml) in healthy control donors. Low levels of spontaneous IL-2 production (medium alone cultures) were found in two (40%) patients with untreated CoD, in one (7%) of the treated patients but not in any (0%) of the control donors studied. PPD stimulated high levels of IL-2 production in > 70% of individuals. There was no statistical difference in the levels produced in the different subject groups (range 0–627 pg/ml (mean 203 pg/ml) in treated coeliac patients, 0–434 pg/ml (mean 187 pg/ml) in untreated patients and 0–843 pg/ml (mean 254 pg/ml) in control donors (data not shown).
Fig. 4.
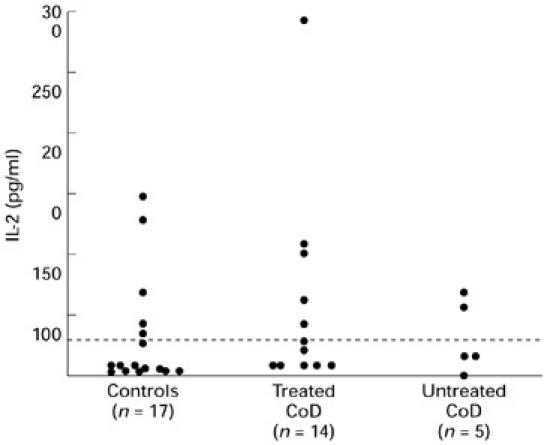
IL-2 production by gliadin-stimulated PBMC in patients with treated and untreated coeliac disease (CoD) and controls. The data represent levels of IL-2 production following stimulation with gliadin with values corrected for background. Dashed line represents the detection limit of the assay.
IFN-γ
Gliadin stimulated production of IFN-γ by PBMC (≥ 0.3 ng/ml) from two of six (33%) untreated coeliac patients, from five of 20 (25%) treated coeliac patients but not from any of 19 (0%) control donors studied (Fig. 5b). The mean levels of IFN-γ in gliadin-stimulated culture supernatants were somewhat higher in patients with active disease (mean 4.4 ng/ml; range 0–9.7 ng/ml) compared with treated patients (1.4 ng/ml; range 0–4.6 ng/ml), although this did not reach statistical significance (P = 0.07). Spontaneous IFN-γ secretion was found more frequently in cultures from patients with active disease (87%) compared with treated patients (20%) or control donors (21%) (Fig. 5a). PPD was a potent inducer of IFN-γ in > 70% of coeliac patients and controls. The mean levels were 4.6 ng/ml (range 0–17 ng/ml) in treated coeliac patients, 11 ng/ml (range 0.7–20 ng/ml) in untreated coeliac patients and 4.5 ng/ml (range 0–10 ng/ml) in control donors.
Fig. 5.
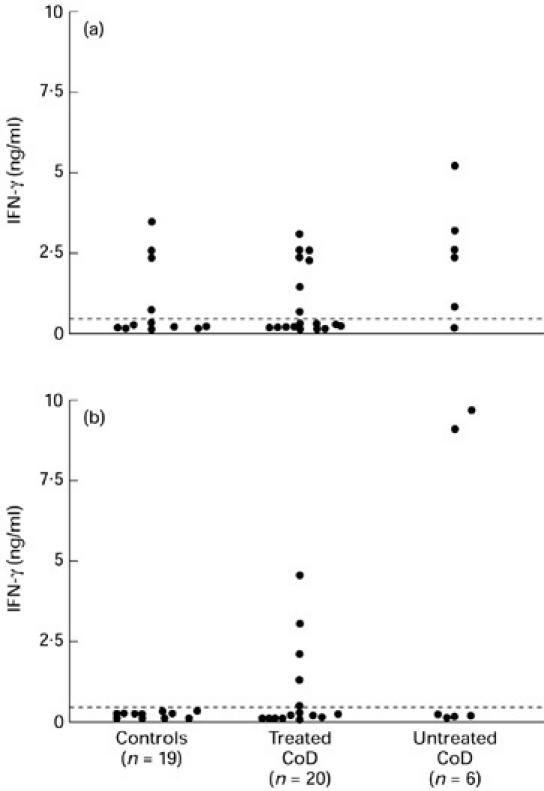
IFN-γ production by PBMC in patients with treated and untreated coeliac disease (CoD) and controls. (a) Levels of IFN-γ in unstimulated culture supernatants. (b) Levels of IFN-γ following stimulation with gliadin are shown with values corrected for background. Dashed line represents the detection limit of the assay.
IL-4
IL-4 was not detected in response to stimulation with gliadin or PPD in cell cultures from 11 coeliac patients (four untreated and seven treated) or 10 healthy controls. Nonetheless, PBMC stimulated with polyclonal activators (phorbol myristate acetate (PMA)/OKT3) secreted IL-4 into culture supernatants. There was no difference between the IL-4 levels in PMA/OKT3-stimulated cultures in coeliac patients compared with healthy control donors (data not shown).
IL-6
In the case of IL-6 and IL-10, only treated coeliac patients and control donors were studied. Spontaneous IL-6 production (≥ 31 U/ml) was detected in the majority of individuals studied: in 14 of 16 (87%) coeliac patients and in 11 of 11 (100%) healthy control donors (Fig. 6). The levels of spontaneous IL-6 production were significantly higher in coeliac patients (mean 375 U/ml; range 57–1205 U/ml) compared with control donors (mean 124 U/ml; range 26–542 U/ml) (P < 0.03). Gliadin was a potent inducer of IL-6 in both the coeliac patients and control subjects. The levels of IL-6 in gliadin-stimulated cultures were significantly higher in coeliac patients (mean 929 U/ml; range 191–3180 U/ml)) compared with controls (mean 350 U/ml; range 110–959 U/ml) (P = 0.005). Stimulation of PBMC with PPD induced a small increase in IL-6 production in 36% of coeliac patients and 33% of healthy controls. Overall, the levels of IL-6 did not differ in PPD-stimulated cultures between coeliac patients and controls.
Fig. 6.
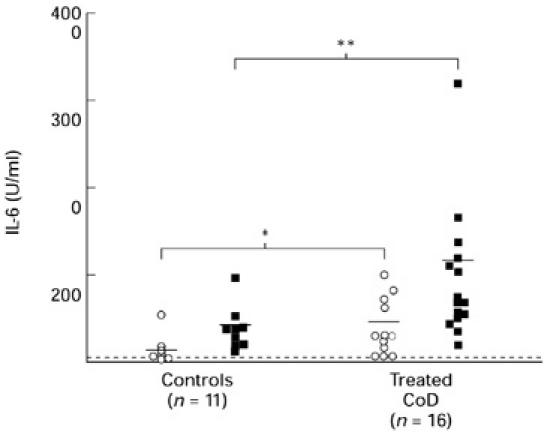
IL-6 production by PBMC in patients with treated coeliac disease (CoD) and controls. The data represent levels of IL-6 production by unstimulated cells or background (BG) and gliadin-stimulated cells in a 72-h culture. Horizontal bar represents the mean values and the dashed line represents the detection limit of the assay. *P < 0.03; **P < 0.01, coeliac patients versus controls. ○, BG; ▪, gliadin.
IL-10
IL-10 was secreted spontaneously by cells (≥ 78 pg/ml) cultured in medium alone in each of nine treated coeliac patients and eight controls studied (Fig. 7). There was no difference in levels of IL-10 produced: mean 491 pg/ml (range 200–980 pg/ml) in the coeliac patients versus mean 395 pg/ml (range 159–1050 pg/ml) in control donors. Similar to IL-6, gliadin markedly enhanced IL-10 production in cultures from 100% of the coeliac patients and controls studied. There was no difference in the levels of IL-10 in gliadin-stimulated cultures from coeliac patients (mean 3494 pg/ml; range 80–7864 pg/ml) or controls (mean 2729 pg/ml; range 1492–4836 pg/ml). In contrast to gliadin, PPD failed to increase IL-10 levels beyond those secreted by cells cultured in medium alone in any of the coeliac patients or control donors studied.
Fig. 7.
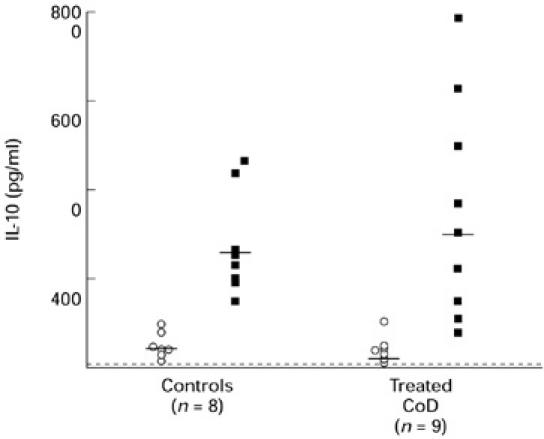
IL-10 production by PBMC in patients with treated coeliac disease (CoD) and controls. The data represent levels of IL-10 production by unstimulated cells (BG; ○) and gliadin-stimulated cells (▪) in a 72-h culture. Horizontal bar represents the mean values and the dashed line represents the detection limit of the assay.
DISCUSSION
In this study we have shown that gliadin can activate PBMC, as demonstrated by proliferation, the expression of activation markers (HLA-DR and IL-2R) in addition to the secretion of cytokines. Whereas gliadin-induced proliferation was found in both coeliac patients and healthy controls, the cytokine profiles secreted in response to gliadin stimulation differed in the two groups. PBMC from healthy controls secreted IL-2, IL-6 and IL-10, but not IL-4 or IFN-γ in response to stimulation with gliadin. In contrast, gliadin induced IFN-γ as well as IL-2, IL-6 and IL-10 in patients with CoD.
PBMC from coeliac patients (treated and untreated) as well as healthy normal controls proliferated in response to stimulation with gliadin. These results are consistent with previous reports describing proliferative responses to various gluten preparations in coeliac patients [5,6] and healthy controls [7,17]. Although gliadin induced low levels of proliferation, this did not reflect a reduced ability of peripheral blood lymphocytes from coeliac patients to respond to other antigens. PPD induced a pronounced proliferative response with similar levels of responsiveness in both the coeliac patients and the normal controls.
Gliadin-induced proliferation was inhibited by an anti-HLA-DR antibody in each of the coeliac patients and the control donors studied. These results suggest that the response of freshly isolated PBMC to gliadin is restricted by HLA-DR, indicating that class II molecules are involved in presentation of gliadin-derived peptides to peripheral blood T cells. The possibility also exists that HLA-DQ and HLA-DP molecules are involved in antigenic presentation of gliadin, but this was not investigated in this study. In similar experiments, gluten-reactive T cells which were cloned from the peripheral blood of coeliac patients [7] and healthy controls [18] were shown to be restricted by HLA-DR and also by the disease susceptibility HLA-DQ2 molecule. Interestingly, while healthy control donors and coeliac patients have HLA-DR- and HLA-DQ2-restricted gliadin-specific T cells in the peripheral blood, in the coeliac intestinal mucosa the majority of T cell clones were found to be HLA-DQ2-restricted [19].
Further evidence of gliadin-induced T cell activation was demonstrated by the increased expression of the activation markers HLA-DR and IL-2R using flow cytometry. In this study we observed that between 5% and 10% of peripheral blood T cells from coeliac patients and controls showed increased expression of activation markers in response to stimulation with gliadin. Other investigators have likewise demonstrated up-regulation of IL-2R expression on peripheral blood T cells from coeliac patients and controls after stimulation with a digest of gliadin [20,21]. PPD markedly up-regulated activation marker expression on peripheral blood T cells, with similar results obtained for coeliac patients and control subjects.
T cells secreting distinct patterns of Th1 or Th2 cytokines have been described in human disorders such as allergies, infection and autoimmunity [11,22]. In the present study, gliadin stimulated low levels of IL-2 production by PBMC from coeliac patients as well as healthy controls. IL-2 is an obligatory signal for cell growth by interacting with the IL-2R complex on the surface of activated T cells [23]. This result gives further evidence that PBMC from coeliac subjects and healthy controls are specifically activated by gliadin. PPD induced markedly higher levels of IL-2 compared with gliadin, and this is consistent with the higher levels of proliferation induced by this antigen.
In contrast to IL-2, IFN-γ was found only in gliadin-stimulated cultures from coeliac patients. Since IFN-γ is a classical Th1 cytokine, the findings suggest that gliadin stimulates Th1 as well as Th0 cells in coeliac patients, but only Th0 cells in controls. Furthermore, unstimulated PBMC from coeliac patients, in particular patients with active disease, spontaneously secreted both IFN-γ and IL-2. Since de novo synthesis of cytokines is an early consequence of T cell activation, these findings suggest that peripheral blood T cells in patients with active CoD are already primed in vivo to secrete Th1 cytokines. It is reported that gliadin-specific T cells cloned from the peripheral blood and the intestinal mucosa of coeliac patients secrete high levels of IFN-γin vitro [13,14]. However, the results of the current study are more representative of the in vivo situation, since cytokines secreted by cloned T cells may be influenced by the cloning procedure. Finally, PBMC from both coeliac patients and controls secreted high levels of IFN-γ in response to PPD, indicative of a Th1 response and in agreement with the findings of other investigators using PBMC [24] and PPD-specific T cell clones [25].
Increased expression of IFN-γ has previously been reported in the intestinal lamina propria of patients with active CoD. Breese et al. [26] reported an increase in the numbers of IFN-γ-secreting cells in the lamina propria of patients with active CoD using an ELISPOT technique. Furthermore, Nilsen et al. [27] recently demonstrated increased IFN-γ mRNA expression in the active coeliac mucosa using quantitative reverse transcription-polymerase chain reaction, with levels of expression reduced towards normal in patients upon treatment with a gluten-free diet.
In coeliac patients without histological evidence of inflammation, IL-6 levels, secreted spontaneously and in response to gliadin, were markedly increased compared with control subjects. IL-6 is produced by T cells following antigenic or mitogenic stimulation and by monocytes when stimulated with lipopolysaccharide (LPS) [28]. In the present experiments, the cellular source of IL-6 was not defined, although the high levels secreted spontaneously are suggestive of monocytic origin. Several factors may contribute to the high levels of IL-6 production by PBMC from coeliac patients. Various inflammatory mediators including IL-1, IL-2, IFN-β and TNF-α induce IL-6 production by both monocytes and T cells [28]. Of interest, we have demonstrated higher intracellular levels of TNF-α in peripheral blood T cells and intraepithelial lymphocytes from coeliac patients compared with controls (O'Keeffe et al., in preparation). Moreover, aberrant expression of TNF-α may be genetically determined. A polymorphism in the promoter region of the TNF-α gene (TNF2), which is associated with high levels of TNF-α production, was reported to be present at higher frequency in CoD [29].
PBMC from coeliac patients and control donors spontaneously secreted high levels of IL-10. This is consistent with data reported by Stordeur et al. [30] describing that PBMC from healthy controls produce significant levels of IL-10 when cultured in medium alone. Gliadin was a potent inducer of IL-10, but levels secreted by coeliac patients did not exceed those of healthy controls. In human peripheral blood, IL-10 is produced by monocytes, B cells and T cells after stimulation with microbial products such as LPS [31] as well as anti-CD3, anti-CD28 or phorbol esters [32]. The cell sources secreting IL-10 in response to gliadin were not defined in this study. Amongst the biological properties of IL-10 is the ability of this cytokine to antagonize the effects of IFN-γ secreted by Th1 cells [33,34]. Moreover, secretion of IL-10 in addition to IL-4 and transforming growth factor-beta (TGF-β) by T cells is believed to contribute to the mechanisms of tolerance to orally ingested antigen [35]. It is interesting to speculate that the high levels of IL-10 secreted by gliadin-stimulated T cells from healthy controls contribute to maintenance of tolerance to this dietary antigen. In contrast to gliadin, PPD failed to stimulate IL-10 production, consistent with the predominant Th1 cytokine profile induced by this bacterial product.
The proliferative response and cytokine production of T cells may be influenced by the preparation of gliadin used in the culture system. Whereas in the studies presented here, whole gliadin was employed, in other studies peptic-tryptic digests of gliadin were used [7,13,14]. Recent studies draw attention to the enhanced reactivity of T cell clones when gliadin deamidation had been achieved either with the enzyme tissue transglutaminase [36] or acid:heat treatment [37]. In the studies reported here, gliadin was dissolved in 0.1 m acetic acid pH 3.4. Whether this caused gliadin deamidation or not is unknown. However, it evident that proteolytic digestion by antigen-presenting cells was sufficient to generate antigenic epitopes recognized by circulating peripheral blood T cells.
In conclusion, the studies presented here have shown that gliadin can activate peripheral blood T cells as measured by proliferation, expression of activation markers and cytokine secretion. Gliadin-induced activation was found not only in coeliac patients but also in healthy controls. However, the results indicate that the profile of cytokines secreted by PBMC in response to gliadin differs in coeliac patients and controls. High levels of IFN-γ were secreted by gliadin-stimulated PBMC from coeliac patients but not controls. Determination of the gliadin-induced cytokine profile may be important in developing an understanding of the nature of immune responses in coeliac disease.
REFERENCES
- 1.Marsh MN. Mucosal pathology in gluten sensitivity. In: Marsh MN, editor. Coeliac disease. Oxford: Blackwell Scientific Publications; 1992. pp. 136–91. [Google Scholar]
- 2.Marsh MN. The morphology and immunopathology of the jejunal lesion in gluten sensitivity. Eur J Gastroenterol Hepatol. 1991;3:163–8. [Google Scholar]
- 3.MacDonald T, Spencer J. Evidence that activated mucosal T cells play a role in the pathogenesis of enteropathy in human small intestine. J Exp Med. 1988;167:1341–9. doi: 10.1084/jem.167.4.1341. [DOI] [PMC free article] [PubMed] [Google Scholar]
- 4.Halstensen TS, Scott H, Fausa O, Brandtzaeg P. Gluten stimulation of coeliac mucosa in vitro induces activation (CD25) of lamina propria CD4+ T cells but no crypt hyperplasia. Scand J Immunol. 1993;38:581–90. doi: 10.1111/j.1365-3083.1993.tb03245.x. [DOI] [PubMed] [Google Scholar]
- 5.Holmes GKT, Asquith P, Cook WT. Cell mediated immunity to gluten fraction III in adult coeliac disease. Clin Exp Immunol. 1976;24:259–65. [PMC free article] [PubMed] [Google Scholar]
- 6.Sikora BS, Truelove SC, Ciclitira PS, Offord RC. Stimulation of lymphocytes from patients with coeliac disease by a subfraction of gluten. Lancet. 1976;2:389–91. doi: 10.1016/s0140-6736(76)92406-5. [DOI] [PubMed] [Google Scholar]
- 7.Gjertsen HA, Sollid LM, Ek J, Thorsby E, Lundin KEA. T cells from the peripheral blood of coeliac patients recognise gluten antigens when presented by HLA-DR, DQ or DP molecules. Scand J Immunol. 1994;37:567–74. doi: 10.1111/j.1365-3083.1994.tb03414.x. [DOI] [PubMed] [Google Scholar]
- 8.Mosmann TR, Sad S. The expanding universe of T cell subsets: Th1, Th2 and more. Immunol Today. 1996;17:138–46. doi: 10.1016/0167-5699(96)80606-2. [DOI] [PubMed] [Google Scholar]
- 9.Abbas AK, Murphy KM, Sher A. Functional diversity of helper T lymphocytes. Nature. 1996;383:787–93. doi: 10.1038/383787a0. [DOI] [PubMed] [Google Scholar]
- 10.Mosmann TR, Coffman RL. Heterogeneity of cytokine secretion patterns and functions of helper T cells. Adv Immunol. 1989;46:11–47. doi: 10.1016/s0065-2776(08)60652-5. [DOI] [PubMed] [Google Scholar]
- 11.Romagnani S. Lymphokine production by human T cells in disease states. Annu Rev Immunol. 1989;7:145–73. doi: 10.1146/annurev.iy.12.040194.001303. [DOI] [PubMed] [Google Scholar]
- 12.Lundin KEA, Scott H, Hanson T, et al. Gliadin-specific T cells isolated from the small intestinal mucosa of coeliac disease patients. J Exp Med. 1993;178:187–96. doi: 10.1084/jem.178.1.187. [DOI] [PMC free article] [PubMed] [Google Scholar]
- 13.Nilsen EM, Lundin KEG, Krajci P, Scott H, Sollid LM, Brandtzaeg P. Gluten specific, HLA-DQ restricted T cells from the coeliac mucosa produce cytokines with a Th1 or Th0 profile dominated by interferon-γ. Gut. 1995;37:766–76. doi: 10.1136/gut.37.6.766. [DOI] [PMC free article] [PubMed] [Google Scholar]
- 14.Nilsen EM, Gjertsen HA, Jensen K, Brandtzaeg P, Lundin KEA. Gluten activation of peripheral blood T cells induces a Th0 like cytokine pattern in both coeliac patients and controls. Clin Exp Immunol. 1996;103:295–303. doi: 10.1046/j.1365-2249.1996.d01-611.x. [DOI] [PMC free article] [PubMed] [Google Scholar]
- 15.Maggi E, Parronchi P, Manetti R, et al. Reciprocal regulatory effects of IFN-γ and IL-4 on the in vitro development of human Th1 and Th2 clones. J Immunol. 1993;148:2142. [PubMed] [Google Scholar]
- 16.Del Prete GF, De Carli M, D'elios MM, Maestelli P, Ricci M, Fabbri L, Romagnani S. Allergen exposure induces the activation of allergen-specific Th2 cells in the airway mucosa of patients with allergic respiratory disorders. Eur J Immunol. 1993;23:1145. doi: 10.1002/eji.1830230707. [DOI] [PubMed] [Google Scholar]
- 17.Frew AJ, Bright S, Shrewry PR, Munro A. Proliferative response of lymphocytes of normal individuals to wheat proteins (gliadins) Int Arch Allergy Appl Immunol. 1980;62:162–7. doi: 10.1159/000232508. [DOI] [PubMed] [Google Scholar]
- 18.Jensen K, Sollid LM, Scott H, Paulsen G, Kett K, Thorsby E, Lundin KEA. Gliadin-specific T cell responses in peripheral blood of healthy individuals involve T cells restricted by the coeliac disease associated DQ2 heterodimer. Scand J Immunol. 1995;42:166–70. doi: 10.1111/j.1365-3083.1995.tb03640.x. [DOI] [PubMed] [Google Scholar]
- 19.Molberg Ø, Kett K, Scott H, Thorsby E, Sollid LM, Lundin KEA. Gliadin-specific, HLA DQ2 restricted T cells are commonly found in small intestinal biopsies from coeliac disease patients, but not from controls. Scand J Immunol. 1997;46:103–8. [PubMed] [Google Scholar]
- 20.Baker BS, Garioch JJ, Bokth S, Thomas H, Walker MM, Leonard JN, Fry L. Lack of proliferative response by gluten-specific T cells in the blood and gut of patients with dermatitis herpetiformis. J Autoimmun. 1995;8:561–74. doi: 10.1016/0896-8411(95)90008-x. [DOI] [PubMed] [Google Scholar]
- 21.Penttila IA, Gibson CE, Forrest BD, Cummins AG, Labrooy JT. Lymphocyte activation as measured by interleukin-2 receptor expression to gluten fraction III in coeliac disease. Immunol Cell Biol. 1990;68:155–60. doi: 10.1038/icb.1990.22. [DOI] [PubMed] [Google Scholar]
- 22.Liblau RS, Singer SM, McDevitt HO. Th1 and Th2 CD4+ T cells in the pathogenesis of organ-specific autoimmune disease. Immunol Today. 1995;16:34–38. doi: 10.1016/0167-5699(95)80068-9. [DOI] [PubMed] [Google Scholar]
- 23.Farrar JJ, Benjamin WR, Hilfiker ML, Howard M, Farrae WL, Fuller-Farrar J. The biochemistry, biology and role of interleukin-2 in the induction of cytotoxic T cell and antibody forming B cell responses. Immunol Rev. 1982;63:150–62. doi: 10.1111/j.1600-065x.1982.tb00414.x. [DOI] [PubMed] [Google Scholar]
- 24.ElGhazali GEB, Paulie S, Andersson G, Hansson Y, Sun JB, Olsson T, Ekre HP, Blomberg MT. Number of interleukin 4 and interferon-γ secreting human T cells reactive with tetanus toxoid and the mycobacterial antigen PPD or phythemagglutinin: distinct response profiles depending on the type of antigen used for activation. Eur J Immunol. 1993;23:2740–5. doi: 10.1002/eji.1830231103. [DOI] [PubMed] [Google Scholar]
- 25.Shimojo N, Kohono Y, Katsuki T, Honma K, Saito K, Niimi H. Diminished interferon-gamma (IFN-γ) production by bacterial antigen-specific T cells in atopic patients. Clin Exp Immunol. 1996;106:62–66. doi: 10.1046/j.1365-2249.1996.d01-816.x. [DOI] [PMC free article] [PubMed] [Google Scholar]
- 26.Breese EJ, Kumar P, Farthing MJ, MacDonald TT. Interleukin-2 and interferon-γ producing cells in the lamina propria in coeliac disease. Dig Dis Sci. 1994;39:2243. doi: 10.1007/BF02090378. [DOI] [PubMed] [Google Scholar]
- 27.Nilsen EM, Frode LJ, Lundin KEA, et al. Gluten induces an intestinal cytokine response strongly dominated by interferon gamma in patients with coeliac disease. Gastroenterol. 1998;115:551–63. doi: 10.1016/s0016-5085(98)70134-9. [DOI] [PubMed] [Google Scholar]
- 28.Hirano T, Akira S, Taga T, Kishimoto T. Biological and clinical aspects of interleukin 6. Immunol Today. 1990;11:443–9. doi: 10.1016/0167-5699(90)90173-7. [DOI] [PubMed] [Google Scholar]
- 29.McManus RM, Wilson AG, Mansfield J, Weir DG, Duff GW, Kelleher D. TNF2, a polymorphism of the tumour necrosis-alpha gene promoter, is a component of the coeliac disease major histocompatibility complex haplotype. Eur J Immunol. 1996;26:2113–8. doi: 10.1002/eji.1830260923. [DOI] [PubMed] [Google Scholar]
- 30.Stordeur P, Schandene L, Durez P, Gerard C, Goldman M, Velu T. Spontaneous and cycloheximide induced interleukin-10 expression in human mononuclear cells. Mol Immunol. 1995;32:233–9. doi: 10.1016/0161-5890(94)00158-w. [DOI] [PubMed] [Google Scholar]
- 31.Chomarat P, Rissoan M, Banchereau J, Miossec P. Interferon-γ inhibits interleukin 10 production by monocytes. J Exp Med. 1993;177:523–7. doi: 10.1084/jem.177.2.523. [DOI] [PMC free article] [PubMed] [Google Scholar]
- 32.Schwartz M, Majdic O, Knapp W, Holter W. High-level IL-10 production by monoclonal antibody-stimulated human T cells. Immunol. 1995;86:364–71. [PMC free article] [PubMed] [Google Scholar]
- 33.Clerici M, Wynn TA, Berzofsky JA, Blatt SP, Hendrix CW, Sher A, Coffman RL, Shearer GM. Role of Interleukin-10 in T helper cell dysfunction in asymptomatic individuals infected with the human immunodeficiency virus. J Clin Invest. 1994;93:768–75. doi: 10.1172/JCI117031. [DOI] [PMC free article] [PubMed] [Google Scholar]
- 34.Mahanty S, Ravichandran M, Raman U, Jayaraman K, Kumaraswami V, Nutman TB. Regulation of parasite antigen-driven immune responses by interleukin-10 (IL-10) and IL-12 in lymphatic filariasis. Int Immunol. 1997;65:1742–6. doi: 10.1128/iai.65.5.1742-1747.1997. [DOI] [PMC free article] [PubMed] [Google Scholar]
- 35.Weiner HL. Oral tolerance. Proc Natl Acad Sci USA. 1994;91:10762–5. doi: 10.1073/pnas.91.23.10762. [DOI] [PMC free article] [PubMed] [Google Scholar]
- 36.Molberg Ø, McAdam SW, Korner R, et al. Tissue transglutaminase selectively modifies gliadin peptides that are recognised by gut derived T cells in coeliac disease. Nat Med. 1998;4:713–7. doi: 10.1038/nm0698-713. [DOI] [PubMed] [Google Scholar]
- 37.Lundin KE, Sollid LM, Anthonsen D, Noren O, Molberg Ø, Thorsby E, Sjostrom H. Heterogeneous reactivity patterns of HLA-DQ restricted, small intestinal T cell clones from patients with coeliac disease. Gastroenterol. 1997;112:752–9. doi: 10.1053/gast.1997.v112.pm9041236. [DOI] [PubMed] [Google Scholar]