

Abstract
The number of NK T cells was measured in relation to the Th1/Th2 imbalance observed in RA. Peripheral blood samples of patients with RA (n = 60) and healthy controls (n = 36) were stained with anti-NK receptor 1A (anti-NKR-P1A), anti-CD56, and anti-CD3 MoAbs, and examined by three-colour flow cytometry. NK T (NKR-P1A+CD3+) cells in the peripheral blood were decreased in RA compared with the controls: 25 ± 20/μl versus 143 ± 53/μl (P < 0.0001). CD56+CD3+ cells were also decreased in RA: 60 ± 46/μl versus 116 ± 54/μl (P < 0.0001). The decrease was significant when adjusted to the number of total lymphocytes (P < 0.0001) or NK (CD56+CD3−) cells (P < 0.0001), and showed no correlation with age, sex, disease duration, disease activity, functional class, x-ray stage, drug treatment, joint score, grip strength, C-reactive protein, rheumatoid factor or erythrocyte sedimentation rate of the patients. The results show that the levels of NK T cells are depressed in the peripheral blood of patients with RA, suggesting that the measurement of NK T cells in peripheral blood may have clinical importance for a Th1-type autoimmune disease like RA.
Keywords: NKR-P1, CD161, natural killer T cell, rheumatoid arthritis, Th1/Th2 imbalance
INTRODUCTION
NK T cells, uniquely expressing both NK and T cell markers, play an important role in the regulation of the immune response [1]. Human NK T cells express the C-type lectin molecule NK receptor protein 1 (NKR-P1, CD161) which is the homologue of murine NK1 [2]. In addition, these cells express the invariant Vα24-JαQ TCR-α in humans and Vα14-Jα281 in mice, and have restricted use of Vβ11 TCR-β in humans and Vβ8, Vβ7 or Vβ2 in mice, which together recognize the MHC class I-like CD1d protein [2–4].
NK T cells produce both IL-4 and interferon-gamma (IFN-γ) upon stimulation by anti-TCR-αβ antibody [5], and IFN-γ upon stimulation through NKR-P1 [6]. Recent findings have shown that IL-4 produced from NK T cells plays a major role in promoting the differentiation of T cells into Th2 cells [7,8]. The selective reduction of NK T cells has been detected in autoimmune-prone MRL-lpr/lpr or C3H gld/gld mice [9], non-obese diabetic mice [10] and also in patients with systemic sclerosis [11] and insulin-dependent diabetes mellitus [12]. Furthermore, the dominance of Th1 over Th2 cells has been reported in RA [13].
We measured the number of NK T cells in the peripheral blood of patients with RA. The results show that NK T cells are significantly decreased in the peripheral blood of patients with RA. This finding is discussed in relation to the imbalance between Th1 and Th2 cells in RA.
PATIENTS AND METHODS
Patient profile
Peripheral blood samples of 60 out-patients with RA (mean age 59.0 ± 10.2 years; 45 women and 15 men) who met the American College of Rheumatology (ACR; formerly the American Rheumatism Association) diagnostic criteria, were obtained with informed consent for use in this study (Table 1). Disease-modifying anti-rheumatic drugs (DMARDs) used by the patients were: 25 mg of gold sodium thiomalate biweekly (n = 17); 100–200 mg of d-penicillamine or 150 mg of bucillamine daily (n = 14); 1.0 g of sulfasalazine daily (n = 3); 5–7.5 mg of methotrexate weekly (n = 23); 50 mg of azathioprine daily (n = 1); 5 mg of prednisolone daily (n = 30), prednisolone being prescribed either singly (n = 2) or in combination with the aforementioned DMARDs (n = 28) (Table 2). Healthy controls (n = 36; mean age 39.2 ± 11.8 years; all women) recruited from the medical staff with informed consent for the study (Table 1) were significantly younger than RA patients as examined by Wilcoxon rank sum test (P < 0.0001).
Table 1.
Patient profile

*Number of patients.
†Mean
± s.d.‡Range.
Table 2.
Drugs used in study period

*Number of patients.
MTX, Methotrexate; AZ, azathioprine; GST, gold sodium thiomalate; SH, d-penicillamine or bucillamine; PSL, prednisolone; SSZ, sulfasalazine.
Reagents
Mouse MoAb IgG1 anti-human NKR-P1A (DX1) [14] was kindly provided by the DNAX Research Institute (Palo Alto, CA). FITC-conjugated goat Fab anti-mouse IgG antibody was purchased from Cappel, Organon Teknika Corp. (Durham, NC). PE-conjugated IgG1 anti-human CD56 (Leu-19) MoAb, peridinin chlorophyll protein (PerCP)-conjugated IgG1 anti-human CD3 (Leu-4) MoAb, and isotype-matched labelled mouse IgG1 were purchased from Becton Dickinson (San Jose, CA).
Immunostaining and flow cytometry
Peripheral blood, anti-coagulated with EDTA, was collected and the cell number was adjusted using automatic cell counter (Sysmex K4500; TOA Medical Electronics Co., Ltd, Kobe, Japan). Each blood sample (100 μl) was reacted with 0.2 μg of anti-NKR-P1A MoAb on ice for 30 min. After washing, the cells were reacted with FITC–anti-mouse IgG on ice for 30 min. Anti-mouse IgG was then neutralized using total mouse IgG (Sigma Chemical Co., St Louis, MO), and the cells were stained with PE–anti-CD56 MoAb and PerCP–anti-CD3 MoAb on ice for 30 min. Isotype-matched FITC-, PE- and PerCP-conjugated mouse IgG1 were used as controls. Three-colour flow cytometry was performed by using a FACSort and the data were analysed using Cell Quest software (Becton Dickinson).
Statistical analysis
Statistical analyses were performed using SAS 6.12 software (SAS Institute Inc., Cary, NC). Data were expressed using box-whisker plots. The horizontal upper, middle and bottom lines of the box indicate 75th, 50th and 25th percentile of all plots, respectively. The vertical whisker through the box shows the data of 10th to 90th percentile. The dot indicates the mean of data. Non-parametric statistical analyses were carried out using Wilcoxon rank sum test, Kruskal–Wallis test and Spearman's rank order correlation test.
RESULTS
Profile of NK T cell in peripheral blood
We defined the NK T cell population as NKR-P1A+CD3+ [2]. The NK T cell population was distinct from conventional T (CD3+CD56−NKR-P1A−), NK (CD56+CD3− or NKR-P1A+CD3−), and CD56+CD3+ (T cell with the NK marker) populations. The NK T cell population was further divided into CD56+ and CD56− cell populations. Typical contour plots of NK T cells of RA patients (Fig. 1a,b) and of healthy controls (Figs 1c,d) show that the NK T population was considerably decreased in the peripheral blood of RA.
Fig. 1.

A contour plot of NK T cells. Peripheral blood was stained by three-colour flow cytometry using FITC anti-mouse IgG/anti-NKR-P1A (DX1), PE anti-CD56 (Leu-19) and PerCP anti-CD3. More than 95% of the cells in the negative control sample stained by fluorochrome-conjugated isotype-matched antibodies was within the lower left quadrant of the contour plot. Typical contour plots of a rheumatoid patient (RA) (a,b) and of a healthy control (c,d) are shown.
Comparison of NK T cell between RA and control
Each category of lymphocytes, NK T and CD56+CD3+ cells was significantly decreased in the peripheral blood of RA patients compared with healthy controls (Fig. 2a–c). A marked difference was observed in the number of NK T cells: the number of NK T and CD56+CD3+ cells in RA patients was 5.8 (25 ± 20/μl in RA versus 143 ± 53/μl in control; P < 0.0001) and 1.9 (60 ± 46/μl in RA versus 116 ± 54/μl in control; P < 0.0001) times lower than that of healthy controls, respectively. The difference was also significant when the NK T cells were divided into CD56+ and CD56− subsets (Fig. 2d,e). There was, however, no difference in the number of conventional NK (CD56+CD3−) cells (Fig. 2f) between RA patients and healthy controls. The percentage of NK T or CD56+CD3+ cells among lymphocytes (Fig. 2g,h) was significantly decreased in RA, and the ratio of NK T/NK (NKR-P1A+CD3+/CD56+CD3−) was also significantly decreased: 0.116 in RA versus 0.633 in healthy controls (Fig. 2i).
Fig. 2.

Lymphocytes, NK T cells and NK cells in the peripheral blood of patients with RA (n = 60) and healthy subjects (n = 36). The numbers of lymphocytes (a), NKR-P1A+CD3+ (NK T) cells (b), CD56+CD3+ cells (c), CD56+ NK T cells (d), CD56− NK T cells (e) and conventional NK (CD56+CD3−) cells (f) were measured by flow cytometry. The percentage of NK T cells within lymphocytes (g) and the percentage of CD56+CD3+ cells within lymphocytes (h), and the ratio of NK T cells versus conventional NK cells (i) are depicted. Data in box-whisker plots were statistically analysed by Wilcoxon rank sum test.
NK T cell and patient profile
The number of NK T cells in RA patients was compared with age, sex, disease activity, functional class and x-ray staging (Fig. 3). Although there was a significant difference in age between RA patients and controls (P < 0.0001), the number of NK T cells in neither patient nor control group independently showed correlation with age (Fig. 3a). Thus, NK T cells were consistently decreased irrespective of patients' age. There were no significant differences in sex, disease activity, functional class and x-ray stage of patients (Fig. 3b–e). The number of NK T cells also showed no correlation with disease duration, joint score, grip strength, C-reactive protein (CRP), rheumatoid factor and erythrocyte sedimentation rate (data not shown). A weak correlation existed between the number of NK T cells and serum γ-globulin by the Spearman's rank order correlation test (r = 0.34, P = 0.008, data not shown).
Fig. 3.
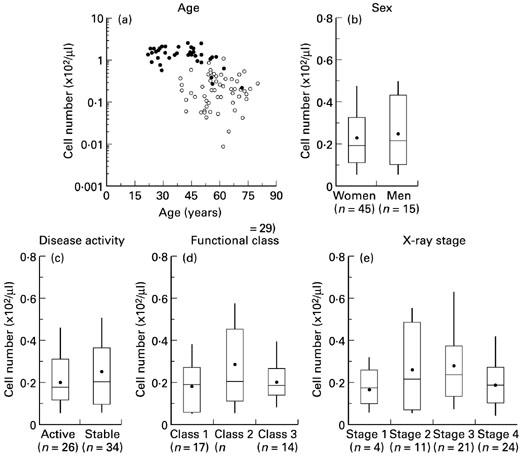
Patient profile and the number of NKR-P1A+CD3+ (NK T) cells. (a) Contribution of age to the number of NK T cell in rheumatoid patients (RA) (○, n = 60) and healthy controls (•, n = 36) was independently assessed by Spearman's rank order correlation test. (b,c,d,e) The number of NK T cells and categorical data based on patients' profiles. RA was defined active when either C-reactive protein or joint score exceeded 2.0 mg/dl or 10. Statistical analyses made by Wilcoxon rank sum test or Kruskal–Wallis test.
Influence of drug treatment on NK T cell in RA patients
Since patients were receiving DMARDs singly or in combination, the influence of drugs on the number of NK T cells was compared by the Kruskal–Wallis test. A significant contribution of drugs to NK T cell numbers was not found (Fig. 4).
Fig. 4.
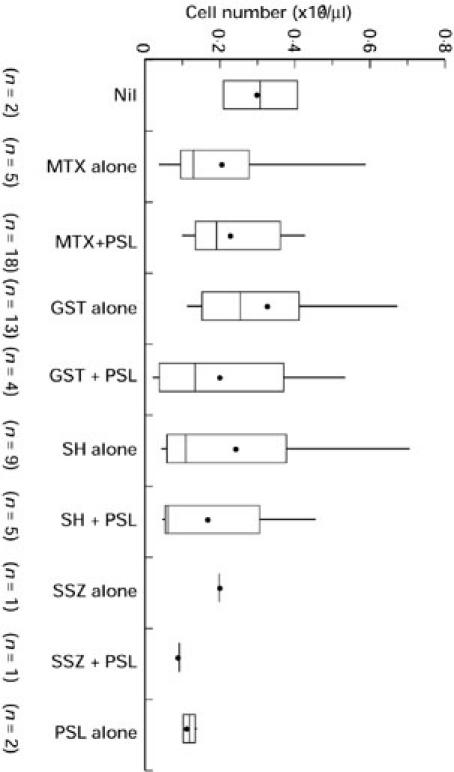
Drug treatment and the number of NKR-P1A+CD3+ (NK T) cells in patients with RA. Differences between each group were assessed by the Kruskal–Wallis test. MTX, Methotrexate; GST, gold sodium thiomalate; SH, d-penicillamine or bucillamine; SSZ, sulfasalazine; PSL, prednisolone.
DISCUSSION
Our results show that NK T cell numbers are significantly decreased in the peripheral blood of patients with RA. There are several possible explanations for the decrease of NK T cells in RA. First, the decrease of NK T cells may reflect the state of disease activation in RA. There appeared to be no such correlation between the number of NK T cells and inflammatory disease activity of the patients with RA in our study, but the decrease of NK T cells may be associated with activation of the NKR-P1 molecule. Chen et al. have shown that upon activation, NK1.1+CD4+ T cells lose the NK1.1 surface marker, the marker which corresponds to the human NKR-P1 molecule [15]. Second, the decrease might come from the difference in the homing of NK T cells or other lymphocyte populations to the inflammatory joints. Since we did not study NK T cells in other inflammatory disease conditions, we could not conclude whether or not depletion of NK T cells was intrinsic to RA. Nevertheless, we can argue that the depletion of NK T cells could be intimately related to RA or to arthritic disease conditions. Third, the decrease of NK T cells may be intrinsic to RA, and family studies of recently discovered genetic markers [16,17] may be helpful in this regard.
Chen et al. have shown that L cells expressing CD1 (L-CD1) stimulate NK1.1+CD4+ NK T cells to produce IL-4 [8]. IL-4 produced from NK T cells plays a major role in enforcing T cells to differentiate into Th2 cells [7,8]. A weak correlation between NK T cell and serum γ-globulin, as observed in the present study, may be associated with this type of stimulation toward antibody synthesis. On the other hand, NK cells produce IFN-γ upon stimulation of IL-12 [18,19] or NKR-P1 [5], and stimulate T cells to differentiate into Th1 cells. The number of conventional NK cells was similar between RA patients and the controls in the present study. We found that the NK T/NK ratio was significantly decreased in RA. Thus, a significant decrease of NK T cell in RA patients as observed in the present study could have important implications for the increase in the Th1/Th2 ratio found in RA [13,20]. A recent study showing that the Th1/Th2 ratio did not correlate with the disease activity or CRP, whereas the Th1/Th2 ratio significantly correlated with the efficacy of DMARDs treatment, in RA may also be relevant [21]. The nature of the NK T cell which tends to differentiate extrathymically seems interesting in relation to the immunological tolerance against antigen which could lead to chronic arthritis [22]. These findings altogether would suggest that measurement of NK T cells in peripheral blood may have prognostic importance for a Th1-type autoimmune disease like RA.
Acknowledgments
This work was supported by Otsuka Pharmaceutical Co., Ltd, Japan, and the grant-in-aid for scientific research nos 07557225 and 08457153 of the Ministry of Education, Science, Sports and Culture of Japan.
REFERENCES
- 1.Bix M, Locksley RM. Natural T cells: cells that co-express NKRP-1 and TCR. J Immunol. 1995;155:1020–2. [PubMed] [Google Scholar]
- 2.Exley M, Garcia J, Balk SP, Porcelli S. Requirements for CD1d recognition by human invariant Vα24+ CD4− CD8− T cells. J Exp Med. 1997;186:109–20. doi: 10.1084/jem.186.1.109. [DOI] [PMC free article] [PubMed] [Google Scholar]
- 3.Kawano T, Cui J, Koezuka Y, et al. CD1d-restricted and TCR mediated activation of Vα14 NKT cells by glycosylceramides. Science. 1997;278:1626–9. doi: 10.1126/science.278.5343.1626. [DOI] [PubMed] [Google Scholar]
- 4.Lantz O, Bendelac A. An invariant T cell receptor α chain is used by a unique subset of major histocompatibility complex class I-specific CD4+ and CD4−CD8− T cells in mice and humans. J Exp Med. 1994;180:1097–106. doi: 10.1084/jem.180.3.1097. [DOI] [PMC free article] [PubMed] [Google Scholar]
- 5.Arase H, Arase N, Nakagawa K, Good RA, Onoé K. NK1.1+ CD4+ CD8− thymocytes with specific lymphokine secretion. Eur J Immunol. 1993;23:307–10. doi: 10.1002/eji.1830230151. [DOI] [PubMed] [Google Scholar]
- 6.Arase H, Arase N, Saito T. Interferon γ production by natural killer (NK) cells and NK1.1+ T cells upon NKR-P1 cross-linking. J Exp Med. 1996;183:2391–6. doi: 10.1084/jem.183.5.2391. [DOI] [PMC free article] [PubMed] [Google Scholar]
- 7.Yoshimoto T, Paul WE. CD4pos, NK1.1pos T cells promptly produce interleukin 4 in response to in vivo challenge with anti-CD3. J Exp Med. 1994;179:1285–95. doi: 10.1084/jem.179.4.1285. [DOI] [PMC free article] [PubMed] [Google Scholar]
- 8.Chen H, Paul WE. Cultured NK1.1+CD4+ T cells produce large amounts of IL-4 and IFN-γ upon activation by anti-CD3 or CD1. J Immunol. 1997;159:2240–9. [PubMed] [Google Scholar]
- 9.Mieza MA, Itoh T, Cui JQ, et al. Selective reduction of Vα14+ NK T cells associated with disease development in autoimmune-prone mice. J Immunol. 1996;156:4035–40. [PubMed] [Google Scholar]
- 10.Godfrey DI, Kinder SJ, Silvera P, Baxter AG. Flow cytometric study of T cell development in NOD mice reveals a deficiency in α/βTCR+CD4−CD8− thymocytes. J Autoimmun. 1997;10:279–85. doi: 10.1006/jaut.1997.0129. [DOI] [PubMed] [Google Scholar]
- 11.Sumida T, Sakamoto A, Murata H, et al. Selective reduction of T cells bearing invariant Vα24JαQ antigen receptor in patients with systemic sclerosis. J Exp Med. 1995;182:1163–8. doi: 10.1084/jem.182.4.1163. [DOI] [PMC free article] [PubMed] [Google Scholar]
- 12.Willson SB, Kent SC, Patton KT, et al. Extreme Th1 bias of invariant Vα24JαQ T cells in type 1 diabetes. Nature. 1998;391:177–81. doi: 10.1038/34419. [DOI] [PubMed] [Google Scholar]
- 13.Simon AK, Seipelt E, Sieper J. Divergent T-cell cytokine patterns in inflammatory arthritis. Proc Natl Acad Sci USA. 1994;91:8562–6. doi: 10.1073/pnas.91.18.8562. [DOI] [PMC free article] [PubMed] [Google Scholar]
- 14.Lanier LL, Chang C, Phillips JH. Human NKR-P1A. A disulfide-linked homodimer of the C-type lectin superfamily expressed by a subset of NK and T lymphocytes. J Immunol. 1994;153:2417–28. [PubMed] [Google Scholar]
- 15.Chen H, Haung H, Paul WE. NK1.1+CD4+ T cells lose NK1.1 expression upon in vitro activation. J Immunol. 1997;158:5112–9. [PubMed] [Google Scholar]
- 16.Shiozawa S, Hayashi S, Tsukamoto Y, et al. Identification of the gene loci that predispose to rheumatoid arthritis. Int Immunol. 1998;10:1891–5. doi: 10.1093/intimm/10.12.1891. [DOI] [PubMed] [Google Scholar]
- 17.Cornélis F, Fauré S, Martinez M, et al. New susceptibility locus for rheumatoid arthritis suggested by a genome-wide linkage study. Proc Natl Acad Sci USA. 1998;95:10746–50. doi: 10.1073/pnas.95.18.10746. [DOI] [PMC free article] [PubMed] [Google Scholar]
- 18.D'Andrea A, Rengaraju M, Valiante NM, et al. Production of natural killer cell stimulatory factor (interleukin 12) by peripheral blood mononuclear cells. J Exp Med. 1992;176:1387–98. doi: 10.1084/jem.176.5.1387. [DOI] [PMC free article] [PubMed] [Google Scholar]
- 19.Chan SH, Perussia B, Gupta JW, et al. Induction of interferon γ production by natural killer cell stimulatory factor: characterization of the responder cells and synergy with other inducers. J Exp Med. 1991;173:869–79. doi: 10.1084/jem.173.4.869. [DOI] [PMC free article] [PubMed] [Google Scholar]
- 20.Dolhain RJEM, van der Heiden AN, ter Haar NT, Breedveld FC, Miltenburg AMM. Shift toward T lymphocytes with a T helper 1 cytokine-secretion profile in the joints of patients with rheumatoid arthritis. Arthritis Rheum. 1996;39:1961–9. doi: 10.1002/art.1780391204. [DOI] [PubMed] [Google Scholar]
- 21.Van der Graaff WL, Prins APA, Dijkmans BAC, van Lier RAW. Prognostic value of Th1/Th2 ratio in rheumatoid arthritis. Lancet. 1998;351:1931. doi: 10.1016/s0140-6736(05)78615-3. [DOI] [PubMed] [Google Scholar]
- 22.Makino Y, Koseki H, Adachi Y, Akasaka T, Tsuchida K, Taniguchi M. Extrathymic differentiation of a T cell bearing invariant Vα14Jα281 TCR. Int Rev Immunol. 1994;11:31–46. doi: 10.3109/08830189409061715. [DOI] [PubMed] [Google Scholar]