Abstract
The functional activity and the expression of CR1 on the erythrocytes (E) of patients with SLE were, respectively, determined by measuring the binding to E of either complement-opsonized bovine serum albumin (BSA)–anti-BSA immune complexes (ICC) or specific anti-ECR1 MoAbs. We found that both the functional activity and levels of ECR1 in SLE patients homozygous for ECR1 high density allele were significantly lowered compared with healthy controls having the same allele. Soon after plasmapheresis there was a significant increase in E ICC binding activity, and this increased functional activity was stable. Moreover, plasmapheresis reduced the level of immune complexes demonstrable in the circulation of the patients. The expression of ECR1 determined with several different anti-CR1 MoAbs was also elevated as a consequence of plasmapheresis. This elevation was observed for both MoAb 1B4, which competes for the ICC binding site of ECR1, and for MoAb HB8592, which does not, but the time course for the increase in binding of the two MoAbs was different, in that the epitope recognized by MoAb 1B4 increased more rapidly. The present results, considered in the context of previous findings, suggest that more than one mechanism may be operative with respect to the effects of the plasmapheresis in increasing ECR1 levels defined by different epitopes on the molecule.
Keywords: systemic lupus erythematosus, erythrocyte CR1, plasmapheresis, immune complex, clearance
INTRODUCTION
Low expression of CR1 (CD35) on erythrocytes (E) of patients with SLE is associated with defective clearance of circulating immune complexes containing C3b/C4b (CICC), and so it may have pathogenic significance [1–3]. The in vivo binding of CICC by E CR1 (ECR1) is a relatively transient phenomenon. In vitro studies indicate that C3b-opsonized immune complexes (ICC) are released from ECR1 following enzymatic cleavage of C3b to iC3b and C3dg by factor I. It is also recognized that the movement of E bearing ICC through the liver and spleen [4,5] leads to rapid clearance of the complexes by these organs, but the exact mechanism of this transfer reaction may be due to one or more independent mechanisms [6,7]. The data of CR1 gene analysis suggest that the deficiency of ECR1 expression is acquired in SLE [8,9], and therefore different medications [10] or the nature of the environment of the E in the circulation may effectively influence ECR1 expression. Plasmapheresis is a well-known approach in interrupting pathogenic events in SLE [11–13]. The mechanical removal of CICC during plasmapheresis may result in the decreased level of immune complexes bound in vivo to ECR1, and therefore plasmapheresis may increase the free ligand binding site (specific for C3b) on ECR1. On the other hand, plasmapheresis may lead to the release of fresh young erythrocytes into the circulation, bearing increased numbers of CR1 [14,15].
Therefore in the present study we investigated the effect of plasmapheresis both on functional activity and the expression of ECR1 of patients with SLE. For the determination of functional activity the in vitro binding of complement containing bovine serum albumin (BSA)–anti-BSA to E via CR1 was determined. CR1 expression was tested using different MoAbs, one of which competes for the ICC (C3b) binding site of ECR1 and another one which does not.
MATERIALS AND METHODS
Subjects
Blood samples were obtained from 11 patients with SLE (eight women and three men). The patients were selected on the basis of at least four of the revised ACR criteria for classification of SLE [16] and CR1 genotype according to the homozygous genotype for the CR1/E high density allele or not. The investigated SLE patients and the 10 healthy volunteers were homozygous for the ECR1 high density allele [9]. Clinically active disease [17] (in eight cases) or ineffectiveness of previous permanent treatment, i.e. lack of improvement of clinical state and serological parameters (in three cases) indicated the necessity for plasmapheresis. Some important data of patients are detailed as follows. One of them had systemic vasculitis, five patients had histologically proven glomerulonephritis, while five patients were selected for plasmapheresis with active lupus nephritis refractory to conventional therapies. Previous therapies were corticosteroid + azathioprine (in four cases), corticosteroid + cyclophosphamide (in four cases), and corticosteroid + azathioprine + cyclophosphamide (in three cases). Patients with severe cardiovascular disease, history of cancer, pregnancy or clotting abnormalities were excluded. Informed consent was obtained from both the patients and healthy volunteers.
Plasmapheresis
Plasmapheresis was carried out with a Fenwal CS-3000 Plus continuous flow type blood cell separator; 1000 ml plasma were removed three times, every other day, during a 1-week period from all patients who also received 1 mg/kg body weight corticosteroid during this procedure. Plasmapheresis was synchronized with 800 mg cyclophosphamide to prevent the rebound reaction [18]. In every case the removed plasma was replaced by infusions of albumin or other plasma expanders and crystalloid solution, so patients’ blood volumes were kept constant to prevent the stimulatory effect of phlebotomy on erythropoiesis. Haemoglobin concentrations and the haematocrit values remained around the baseline levels during plasmapheresis.
Immune serological data
Blood samples were taken from the patients just before and 24 h after each plasmapheresis. To define the times for sampling reported below, presume the first plasmapheresis was conducted on a Monday. Thus, ‘2/24’ refers to blood taken on Thursday, which would be 24 h after the second plasmapheresis. Similarly, ‘1/0’ refers to blood taken on Monday, before the first plasmapheresis. Sera were collected and kept at − 70°C until analysis. Anti-dsDNA antibodies were assessed by an ELISA method described previously [19]. Levels of C3 and C4 complement components were quantified by single radial immunodiffusion. IC in sera were detected by polyethylene glycol precipitation [20]. Blood samples for ECR1 assay were examined immediately after being obtained.
Complement containing BSA–anti-BSA binding to E
The ECR1 binding assay was performed before and 24 h after each plasmapheresis [21]. Briefly, rabbit antiserum to BSA (Sigma, St Louis, MO; product no. A 7638) was prepared and the IgG from the antiserum was isolated (Department of Immunology, L. Eötvös University, Göd, Hungary). The BSA was radiolabelled with 125I by the Iodogen method [22]. BSA–anti-BSA complexes were prepared at × 4 antibody excess of equivalence and then used immediately in Parker 190 tissue culture medium (Gibco, Paisley, UK). Human E were isolated from 5 ml anti-coagulated blood. After washing, a 50% E suspension was prepared in Parker medium. For formation of complement containing complex the 125I-BSA–anti-BSA was incubated with normal human serum diluted 1:10 with Parker medium for 8 min at 37°C. Then the samples were incubated for 16 min at 37°C in a waterbath with 200 μl 50% E (4 × 10⁹ cells/100 μl). After washing, cell-bound radioactivity was determined. All experiments were performed in triplicate. As background control the complex was incubated with heat-inactivated serum, or complement containing complex was incubated with sheep erythrocytes instead of human E. The specific binding of complement containing BSA–anti-BSA complex to ECR1 was expressed as a percentage of the total complex added to the E. Background control was subtracted from each sample.
Expression of CR1 on human E
The following anti-CR1 MoAbs were used: MoAb J3D3 (IOT17; Coulter-Immunotech, Marseille, France), MoAb 1B4 and MoAb HB8592 [23,24].
Radioimmunoassay
MoAbs were labelled with 125I by the Iodogen method to specific activities of 0.1–0.5 μCi/μg [22]. The number of CR1 on E was quantified by the method of Edberg et al. [5] with slight modifications. Briefly, 200 μl of a 1-μg/ml solution of 125I-labelled antibody (saturating amount) were added to 200 μl of a 2% suspension (2 × 10⁷ cells/100 μl) of washed human E in PBS pH 7.4 containing 1% BSA (BPBS). After incubation for 1 h at room temperature with periodical shaking the samples were chilled at 4°C, and then the E were washed three times with cold BPBS and the bound 125I-labelled MoAb was measured. Sheep E were used to establish the background control. The numbers of CR1 per E were calculated on the basis of the amount of specifically bound radiolabelled MoAb and the number of E.
Flow cytometric method
The number of CR1 on erythrocytes was determined using MoAb-coated standard beads and flow cytometry as described elsewhere [25]. Briefly, the washed human E (1:100 diluted whole blood) were labelled by saturating amount (10 μg/ml) of IOT17 anti-CR1 MoAb for 30 min on ice. The non-bound MoAbs were washed away and goat anti-mouse IgG FITC-labelled conjugate (Fab2 fragment; Dako, Copenhagen, Denmark; 1:50 dilution) was added. The same concentration of the conjugate was given to a series of MoAb-coated standard beads (Dako Qifikit). After 45 min incubation on ice and then a washing step the mean fluorescence intensity (MFI) of 10 000–30 000 erythrocytes or beads was measured in a Coulter Epics XL flow cytometer (Coulter, Hialeah, FL). The MFI from the various standard beads was plotted against the given number of MoAbs per bead (in a log/log scale) and by linear regression converted into a standard curve. The MFI of the E were converted to number of MoAbs (CR1 binding site) per cell using this standard curve. As background control the E were incubated with the second step conjugate alone and the calculated number of binding sites per cell was subtracted from each sample.
Statistical analysis
The mean values of data for different groups, the s.d. and coefficient of variation (CV) of the mean values and the statistical significance (by means of Student's t-test) were calculated. The relationship between the ECR1 receptor numbers determined by two different methods, as well as the relationships between functional activity and expression of ECR1 and also between the CIC level and ECR1, were assessed using the Spearman rank correlation method. The correlation coefficient (r) and the significance (P) for the plot was calculated. Paired Student's t-test was used for analysing the changes of data measured before and after plasmapheresis.
RESULTS
ECR1 functional activity
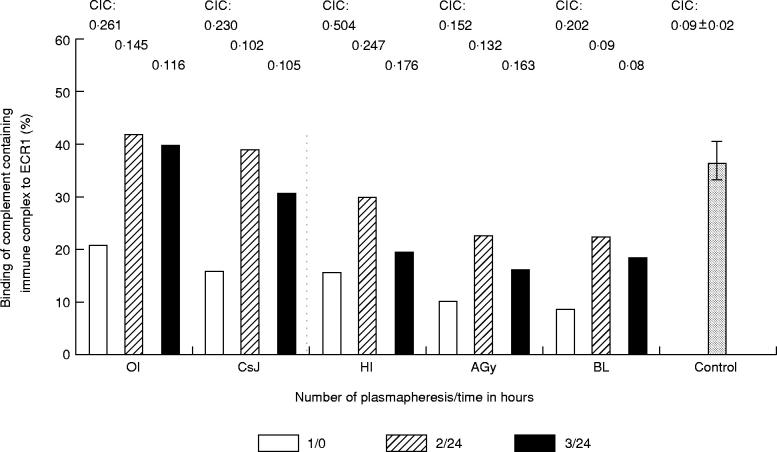
Before plasmapheresis the functional activity of ECR1 was significantly impaired in five patients with SLE. ICC binding of SLE erythrocytes was 14.2 ± 5.42% (expressed as mean ± s.d.) compared with those of normal controls, 36.4 ± 4.8%. However, 24 h after the second plasmapheresis (see ‘2/24’, Fig. 1) the binding of ICC to ECR1 improved in all cases, but the rates of increase were different. The ECR1 functional activity reached the mean value of healthy individuals in two patients. After the last plasmapheresis (see ‘3/24’, Fig. 1) the differences between pre- and post-plasmapheresis data were not as high in only one patient (OI). The decrease of ICC binding between the second and third plasmapheresis was not significant, apart from the value of one patient (HI).
Fig. 1.
Binding of ICC to erythrocytes (E) of patients with SLE during plasmapheresis. 125I-bovine serum albumin (BSA)–anti-BSA was incubated with normal human serum (AB Rh +) and the ICC were incubated with 50% suspension of washed E. The measurements were carried out before (0) and 24 h after (24) each plasmapheresis. The columns represent the individual values of five patients of SLE (OI, CsJ, HI, Agy, BL): the percentage of total complex which was bound to E before the first (1/0) and after the second (2/24) and third (3/24) plasmapheresis. The last column represents the mean bindings (± s.d.) of ICC to E of five normal controls. Individual levels of circulating immune complex (CIC) of patients and the mean value of CIC for controls are represented above the columns.
Circulating immune complex levels decreased during plasmapheresis. Data of each patient are presented in Fig. 1. This result suggests that the mechanical removal of serum ICC during plamapheresis may result in the decreased level of ICC bound in vivo to ECR1, and this is the explanation for an increase of the C3b binding site (see below) and the ICC binding capacity of ECR1 (Fig. 1) after plasmapheresis. To support this hypothesis, in a following experiment we performed plasmapheresis in six other SLE patients, and the expression of ECR1 was tested in parallel with immune serological data.
ECR1 expression
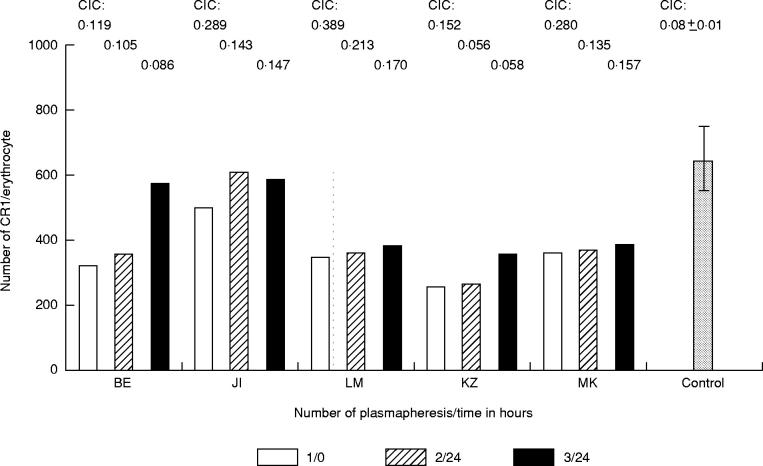
The number of CR1 determined with J3D3 MoAb labelled with 125I was lower on E of five patients with SLE (364 ± 112 (mean ± s.d.)) compared with the E of controls (675 ± 96). Data from these five patients before and after plasmapheresis are presented in Fig. 2. The expression of CR1 on E of patients subjected to plasmapheresis improved in all cases. In view of the fact that the number of CR1 on normal human E is intrinsically low (but higher than seen in SLE patients), the expression of this receptor was determined in parallel with additional methods. The number of binding sites of J3D3 per E of patients with SLE determined by a flow cytometric method was also low (Fig. 3). When the receptor numbers determined with these two different methods were statistically compared, the result was significantly similar (Fig. 3, P < 0.006, r = 0.62).
Fig. 2.
CR1 number on erythrocytes (E) of five patients with SLE before the first and after the last plasmapheresis. 125I-labelled J3D3 MoAb was added to 2% suspension of washed E. After 1 h incubation and washing the cell-bound radioactivity was measured. The columns represent the individual data of five patients with SLE (BE, JI, LM, KZ, MK) before and after the plasmapheresis. The last column presents the mean number of ECR1 (± s.d.) of five normal controls. Individual levels of circulating immune complex (CIC) of patients and the mean value of CIC for controls are represented above the columns.
Fig. 3.
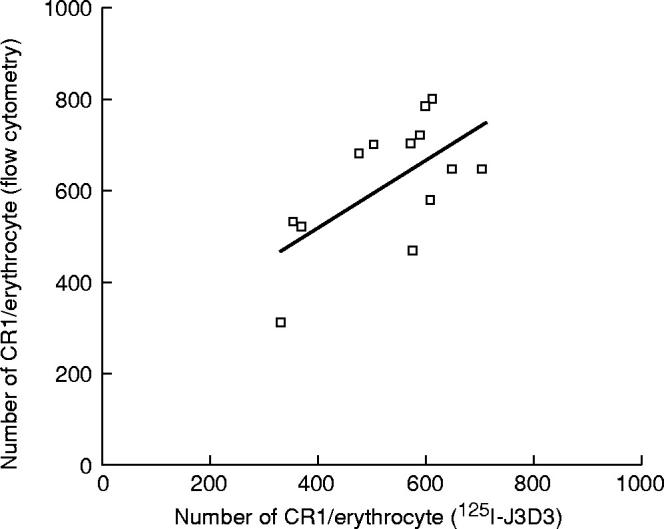
Correlation between CR1 number assayed by 125I-labelled J3D3 MoAb and by MoAb-coated standard beads and flow cytometry on erythrocytes (E) of three patients with SLE and 10 normal controls (r = 0.62, P < 0.006). The three low CR1 numbers belong to E of SLE patients.
Expression of ECR1 during plasmapheresis
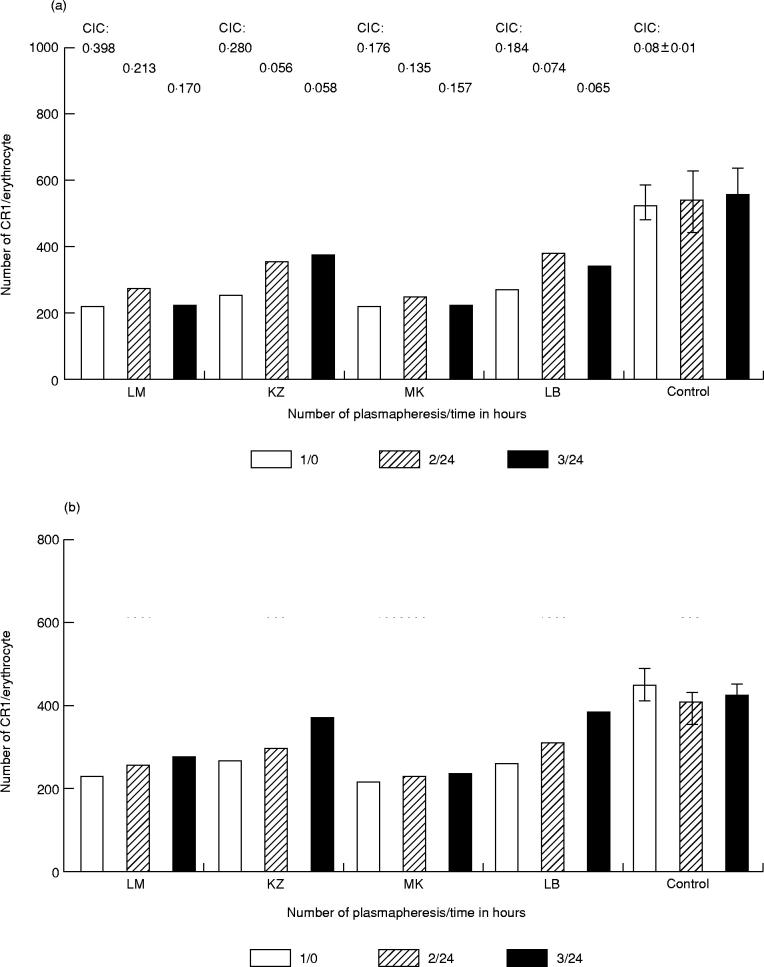
During plasmapheresis the number of CR1 on E of four SLE patients was determined with MoAb 1B4 which competes with the ICC binding site on ECR1 and with MoAb HB8592, which does not bind to this site. The data of these four patients (Fig. 4) indicate that ECR1 numbers were elevated after plasmapheresis using either 1B4 or HB8592 as the detecting reagents. It is important to note that the increase detected with MoAb 1B4 was significant 24 h after the second plasmapheresis in all cases with the exception of one patient (MK), and it remained increased after the last plasmapheresis (Fig. 4a). However, a significant increase in ECR1 levels detected with HB8592 was demonstrable only after the last plasmapheresis in these three patients (Fig. 4b). The CR1 levels on E of the three patients are further summarized in Table 1, in which the levels before and after each plasmapheresis step are reported. The increase of ECR1 number was more pronounced using 1B4 MoAb, which competes for ICC binding sites, than using HB8592, which does not.
Fig. 4.
Characterization of erythrocyte (E) CR1 on E of four patients with SLE before the first and after the second and third plasmapheresis. E were reacted with 125I-labelled MoAb 1B4 (a) or HB8592 (b) for 1 h at room temperature. The E-bound specific radioactivity was detected and the receptor numbers were calculated. The columns represent individual data of patients (LM, KZ, MK, LB). The last three columns represent the mean CR1 number (± s.d.) of E for three control persons detected during a 1-week period in each experiment. Individual levels of circulating immune complex (CIC) and mean value (± s.d.) of CIC for controls are represented above the columns. Note that the coefficient of variation (CV) between control individuals was < 16% using MoAb 1B4 and < 10% using MoAb HB8592. The CV for one control individual was 9.4% using MoAb 1B4 and 7.3% using MoAb HB8592 in interday assays.
Table 1.
Levels of erythrocyte (E) CR1 of patients with SLE before and after plasmapheresis. CR1 antigenic sites on erythrocytes of four patients were enumerated with 125I-labelled MoAbs HB8592 and 1B4 before (3) and after (3) each plasmapheresis

In normal individuals the number of binding sites for MoAb 1B4 on E was higher than that for MoAb HB8592. This ratio was not changed significantly from one day to the next (1.2–1.3).
In vitro binding of complement containing BSA–anti-BSA to E
E isolated from one normal individual and one SLE patient were incubated with MoAb 1B4 and HB8592 for 1 h at room temperature. This experiment was performed in triplicate. After washing, E were incubated with complement containing 125I-BSA–anti-BSA complexes for 16 min at 37°C. The specific binding of the complex to E was determined. The data of Fig. 5 show that MoAb 1B4 interferes with the binding of the complement containing immune complex, while MoAb HB8592 does not.
Fig. 5.
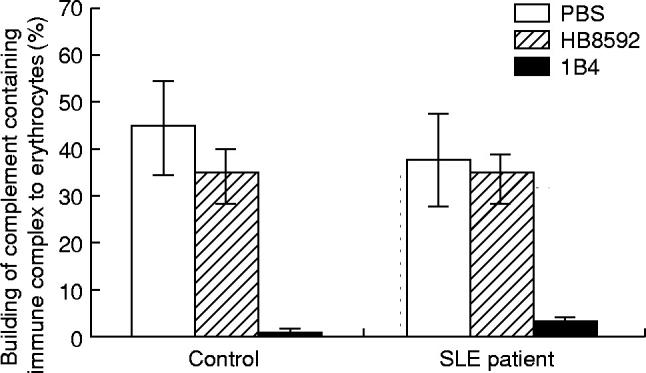
Effect of preincubation of erythrocytes (E) with MoAbs on binding of complement containing immune complex. E (4 × 10⁹) were preincubated with 20 μg/ml MoAb 1B4 or HB8592, then with complement containing 125I-BSA–anti-BSA.
Immune serological data
The serum IC levels decreased during plasmapheresis in both groups of patients (Figs 1 and 2). There was no statistical correlation between elevation of ICC binding capacity or the expression of ECR1 and reduction of the serum IC level in the same SLE patients. The anti-dsDNA titres also decreased during the procedure. One patient had elevated anti-dsDNA activity which was not influenced during the procedure and for one patient the serum C3 levels reduced during the first two plasmaphereses, but after that there was no significant decline.
DISCUSSION
Complement receptor type 1 takes part in the transport and processing of CICC [5]. Its main ligands are C3b, iC3b, C4b, iC4b [26,27]. The clinical manifestation of the disease—the activity, the kidney involvement and the serological parameters—suggest that the deficiency of the detectable number of CR1 on E is acquired in the SLE population [8,9]. An important question with respect to these observations and the present study therefore relates to the mechanism(s) by which ICC binding activity of ECR1 can be improved by plasmapheresis.
Our results showed significantly impaired in vitro ICC-binding capacity of CR1 expressed on SLE E. In our experiments this functional activity after plasmapheresis was highly improved in parallel with the decrease of circulating IC. This led us to speculate that this improvement of CR1 function was probably due to mechanical removal of serum ICC by plasmapheresis, decreasing the number of bound ICC in vivo to ECR1. This idea may be supported by the recognition that a negative correlation could be demonstrated between CR1/E and fixed C3dg/E in patients with immune complex diseases [8]. However, there was no statistical correlation between elevation of ICC binding capacity and reduction of serum IC level in the same SLE patients, so more than one explanation may be supposed for elevation of ECR1 functional activity. To examine this question further, we used two different MoAbs: 1B4, which can block the ICC binding to CR1, and HB8592, which does not block binding [28]. After the plasmapheresis the ECR1 number detected with 1B4 was elevated. This finding supports our hypothesis, i.e. that the plasmapheresis increased the number of free ligand binding sites on ECR1. The initial rapid increase in ICC binding activity and ECR1 levels detectable with MoAb 1B4 probably represents the unmasking of the ligand binding site of ECR1, as it is known that the same site on ECR1 is responsible for both ICC binding and binding of MoAb 1B4.
However, the number of epitopes of ECR1 detected by MoAb HB8592 was also elevated due to plasmapheresis, but it took a longer period of time until this epitope increased, and in addition the net increase detected with this MoAb was less than that observed when MoAb 1B4 was used to measure ECR1. Studies in several model systems have demonstrated that clearance and processing of immune complexes bound to ECR1 is associated with a long-term decrease in the levels of ECR1, and it is likely that this clearance reaction is facilitated by proteolysis of ECR1 [6,8,29,30]. Therefore, we suggest that the delayed increase in ECR1 epitopes recognized by MoAb HB8592 represents the time required for newly synthesized E to have a net effect on ECR1 levels in the circulation of the SLE patients. As MoAb HB8592 binds to a site which is not blocked by ICC, one would not expect to observe a significant increase in the epitope detected by this MoAb after simple dissociation and/or removal of CICC, and this was indeed the case (see ‘2/24’, Fig. 4b). Moreover, the regeneration of epitopes detectable by MoAb HB8592 requires 5–6 days, and this time would be consistent with the time needed for a sufficient number of newly synthesized E to affect the net ECR1 levels. During the time course of these experiments the CICC levels after plasmapheresis remain low (Figs 1 and 2), and therefore ECR1 values on the newly synthesized E, or on the older E, would not be further affected by CICC.
In conclusion, the present studies support the use of plasmapheresis in patients with SLE. The procedure leads to reduction of the amount of autoantibodies and the level of circulating immune complexes, and the expression and functional activity of ECR1 is also elevated. The ‘unloading’ IC from ECR1 together with production of new E from bone marrow may facilitate the in vivo handling and clearance of soluble CICC from circulation. The exact mechanism of these events remains to be determined, and additional experiments will be required to delineate this mechanism further.
Acknowledgments
We are grateful to Mrs Ibolya Szöllösi and Mrs Katalin György for their expert technical assistance and to Miss Katalin Hodosi for drafting of the manuscript. This work was supported by the National Foundation for Research (No 16763). R.P.T. was supported by NIH grant AR 43307.
REFERENCES
- 1.Iida K, Mornaghi R, Nussenzweig V. Complement receptor (CR1) deficiency in erythrocytes from patients with systemic lupus erythematosus. J Exp Med. 1982;155:1427–38. doi: 10.1084/jem.155.5.1427. [DOI] [PMC free article] [PubMed] [Google Scholar]
- 2.Schifferli JA, Ng YC, Paccaud JP, Walport MJ. The role of hypocomplementaemia and low erythrocyte complement receptor 1 numbers in determining abnormal immune complex clearance in humans. Clin Exp Immunol. 1989;75:329–35. [PMC free article] [PubMed] [Google Scholar]
- 3.Nielsen CH, Möller-Rasmussen J, Voss A, Junker P, Leslie RGQ. Diminished ability of erythrocytes from patients with systemic lupus erythematosus to limit opsonized immune complex deposition on leukocytes and activation of granulocytes. Arthritis Rheum. 1998;41:613–22. doi: 10.1002/1529-0131(199804)41:4<613::AID-ART8>3.0.CO;2-A. [DOI] [PubMed] [Google Scholar]
- 4.Medof ME, Nussenzweig V. Control of the function of substrate-bound C4b-C3b by the complement receptor (CR1) J Exp Med. 1984;159:1669–85. doi: 10.1084/jem.159.6.1669. [DOI] [PMC free article] [PubMed] [Google Scholar]
- 5.Edberg JC, Kimberly RP, Taylor RP. Functional characterization of non-human primate erythrocyte immune adherence receptors: implications for the uptake of immune complexes by the cells of the mononuclear phagocytic system. Eur J Immunol. 1992;22:1333–9. doi: 10.1002/eji.1830220602. [DOI] [PubMed] [Google Scholar]
- 6.Taylor RP, Polly JF, Martin EN, Cooke J, Greene KL, Grinspun K, Guttman M, Kuhn S. Immune complex bound to the primate erythrocyte complement receptor (CR1) via anti-CR1 Mabs are cleared simultaneously with loss of CR1 in a concerted reaction in a rhesus monkey model. Clin Immunol Immunopathol. 1997;82:49–59. doi: 10.1006/clin.1996.4286. [DOI] [PubMed] [Google Scholar]
- 7.Kuhn SE, Nardin A, Klebba PE, Taylor RP. Escherichia coli bound to the primate erythrocyte complement receptor via bispecific monoclonal antibodies are transferred to and phagocytosed by human monocytes in an in vitro model. J Immunol. 1998;160:5088–97. [PubMed] [Google Scholar]
- 8.Ross GD, Yount WJ, Walport MJ, et al. Disease-associated loss of erythrocyte complement receptors (CR1, C3b receptors) in patients with systemic lupus erythematosus and other diseases involving autoantibodies and/or complement activation. J Immunol. 1985;135:2005–14. [PubMed] [Google Scholar]
- 9.Kiss E, Csípö I, Cohen JHM, Reveil B, Kávai M, Szegedi Gy. CR1 density polymorphism and expression on erythrocytes of patients with systemic lupus erythematosus. Autoimmunity. 1996;25:53–58. doi: 10.3109/08916939608994726. [DOI] [PubMed] [Google Scholar]
- 10.Kiss E, Kávai M, Csípö I, Szegedi Gy. Recombinant human erythropoietin modulates erythrocyte complement receptor 1 functional activity in patients with lupus nephritis. Clin Nephrol. 1997;49:364–9. [PubMed] [Google Scholar]
- 11.Jones JV, Cumming RH, Bucknall RC. Plasmapheresis in the management of acute systemic lupus erythematosus. Lancet. 1976;1:709–71. doi: 10.1016/s0140-6736(76)93088-9. [DOI] [PubMed] [Google Scholar]
- 12.Dau PC, Callahan J, Parker R, Golbus J. Immunologic effects of plasmapheresis synchronized with pulse cyclophosphamide in systemic lupus erythematosus. J Rheumatol. 1991;18:270–6. [PubMed] [Google Scholar]
- 13.Jones JV, Robinson MF, Parcinay RK, Layter LF, McLeod B. Therapeutic plasmapheresis in systemic lupus erythematosus: effect on immune complex and antibodies to DNA. Arthritis Rheum. 1981;24:1113–20. doi: 10.1002/art.1780240901. [DOI] [PubMed] [Google Scholar]
- 14.Hebert LA, Birmingham DJ, Shen XP, Cosio FG. Stimulating erythropoiesis increases complement receptor expression on primate erythrocytes. Clin Immunol Immunopathol. 1992;62:301–6. doi: 10.1016/0090-1229(92)90107-y. [DOI] [PubMed] [Google Scholar]
- 15.Cohen JHM, Lutz HU, Pennaforte JL, Bouchard A, Kazatchkine MD. Peripheral catabolism of CR1 (the C3b receptor, CD35) on erythrocytes from healthy individuals and patients with systemic lupus erythematosus (SLE) Clin Exp Immunol. 1992;87:422–8. doi: 10.1111/j.1365-2249.1992.tb03013.x. [DOI] [PMC free article] [PubMed] [Google Scholar]
- 16.Tan EM, Cohen AS, Fries JF, et al. The 1982 revised criteria for classification of systemic lupus erythematosus. Arthritis Rheum. 1982;25:1271–7. doi: 10.1002/art.1780251101. [DOI] [PubMed] [Google Scholar]
- 17.Bambardier C, Gladman DD, Urowitz MB, et al. Derivation of SLE DAI. A disease activity index for lupus patients. Arthritis Rheum. 1992;35:630–40. doi: 10.1002/art.1780350606. [DOI] [PubMed] [Google Scholar]
- 18.Csípö I, Kávai M, Kiss E, Bedö Z, Csongor J, Szegedi Gy, Philbert F, Cohen JHM. Serum complement activation of SLE patients during plasmapheresis. Autoimmunity. 1997;25:139–46. doi: 10.3109/08916939709008020. [DOI] [PubMed] [Google Scholar]
- 19.Kávai M, Bányai A, Zsindely A, Sonkoly I, Szegedi Gy. An enzyme-linked immunosorbent assay for antibodies to native DNA in sera of patients with systemic lupus erythematosus. J Immunol Methods. 1982;48:169–75. doi: 10.1016/0022-1759(82)90191-0. [DOI] [PubMed] [Google Scholar]
- 20.Füst Gy, Kávai M, Szegedi Gy, et al. Evaluation of different methods for detecting circulating immune complexes. An interlaboratory study. J Immunol Methods. 1980;38:281–9. doi: 10.1016/0022-1759(80)90276-8. [DOI] [PubMed] [Google Scholar]
- 21.Kávai M, Möller-Rasmussen J, Baatrup G, Zsindely A, Svehag SE. Inefficient binding of IgM immune complex to erythrocyte C3b-C4b receptors (CR1) and weak incorporation of C3b-iC3b into the complex. Scand J Immunol. 1988;28:123–8. doi: 10.1111/j.1365-3083.1988.tb02423.x. [DOI] [PubMed] [Google Scholar]
- 22.Fraker PJ, Speck JC. Protein and cell membrane iodinations with a sparingly soluble chloramide, 1,3,4,6-tetrachloro-3a, 6a-diphenylglycoluril. Biochem Biophys Res Commun. 1978;80:849–57. doi: 10.1016/0006-291x(78)91322-0. [DOI] [PubMed] [Google Scholar]
- 23.O'Shea JJ, Brown EJ, Seligmann BE, Metcalf JA, Frank MM, Gallin JJ. Evidence for distinct intracellular pools of receptors for C3b and C3bi in human neutrophils. J Immunol. 1985;134:2580–7. [PubMed] [Google Scholar]
- 24.Tausk FA, McCuthchen A, Spechko P, Schreiber RD, Gigli I. Altered erythrocyte C3b receptor expression, immune complexes, and complement activation in homosexual men in varying risk groups for acquired immune deficiency syndrome. J Clin Invest. 1986;78:977–82. doi: 10.1172/JCI112688. [DOI] [PMC free article] [PubMed] [Google Scholar]
- 25.Antal-Szalmás P, van Strijp JAG, Weersink AJL, Verhoef J, van Kessel KPM. Quantitation of surface CD14 on human monocytes and neutrophils. J Leuk Biol. 1997;61:721–8. doi: 10.1002/jlb.61.6.721. [DOI] [PubMed] [Google Scholar]
- 26.Ross GD, Medof ME. Membrane complement receptors specific for bound fragments of C3. Adv Immunol. 1985;37:217–67. doi: 10.1016/s0065-2776(08)60341-7. [DOI] [PubMed] [Google Scholar]
- 27.Petersen I, Baatrup G, Jepsen HH, Svehag SE. Complement-mediated solubilization of immune complexes and their interaction with complement C3 receptors. Complement. 1985;2:97–110. doi: 10.1159/000467850. [DOI] [PubMed] [Google Scholar]
- 28.Edberg JC, Wright E, Taylor RP. Quantitative analyses of the binding of soluble complement-fixing antibody/dsDNA immune complexes to CR1 on human red blood cells. J Immunol. 1987;139:3739–47. [PubMed] [Google Scholar]
- 29.Davies KA, Hird V, Stewart S, Sivolapenko GB, Jose P, Epenetos AA, Walport MJ. A study of in vivo immune complex formation and clearance in man. J Immunol. 1990;144:4613–20. [PubMed] [Google Scholar]
- 30.Currie MS, Vala M, Pisetsky DS, Greenberg CS, Crawford J, Cohen HJ. Correlation between erythrocyte CR1 reduction and other blood proteinase markers in patients with malignant and inflammatory disorders. Blood. 1990;75:1699–704. [PubMed] [Google Scholar]


