

Abstract
PKDL develops in about 50% of Sudanese patients treated for visceral leishmaniasis (kala-azar). Patients with kala-azar were entered into this study and followed for a period of up to 2 years. During follow up 12 patients developed PKDL and eight did not. Proliferative responses and cytokine production to Leishmania donovani and control antigens were measured in vitro using PBMC isolated at the time of diagnosis of kala-azar, after treatment of visceral leishmaniasis, during follow up, and at the time of diagnosis of PKDL. Proliferative responses and interferon-gamma (IFN-γ) production were low at diagnosis and increased after treatment of kala-azar in both patients who developed (group 1) and those who did not develop PKDL later (group 2). In group 1, development of PKDL was always associated by an increased PBMC response to Leishmania antigen in proliferation and IFN-γ production assays. There were no differences in Leishmania antigen-induced production of IL-4, IL-5 and IL-10 between or within the two groups. We have previously shown that Leishmania parasites spread to the skin during visceral leishmaniasis and proposed that PKDL was the result of an immunological attack on parasites, which have survived in the skin despite the drug treatment. The finding that PKDL develops after treatment of kala-azar as Leishmania-reactive T cells start to circulate in peripheral blood in sufficient numbers to be detected in in vitro assays supports this hypothesis.
Keywords: PKDL, kala-azar, IFN-γ, immune reactivity
INTRODUCTION
The leishmaniases are protozoan diseases characterized by diverse clinical manifestations depending on the host’s cell-mediated immune response. Visceral leishmaniasis (kala-azar) caused by Leishmania donovani is characterized by a depressed cellular immune response and failure of PBMC to proliferate in response to Leishmania antigens [1,2], possibly as a result of overproduction of IL-10 [3]. After treatment the ability to react is restored and Leishmania antigens induce proliferation and interferon-gamma (IFN-γ) production in the PBMC of most individuals cured of kala-azar [4,5]. About half of the Sudanese kala-azar patients develop PKDL, usually within months after apparently successful treatment of kala-azar [6]. The condition is characterized by the appearance of macules, papules or nodules in the skin mainly of the face, extremities and trunk. In contrast to the situation in kala-azar patients, lymphocytes from the majority of PKDL patients proliferate and produce IFN-γ in response to Leishmania antigens [7]. However, it was previously unclear whether PKDL development was associated with an increased T cell response to the parasites, which might cause inflammation, or alternatively to immune suppression, which could allow the parasite to multiply in the skin. In this longitudinal study we measured cellular responses and cytokine production to Leishmania antigens during kala‐azar treatment and at diagnosis of PKDL. We report that PKDL development is associated with the acquisition of Leishmania reactivity by PBMC in proliferation and IFN‐γ production assays.
PATIENTS AND METHODS
Patients
Sixty-four patients with visceral leishmaniasis (VL) were recruited from villages in Gedaref State, Sudan, and from hospitals in Khartoum, Sudan, as part of a longitudinal study. A clinical history was obtained and a clinical examination was conducted. The diagnosis of VL was confirmed by the demonstration of Leishmania parasites in Giemsa-stained aspirates of lymph nodes or bone marrow. Patients were treated with sodium stibogluconate (Pentostam; Wellcome Laboratories, London, UK) at a dose of 10 mg/kg per day and 20 mg/kg per day for 30 days for adults and children, respectively. After treatment the tissue in which the parasites were first demonstrated was re-examined (as a test of cure), and found to be free of parasites. Venous blood samples were collected at the end of treatment, and thereafter at between 3·5- and 7-month intervals. Of the 64 patients enrolled 29 could be followed for a period ranging from 6 to 24 months. Considering the availability of blood samples 20 of these patients were included in this study. The 20 individuals in the present study did not differ from the 64 originally entered into the study with respect to age and sex. During follow up, 12 of the 20 individuals included in this study developed PKDL (group 1), whereas the remaining eight did not (group 2) The high PKDL development rate was not unexpected, since data from village-based studies indicate that about 50% of Sudanese kala-azar patients develop PKDL [6]. The diagnosis of PKDL was made clinically [8]. The characteristics of the patients at diagnosis of kala-azar are shown in Table 1. In agreement with previous studies showing that PKDL is more common among children than adults [6], patients in group 1 were younger than group 2 patients. Since most PKDL lesions heal spontaneously [9], it was decided not to treat patients who had PKDL for less than 6 months. All the patients healed spontaneously during this period. The study received ethical clearance from the Ethical Committee of the Institute of Endemic Diseases, University of Khartoum. Patients were enrolled in the study after informed consent had been obtained from the patient or in the case of children from their guardians.
Table 1.
Characteristics of the kala-azar patients who later developed PKDL (group 1) and of those who did not develop PKDL (group 2)
| Group 1 (n = 12) | Group 2 (n = 8) | P* | |
|---|---|---|---|
| Age, years (mean ± s.d) | 18·1 ± 7·8 | 31·4 ± 13·6 | 0·012(t) |
| Sex (F/M) | 4/8 | 1/7 | 0·603(F) |
| Haemoglobin(g/dl) at admission (mean ± s.d) | 7·4 ± 1·4 | 6·8 ± 2·4 | 0·49(t) |
| Leucocyte count (× 106/ml) at admission (median and 95% CI) | 2·6 (1·8, 3·2) | 3·0 (1·6, 3·7) | 0·79(Wx) |
| Spleen size (cm) at admission (mean ± s.d.) | 8·7 ± 5·8 | 7 ± 6·8 | 0·56(t) |
P values were calculated using Student's t-test (t), Mann-Whitney test (Wx) or Fisher's exact test (F), respectively.
Isolation of PBMC
Blood (20 ml) was collected by venepuncture into heparinized vacutainers (Becton Dickinson, Rutherford, NJ). PBMC were isolated by Lymphoprep (Nyegaard, Oslo, Norway) density centrifugation and frozen using a controlled gradient freezing device as previously described [10]. The cells were stored and transported in liquid nitrogen. Before use the cells were rapidly thawed and washed. Viability of the cells was determined by trypan blue staining and cell viability was always > 90%. PBMC isolated from one donor at different time points were thawed and tested in parallel.
Antigens
Leishmania donovani promastigotes (strain MHOM/SD/93/BMI) isolated from a Sudanese VL patient were harvested during their stationary phase of growth and frozen. The parasites were thawed, sonicated, and centrifuged as described previously [11]. The soluble protein (LDS) in the supernatant was used at a final protein concentration of 25 μ g/ml for stimulation of PBMC. Soluble antigens from axenic amastigotes (LDA) of L. donovani were prepared similarly by sonication and centrifugation [11]. The soluble amastigote antigens were used at a final protein concentration of 8 μ g/ml. Purified protein derivative of tuberculin (PPD) and tetanus toxoid (TT) were purchased from Statens Serum Institute (Copenhagen, Denmark) and used at final concentrations of 12 μ g/ml and 3 μ g/ml, respectively.
Proliferation assay and in vitro production of cytokines
PBMC were cultured in RPMI 1640 with HEPES 10 mm, l-glutamine 58·4 μ g/ml, penicillin 20 U/ml, and streptomycin 20 μ g/ml (all from Gibco, Paisley, UK) supplemented with 15% heat-inactivated pooled normal human serum (NHS). Experiments were done in 96-well round-bottomed microtitre plates (Nunc, Roskilde, Denmark). PBMC (150 μ l; 0·66 × 106 cells/ml) and 20 μ l of antigen were added to each well. Cultures were incubated at 37°C in a humidified atmosphere containing 5% CO2 for 7 days. Antigen-stimulated cultures were labelled on day 6 with 20 μ l/well of 3H-thymidine (New England Nuclear, Boston, MA) (1·85 mBq/well). On day 7 the culture supernatant was stored at −20°C for later determination of IFN-γ and IL-10 and cells were harvested onto glassfibre filters. The incorporation of 3H-thymidine into DNA was determined by a matrix β-counter.
The proliferation assays were done in triplicate. The median kilo counts per minute (kct/min) were recorded for each set of samples. The proliferative responses to an antigen were expressed as the increment in kct/min (kct/min stimulated cultures – kct/min unstimulated cultures). A proliferative response was considered measurable when the stimulation index (SI), (ct/min in stimulated culture)/(ct/min in unstimulated culture) was > 2 and the increment > 0·3 kct/min.
For measurement of IL-4 and IL-5 release by antigen-stimulated cultures of PBMC, parallel cultures were cultured for 6 days, then pulsed with 1 µm of ionomycin and 50 ng/ml of phorbol myristate acetate (PMA) (both from Sigma, St Louis, MO) for 24 h before the culture supernatants from triplicate wells were harvested [12].
Detection of cytokines
IFN-γ was measured by a double-sandwich ELISA. A specific rabbit polyclonal IgG to human recombinant IFN-γ and the biotin-avidin system were used as described before [11]. Sensitivity was 0·13 ng/ml. IL-10 was measured by Quantigen ELISA kit obtained from PharMingen (San Diego, CA). Sensitivity was 7·8 pg/ml. IL-5 was measured using Cytosets ELISA kits from BioSource Int. (Camarillo, CA). Sensitivity was 12 pg/ml. IL-4 was measured by ELISA as described before [12]. The sensitivity was 30 pg/ml. Cytokine production to an antigen was expressed as the increment (pg/ml stimulated – pg/ml unstimulated).
Statistical analysis
Data were evaluated using Sigmastat 5.0 (Jandel Scientific, San Rafael, CA). Differences of sample means were evaluated by Students’t-test and the data presented as mean and s.d. If the data were not suited to parametric testing, differences of sample medians were tested by Wilcoxon–Mann–Whitney test, and data presented as median and 95% confidence interval (95% CI). P < 0·05 was considered significant.
RESULTS
Clinical characteristics
Of the 64 kala-azar patients recruited for the study, we were able to follow 29 clinically for a period of 6–24 months. From 20 of these PBMC samples were available. The patients could be divided into 12 who developed PKDL (group 1), and eight who did not develop PKDL (group 2) during the follow-up period. PKDL occurred 30–210 days after initiation of treatment for VL. PKDL lesions healed without treatment in all patients within a period of 30–180 days. Table 1 shows clinical and paraclinical characteristics of the two groups of patients before treatment of VL (Table 1). All patients responded well to treatment. Lymphadenopathy was compared between the groups, before and after treatment (Table 2). A higher proportion in group 2 had lymphadenopathy on admission, but the difference between the groups was not statistically significant. However, after treatment of VL (day 30) enlarged but unparasitized lymph nodes (as judged by microscopy of lymph node aspirates) were found in all the eight patients of group 2, but only in three of nine patients of group 1 (P = 0·009). Lymphadenopathy was found in six of the group 1 patients, when they developed PKDL. In group 2, the prevalence of lymphadenopathy decreased after day 30 (P = 0·003).
Table 2.
Lymphadenopathy at diagnosis of kala-azar (day 0), after completion of kala-azar treatment (day 30), at diagnosis of PKDL in patients who developed PKDL (group 1), and at days 0, 30 and 105–180 after diagnosis of kala-azar in patients who did not develop PKDL (group 2)
| Group 1 | Group 2 | |||||
|---|---|---|---|---|---|---|
| Antigens | Day 0 | Day 30† | Day 30–210‡ | Day 0 | Day 30 | Day 105–180 |
| Spontaneous | 6/4 | 3/6 | 6/2 | 8/0 | 8/0* | 2/6 |
Day 30 in group 1 patients who had not yet developed PKDL.
At diagnosis of PKDL.
A statistically significantly higher fraction than in group 1, day 30 (P = 0·009) and group 2, day 105-180 (P = 0·003).
Lymphocyte proliferation
PBMC isolated before treatment of VL (day 0), after completion of VL treatment (day 30) and during the follow-up period were analysed (days 105–210 for group 1 and days 105–180 for group 2). Figure 1 shows Leishmania antigen-induced proliferation of PBMC from the two groups of patients. In both groups responses were low at day 0 and increased during follow up. In group 1 development of PKDL was always associated with an increased responsiveness, and the response measured in samples from the point in time PKDL was diagnosed was significantly higher than in the sample collected before PKDL development (P = 0·02 for both LDA and LDS). At day 30, three of the group 1 patients had developed PKDL and their LDA-induced PBMC responses were significantly higher than the responses in group 1 patients who developed PKDL later (P = 0·02). At none of the time points could differences in responsiveness be detected between the group 1 and group 2 patients.
Fig. 1.
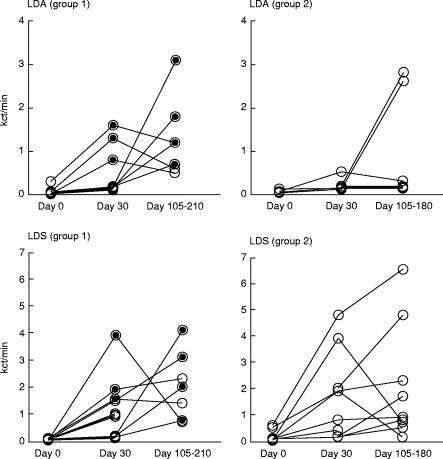
Leishmania antigen (LDA and LDS)-induced proliferation (kct/min) of PBMC obtained from patients who developed PKDL (group 1, left panels) and patients who did not develop PKDL (group 2, right panels). The PBMC were isolated at diagnosis of visceral leishmaniasis (VL) (day 0), after treatment of VL (day 30) and during the follow up, after 105–210 days after initiation of treatment for VL. The period in time during which patients in group 1 suffered from PKDL is indicated by filled circles. The responses of each patient are connected by lines.
PBMC from most patients responded by proliferation to PPD and the responses tended to increase after day 0, but there were no significant differences in the magnitude of the responses between the groups (data not shown). The responses to TT were generally low and only five of the 20 patients responded to this antigen (data not shown).
IFN-γ production
Figure 2 shows Leishmania antigen-induced IFN-γ production in PBMC cultures from the two groups of patients. In both groups the LDA-induced IFN-γ response was low or absent at day 0 and increased after treatment. The same pattern was seen in the cultures stimulated with LDS, although two patients from each group had a fairly high production of IFN-γ at day 0.
Fig. 2.
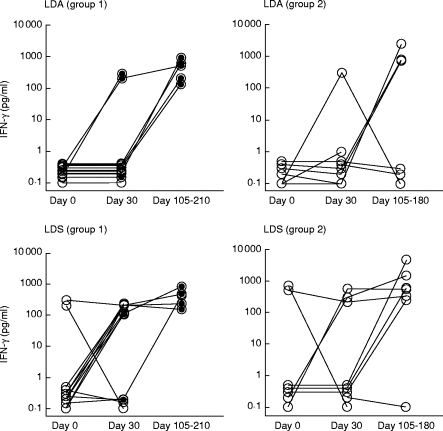
Leishmania antigen-induced IFN-γ production (pg/ml) in PBMC cultures from patients before and after treatment of kala-azar. For explanation see legend to Fig. 1.
Within group 1, development of PKDL was associated with an increased production of IFN-γ, and this increase was statistically significant after stimulation by LDS (P = 0·02). As for the result obtained by the proliferation assay, no differences were found when comparing group 1 and group 2 patients. No statistically significant differences in PPD- or TT-induced IFN-γ production could be detected within or between the groups (data not shown).
IL-10, IL-5 and IL-4 production
Table 3 shows the spontaneous and antigen-induced IL-10 in PBMC from the two groups of patients. The spontaneous production of IL-10 at day 30 in group 1 was higher than in group 2, but the difference did not reach significance. IL-10 production was down-regulated in Leishmania antigen-stimulated cultures in both groups, and down-regulation was significant in group 1 at day 30 (P = 0·004 and P = 0·02 for LDS and LDA, respectively).
Table 3.
Spontaneous and antigen-induced IL-10 production (median pg/ml (95% confidence interval)) from PBMC of patients treated for kala-azar (groups 1 and 2 at day 30; group 1 at days 105–210; group 2 at days 105–180); group 1 patients developed PKDL and group 2 patients did not develop PKDL
| Group 1 | Group 2 | |||
|---|---|---|---|---|
| Antigens† | Day 30‡ | Day 105–210 | Day 30 | Day 105–180 |
| Spontaneous | 63·0 (37·9, 120·5) | 0·0 (0·0, 122·4) | 9·8 (0·0, 119·5) | 0·0 (0·0, 89·3) |
| LDS | 0·0 (0·0, 0·0)* | 0·0 (0·0, 0·0) | 0·0 (0·0, 0·0) | 0·0 (0·0, 50·8) |
| LDA | 0·0 (0·0, 0·2)* | 0·0 (0·0, 0·0) | 0·0 (0·0, 0·0) | 0·0 (0·0, 0·0) |
| PPD | 76·5 (2·8, 126·8) | 40·8 (30·2, 231·6) | 47·6 (17·7, 69·3) | 94·8 (2·1, 140·0) |
| TT | 19·3 (0·0, 60·4) | 14 (0·0, 66·3) | 0·0 (0·0, 13·8) | 0·0 (0·0, 6·5) |
Antigens: LDS, Leishmania donovani promastigote supernatant; LDA, L. donovani amastigote; TT, tetanus toxoid.
Days after diagnosis of kala azar.
A Statistically significantly higher IL-10 production than the spontaneous production (P < 0·02).
The production of IL-5 in PBMC is shown in Table 4. PPD-stimulated IL-5 production was statistically significantly higher in group 1 compared with group 2 (P = 0·005, 0·03, and 0·02 for days 0, 30, and 105–180, respectively). TT-stimulated IL-5 production was significantly higher in group 1 than in group 2 at days 105–180 (P = 0·05). Antigenic stimulation did not increase the levels of IL-4 in culture supernatants. In fact, the presence of both Leishmania antigens (LDA and LDS) as well as PPD and TT in the cultures caused a statistically significant reduction of IL-4 levels (data not shown). However, there were no statistically significant differences between spontaneous IL-4 production or levels of IL-4 in antigen-stimulated cultures between or within groups 1 and 2.
Table 4.
Spontaneous and antigen-induced IL-5 production (median pg/ml (95% confidence interval)) from PBMC of patients before treatment (day 0) and after treatment of kala-azar; group 1 patients developed PKDL and group 2 patients did not develop PKDL
| Group 1 | Group 2 | |||||
|---|---|---|---|---|---|---|
| Antigens | Day 0 | Day 30 | Day 105–210 | Day 0 | Day 30 | Day 105–180 |
| Spontaneous | 44·3 (2·3, 95·9) | 276·7 (88·5, 487·0) | 171·0 (131, 329·0) | 63·4 (35·4, 308·4) | 119·6 (71, 140·9) | 207·7 (119, 590·5) |
| LDS | 0·0 (0·0, 76·2) | 0·0 (0·0, 0·0)* | 0·0 (0·0, 66·4)* | 0·0 (0·0, 0·0)* | 0·0 (0·0, 0·0)* | 0·0 (0·0, 3·9)* |
| LDA | 6·3 (0·0, 18·6) | 0·0 (0·0, 9·8)* | 0·0 (0·0, 0·0)* | 0·0 (0·0, 0·0)* | 0·0 (0·0, 34·6)* | 0·5 (0·0, 40·8)* |
| PPD | 93·2 (12·0, 335·0)** | 376·7 (183, 580·0)** | 406·6 (211, 900·0)** | 0·0 (0·0, 3·9) | 28·6 (0·0, 165·5) | 82·7 (42·1, 208·8) |
| TT | 9·0 (0·0, 72·3) | 0·0 (0·0, 602·1) | 757·6 (226, 864·4)** | 0·0 (0·0, 3·9) | 4·8 (0·0, 102·3) | 1·5 (0·0, 33·5) |
For antigens and days, refer to Table 3.
Statistically significantly lower IL-5 production than spontaneous production (P < 0·05).
Statistically significantly higher IL-5 production than in group 2 patients (P < 0·05).
DISCUSSION
Post-kala-azar dermal leishmaniasis develops in 50% of Sudanese kala-azar patients treated for VL [9]. We have previously shown that subsequent PKDL development can be predicted by IL-10 production by keratinocytes and high levels of IL-10 in plasma and PBMC cultures before treatment of kala-azar is initiated [13]. Thus the processes governing whether PKDL develops or not take place during the systemic phase of the infection. The spread of parasites to the skin is apparently not the determining factor, since parasites are found in unaffected skin in both the kala-azar patients who subsequently develop PKDL and those who do not [13]. To monitor immunological reactivity between kala-azar diagnosis and PKDL development, we followed the systemic immune responses of kala-azar patients longitudinally from when they were diagnosed up until 6 months after kala-azar diagnosis. The most striking results were found when looking at the acquisition of Leishmania-specific immunological reactivity among the patients who developed PKDL (group 1). In all these patients the PBMC reactivity to Leishmania antigens was higher in the samples collected at diagnosis of PKDL than in the samples collected prior to PKDL development. Furthermore, at day 30 after kala-azar diagnosis, at a point in time when some group 1 patients had developed PKDL and some had not, the Leishmania antigen-specific responses were statistically significantly higher in those who had developed PKDL than in those who had not. Together these results strongly suggest that there is an association between the occurrence of the skin rash and the appearance in peripheral blood of Leishmania-specific lymphocyte reactivity by proliferation and IFN-γ production to antigenic stimulation in vitro. At no point in time could marked differences be detected in proliferative response or IFN-γ production to Leishmania antigen between the group who developed PKDL and those who did not. This indicates that the presence of a systemic Th1-type immune response was not sufficient to develop PKDL in group 2. In an attempt to measure Th2 immune responses we measured IL-4, IL-5 and IL-10 in PBMC supernatants. When comparing within group 1 longitudinally we could not detect any differences between production of these cytokines before and after PKDL development. We have previously reported that IL-10 production in the presence of Leishmania antigen at day 0 (diagnoses of VL) was higher in group 1 than in group 2 [13]. In this study we did not find differences in IL-10 production at later points in time.
The spontaneous production of IL-4, IL-5 and IL-10 was down-regulated in the presence of Leishmania antigens in almost all patients at all points in time, but to our surprise we found that IL-5 production in the presence of PPD was statistically significantly higher in group 1 than in group 2. The significance of this finding is unclear.
T cell response to Leishmania antigens are suppressed in patients with VL [1,3,4,14] and patients who recover from VL develop T cell reactivity to Leishmania which can be characterized as a mixed Th1/Th2 type of response [5]. This resembles the response seen in PKDL patients, since PBMC from most patients respond to Leishmania antigen by proliferation [2,7,8,15,16] and IFN-γ production [7], although in one study from India PBMC from PKDL patients were reported to be unresponsive to Leishmania[17]. Previously, we have characterized the local immune response in the affected areas of the skin in PKDL patients [7,8]. It is characterized by the presence of parasites or parasite antigen and an influx of inflammatory cells [7] of which many are T cells. In the lesion there is production of IFN-γ, IL-4 and IL-10 [7]. We show here that PKDL development in group 1 was associated with an increased systemic ability of PBMC to respond by proliferation and production of IFN-γ in response to Leishmania antigen. We have previously found that parasites spread to normal looking skin during kala-azar [13] and that PKDL lesions are characterized by an inflammatory infiltrate and the presence of parasite antigens [7]. Together, these findings indicate that PKDL development is a result of an immunological attack on parasites that spread to the skin during kala-azar, and survive there despite treatment. Why is PKDL not developed in the group 2 patients? We have previously shown that parasites are present in the skin of these patients during kala-azar, and we show here that the systemic immune response to Leishmania increases in these individuals, and resembles the responses in those who develop PKDL (group 1). Furthermore, all group 2 patients had lymphadenopathy after treatment of kala-azar, whereas most of the group 1 patients did not have lymphadenopathy at this point in time, but had it when PKDL was diagnosed. This could suggest that the immune system was more effective in killing parasites in group 2 than in group 1 patients, and that the lack of PKDL development in group 2 patients was due to the fact that the parasites in the skin were killed during drug treatment of kala-azar.
References
- 1.Carvallo EM, Teixeira RS, Johnoson WD. Cell mediated immunity in American visceral leishmaniasis; reversible immunosuppression during acute infection. Infect Immun. 1981;33:498–502. doi: 10.1128/iai.33.2.498-500.1981. [DOI] [PMC free article] [PubMed] [Google Scholar]
- 2.Halder JP, Ghose S, Saha KC, Ghose AC. Cell-mediated immune response in Indian Kala-azar and post kala-azar dermal leishmaniasis. Infect Immun. 1983;42:702. doi: 10.1128/iai.42.2.702-707.1983. [DOI] [PMC free article] [PubMed] [Google Scholar]
- 3.Ghalib HW, Piuvezam MR, Sheiky YAW, et al. Interleukin 10 production correlates with pathology in human Leishmania donovani infections. J Clin Invest. 1993;92:324–9. doi: 10.1172/JCI116570. [DOI] [PMC free article] [PubMed] [Google Scholar]
- 4.Carvalho EM, Badaro R, Reed SG, Jones TC, Johnson Wd., Jr Absence of gamma interferon and interleukin 2 production during active visceral leishmaniasis. J Clin Invest. 1985;76:2066–9. doi: 10.1172/JCI112209. [DOI] [PMC free article] [PubMed] [Google Scholar]
- 5.Kemp M, Kurtzhals JAL, Bendtzen K, et al. Leishmania donovani specific Th1 and Th2 like T-cell clones from individuals who have recovered from visceral leishmaniasis. Infect Immun. 1993;61:1069–73. doi: 10.1128/iai.61.3.1069-1073.1993. [DOI] [PMC free article] [PubMed] [Google Scholar]
- 6.Zijlstra EE, ElHassan AM, Ismail A, Ghalib HW. Endemic kala-azar in Eastern Sudan: a longitudinal study on the incidence of clinical and subclinical infection and post kala-azar dermal leishmaniasis. Am J Trop Med Hyg. 1994;51:826–36. doi: 10.4269/ajtmh.1994.51.826. [DOI] [PubMed] [Google Scholar]
- 7.Ismail A, El Hassan AM, Kemp K, et al. T cell phenotypes and cytokine profile. J Pathol. doi: 10.1002/(SICI)1096-9896(199912)189:4<615::AID-PATH466>3.0.CO;2-Z. in press. [DOI] [PubMed] [Google Scholar]
- 8.ElHassan AM, Ghalib HW, Zijlstra EE, et al. Post kala azar dermal leishmaniasis in the Sudan: clinical features, pathology and treatment. Trans Roy Soc Trop Med Hyg. 1992;86:245–8. doi: 10.1016/0035-9203(92)90294-m. [DOI] [PubMed] [Google Scholar]
- 9.Zijlstra EE, ElHassan AM, Ismail A. Endemic kala-azar in Eastern Sudan: post kala-azar dermal leishmaniasis. Am J Trop Med Hyg. 1995;52:299–305. doi: 10.4269/ajtmh.1995.52.299. [DOI] [PubMed] [Google Scholar]
- 10.Hviid L, Albeck G, Hansen B, Theander TG, Talbot A. A new portable device for automatic controlled-gradient cryopreservation of blood mononuclear cells. J Immunol Methods. 1993;157:135–42. doi: 10.1016/0022-1759(93)90079-m. [DOI] [PubMed] [Google Scholar]
- 11.Kemp M, Theander TG, Handman E, et al. Activation of human T lymphocytes by Leishmania lipophosphoglycan. Scand J Immunol. 1991;33:219–24. doi: 10.1111/j.1365-3083.1991.tb03752.x. [DOI] [PubMed] [Google Scholar]
- 12.Kurtzhals JAL, Hansen MB, Hey AS, Poulsen LK. Measurement of antigen-dependent interleukin-4 production by human peripheral blood mononuclear cells. Introduction of an amplification step using ionomycin and phorbol myristate acetate. J Immunol Methods. 1992;156:239–45. doi: 10.1016/0022-1759(92)90031-n. [DOI] [PubMed] [Google Scholar]
- 13.Gasim S, El Hassan AM, Khalil EAG, et al. High levels of plasma interleukin 10 (IL10) and expression of IL10 by keratinocytes during visceral leishmaniasis predict subsequent development of post kala-azar dermal leishmaniasis. Clin Exp Immunol. 1998;111:64–69. doi: 10.1046/j.1365-2249.1998.00468.x. [DOI] [PMC free article] [PubMed] [Google Scholar]
- 14.Ghalib HW, Whittle JA, Kubin M, et al. IL12 enhances Th 1-type responses in human Leishmania donovani infections. J Immunol. 1995;154:4623–9. [PubMed] [Google Scholar]
- 15.Ghose AC, Chowdhury AB. T-lymphocytes in kala azar and Post kala azar dermal leishmaniasis. Bull Calcutta School Trop Medicine. 1977;25:3–4. [Google Scholar]
- 16.Nandy A, Neogy AB, Ghosh Dastidar B, Sarkar M, Mallick KK, Chowdhury AB. Proceedings of the Indo-UK Workshop on Leishmaniasis. New Delhi: Indian Council of Medical Research; 1983. Immune response and drug response in kala-azar and Post kala-azar dermal leishmaniasis; pp. 161–70. [Google Scholar]
- 17.Neogy AB, Nandy A, Gosh Dastidar B, Chowdhury AB. Modulation of the cell-mediated immune response in kala-azar and post kala-azar dermal leishmaniasis in relation to chemotherapy. Annal Trop Med Parasit. 1988;82:27–34. doi: 10.1080/00034983.1988.11812205. [DOI] [PubMed] [Google Scholar]