

Abstract
Interferons play an important, but incompletely understood role in HIV-related disease. We investigated the effect of HAART on plasma levels of IFN-α, IFN-γ, neopterin and interferon-inducible protein 10 (IP-10) in 41 HIV-infected patients during 78 weeks of therapy. At baseline HIV-infected patients had raised levels of both IP-10 and IFN-α compared with healthy controls (n = 19), with particularly high levels in advanced disease. HAART induced a marked decrease in levels of both IFN-α, neopterin and IP-10, though not to normal concentrations. In contrast, IFN-γ levels were low throughout the study, and not different from controls. While neopterin and IP-10 remained significantly decreased compared with baseline levels throughout the study, IFN-α levels returned to baseline at the end of the study. Persistently high IP-10 and IFN-α levels were associated with immunological treatment failure and even high baseline levels of IFN-α appeared to predict immunological relapse. Furthermore, we found a markedly suppressive effect of exogenously added IFN-α on phytohaemagglutinin-stimulated lymphocyte proliferation in both patients and controls, and this suppressive effect seemed not to involve enhanced lymphocyte apoptosis. Our findings suggest a pathogenic role of IFN-α in HIV infection, which may be a potential target for immunomodulating therapy in combination with HAART.
Keywords: HIV infection, IFN-α, IFN-γ, neopterin, IP-10
INTRODUCTION
Interferons (IFN) are classified into two distinct superfamilies based on their biochemical structure, their cellular receptors and biological effects [1,2]. Type I IFNs, such as IFN-α, are mainly produced by monocytes/macrophages and are thought to be key participants in the anti-viral defence in humans [1–4]. Type II IFN or IFN-γ, which is only produced by activated T and natural killer (NK) cells, has a cellular receptor distinct from type I IFNs. Although IFN-γ is endowed with little direct anti-viral activity, this cytokine plays an important role in the recruitment and activation of cytotoxic T cells, NK cells and phagocytes directed against virus- or parasite-infected cells and tumour cells [1,2,5].
There are several studies supporting a role for IFNs in the pathogenesis of HIV infection [2,6–8]. IFN-γ production in T cells has been found to decline along with disease progression in HIV-infected patients, possibly reflecting a gradual impairment in the cellular immune response against intracellular microbes [9,10]. As for IFN-α, decreased stimulated production in peripheral blood mononuclear cells (PBMC) has been reported during HIV infection, with particularly low levels in advanced disease [6,11]. Furthermore, based on its ability to block different steps in HIV replication in vitro, IFN-α has been given for therapeutic purposes, both alone and in combination with other agents [12–14]. On the other hand, high rather than low levels of IFN-α have been found in sera of HIV-infected patients, and levels increase with disease progression [6,15,16]. Moreover, it has recently been suggested that IFN-α may impair production of chemokines with anti-viral effects in these patients [17]. Thus, the exact role of IFNs, and particularly IFN-α, in the pathogenesis of HIV infection is at present unclear.
Current standard therapy for HIV infection consists of HIV protease inhibitor-containing multidrug regimens. Although such HAART has been shown to have a profound down-regulatory effect on HIV replication with concomitant increases in CD4+ and CD8+ T cell counts in a considerable proportion of patients [18], full immunological normalization may not be achieved during such therapy [19]. Considering the important role of IFNs and related proteins in the anti-viral immune defence, we examined the effect of HAART on circulating levels of IFN-α, IFN-γ and neopterin, a surrogate marker thought to reflect IFN-γ activity. We also measured plasma levels of IFN-inducible protein 10 (IP-10), a CXC-chemokine with several immunomodulatory effects with potential relevance to HIV infection, such as granuloma formation and maintenance of a Th1-like immune response [20,21]. At present there is to our knowledge no information of IP-10 levels in HIV-infected individuals.
PATIENTS AND METHODS
Patients and controls
Forty-one HIV-infected patients (median age 38 years, range 15–57 years; 31 males and 10 females) were included in the study. Clinically, 22 subjects were classified as having asymptomatic HIV infection (CDC group A), six as having symptomatic non-AIDS HIV infection (CDC group B), and 13 as having AIDS (CDC group C) [22]. All patients received one protease inhibitor (indinavir, 800 mg tid, n = 19; ritonavir, 600 mg 2 bid, n = 7; saquinavir, 600 mg tid, n = 12; or nelfinavir 750 mg tid, n = 2) or one non-nucleoside analogue (nevirapine; 200 mg bid, n = 1) in combination with two nucleoside analogues (zidovudine 250 mg bid + lamivudine 150 mg bid, n = 30; stavudine 40 mg bid + lamivudine 150 mg bid, n = 9; or stavudine 40 mg bid + didanosine 400 mg qd, n = 2). Clinical, immunological and virologic characteristics of the study group at baseline are given in Table 1. Only blood samples taken in periods without any acute complication or exacerbation of chronic infection were included. Nineteen HIV−, healthy volunteer blood donors (median age 41 years, range 25–64 years; 14 males and five females) were used as controls.
Table 1.
Immunologic and virologic parameters in the study group
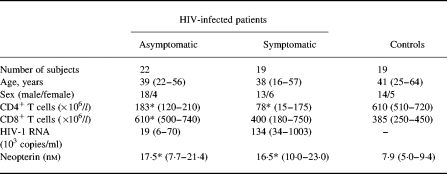
Data are given as medians and 25–75th percentiles except for age, which is given as median and ranges. Symptomatic HIV-infected patients: CDC group B, n < 6+CDC group C, n < 13.
*P < 0.001 versus controls.
Blood sampling protocol
Blood was drawn into pyrogen-free vacuum blood collection tubes without any additives (serum) or with EDTA as anticoagulant (plasma). Tubes were immediately immersed in melting ice, centrifuged within 15 min at 600 g for 10 min (plasma) or allowed to clot for 1 h before centrifugation at 1000 g for 10 min (serum). Both plasma and serum were stored at −80°C. Samples were thawed less than three times before assay, which appeared not to influence the measured cytokine levels [23]. Moreover, all samples assayed for any one cytokine/chemokine were treated in the same way, i.e. equal numbers of freeze–thaw cycles.
Isolation and stimulation of PBMC
PBMC were obtained from heparinized blood by Isopaque–Ficoll (Lymphoprep; Nycomed Pharma, Oslo, Norway) gradient centrifugation within 45 min as previously described [24]. Mononuclear cells were resuspended in RPMI 1640 (Gibco, Paisley, UK) with 2 mmol/ll-glutamine and 25 mmol/l HEPES buffer (Gibco) and 10% heat-inactivated pooled human AB+ serum, hereafter referred to as culture medium. Unstimulated or stimulated (phytohaemagglutinin (PHA); Murex Diagnostics Ltd, Dartford, UK; final concentration 1:100) PBMC (106 cells/ml; 0.2 ml/well) were incubated in flat-bottomed 96-well trays (Costar, Cambridge, MA) with or without different concentrations of recombinant human IP-10 (R&D Systems, Minneapolis, MN) or recombinant human IFN-α (Pepro Tech EC Ltd, London, UK). In some experiments neutralizing rabbit polyclonal anti-IFN-α antibody (final concentration 3000 U/ml; Biosource Int., Camarillo, CA) was also added to cell culture before stimulation. After 48 h of culture, 1 μCi of 3H-thymidine was added for 16 h before the cultures were harvested onto glass filter strips, using an automated multisample harvester (Skatron, Lier, Norway). 3H-thymidine incorporation was determined by liquid scintillation counting. In all preparations of medium, the endotoxin levels were < 10 pg/ml (limulus amoebocyte lysate test; Bio Whittaker, Walkersville, MD).
Detection of apoptosis in PBMC cultures
1. The TUNEL assay was carried out according to [25,26] with some modifications. PBMC (2 × 10⁶ cells/ml) were seeded in 24-well plates (Costar; 1 ml/well) in culture medium with PHA (final concentration 1:100) or with PHA + 104 pg/ml IFN-α for 48 h, washed once in PBS, preincubated in PBS with human IgG (Octagam; Octapharma, Vienna, Austria; 5 g/l), 5% mouse serum (Sigma, St Louis, MO), 2% bovine serum albumin (BSA; Calbiochem, La Jolla, CA) and 0.1% sodium azide (Sigma) for 15 min at room temperature. Cells were stained for 30 min at 4°C with anti-CD3 (clone SK7) PE or the isotype-matched PE conjugate (both from Becton Dickinson, San Jose, CA), washed twice in PBS, fixed in 4% paraformaldehyde (Sigma) for 30 min at room temperature, washed once in PBS and resuspended in permeabilization buffer (0.1% sodium citrate, 0.1% Triton X-100 (Sigma) in PBS) for 2 min at 4°C. Cells were then washed twice in PBS and incubated in 50 μl reaction mixture consisting of 10 nm biotin-16-dUTP (Boehringer Mannheim, Mannheim, Germany), 0.25 mg/ml BSA, 0.1 mm dithiothreitol (Sigma), 2 mm cobalt chloride (Sigma), 200 mm sodium cacodylate (Sigma), 25 mm Tris–HCl (Sigma) and 5 U terminal deoxynucleotidyl transferase (TdT; Boehringer Mannheim) for 30 min at 37°C. Control cells were incubated in the same mixture, but without TdT. After one wash in 0.1% Triton X-100 and 5% BSA in PBS (washing buffer), cells were incubated in FITC–streptavidin (1:50; Amersham Pharmacia Biotech AB, Uppsala, Sweden), 0.1% Triton X-100 and 3% non-fat dried milk (Sigma) in PBS for 30 min at 20°C. Cells were washed and analysed by flow cytometry (FACScan; Becton Dickinson) with CellQuest software (Becton Dickinson). List mode files were collected for 10 000 cells from each sample. The gate for apoptotic cells was set so that < 1% of cells were positive in the control samples (without TdT).
2. Apoptotic cells expressing negatively charged phospholipids were detected by staining with annexin V–FITC conjugate, whereas non-viable cells were stained by propidium iodide (TACS Annexin V-FITC Apoptosis Detection Kit; Genzyme Corp., Cambridge, MA) according to the manufacturer's instructions. Briefly, PBMC (2 × 10⁶ cells/ml) were seeded in 96-well plates (Costar; 0.2 ml/well) in culture medium with PHA (final concentration 1:100) or with PHA + 104 pg/ml IFN-α for 48 h, washed once in PBS and stained with annexin V–FITC and propidium iodide in binding buffer (Genzyme) for 15 min at room temperature and immediately analysed by flow cytometry as described above.
Quantification of IFN-α, IFN-γ and IP-10 by enzyme immunoassay
Plasma levels of IFN-α were quantified by enzyme immunoassay (EIA; detection limit 3 pg/ml; Biosource International). Plasma levels of IFN-γ were quantified by two different EIAs using microtitre wells coated with one (detection limit 3 pg/ml; R&D Systems) or several (detection limit 0.03 U/ml; Biosource) MoAbs against distinct epitopes of the IFN-γ molecule. For the IP-10 EIA, wells were coated overnight with monoclonal mouse anti-human IP-10 antibody (R&D Systems; clone 33036.211; 4 μg/ml in sterile PBS). Standard was recombinant IP-10 (R&D Systems; 16.6–1000 pg/ml). Subsequent steps included biotinylated polyclonal goat anti-human IP-10 (R&D Systems; 25 ng/ml), alkaline phosphatase-conjugated streptavidin (Zymed Labs, San Francisco, CA; 1:2000) and p-nitrophenyl disodium phosphate as substrate (Sigma; 1 mg/ml in diethanolamine buffer, pH 9.8). Detection limit for IP-10 EIA was 16.5 pg/ml. The intra- and interassay coefficients of variations were < 10% for all EIAs. All samples from a given patient were analysed in the same microtitre plate to minimize run-to-run variability.
Miscellaneous
Plasma neopterin levels were measured using radioimmunoassay (IMMUtest Neopterin; Henning Berlin GMBH, Berlin, Germany). CD4+ and CD8+ T cell counts were determined by immunomagnetic quantification [27]. Quantification of 125I-IFN-α-binding IgG was carried out by protein-G affinity chromatography, as described [28]. Plasma HIV RNA levels were measured by quantitative reverse polymerase chain reaction (detection limit 200 copies/ml; Amplicor Monitor; Roche Diagnostic Systems, Branchburg, NY).
Statistical analysis
When comparing two groups of individuals we used the two-tailed Mann–Whitney U-test. When comparing more than two groups, the Kruskal–Wallis test was used a priori. If a significant difference was found, the Mann–Whitney U-test was used to determine differences between each pair of groups. Coefficients of correlations were calculated by the Spearman rank test. Responses within the same individuals were compared by the (two-tailed) Wilcoxon signed rank test for paired data. Data are given as medians and 25–75th percentiles if not otherwise stated. P values were two-sided and considered significant when < 0.05.
RESULTS
Plasma levels of IFN-α, IP-10 and IFN-γ levels before initiating HAART
At baseline 31 patients received nucleoside analogues (combination of zidovudine and lamivudine, n = 28; zidovudine, n = 2; didanosine, n = 1). As shown in Table 2, HIV-infected patients had markedly elevated plasma levels of both IFN-α and IP-10 compared with healthy controls, and as for IP-10, the highest levels were found in those with symptomatic HIV infection (CDC group C and B). Furthermore, IP-10 levels showed a significant negative correlation with both CD4+ (r = −0.33, P < 0.04) and CD8+ (r = −0.32, P < 0.05) T cell counts in peripheral blood. IP-10 also showed a significant positive correlation with HIV RNA copy numbers in plasma (r = 0.39, P < 0.02). No such correlations were found for IFN-α (data not shown). In contrast to the high IFN-α and IP-10 levels, IFN-γ was detected only in six patients and was not different from concentrations in healthy controls as assessed by two different EIAs (data not shown).
Table 2.
Plasma levels of IFN-α and IP-10 before initiating HAART
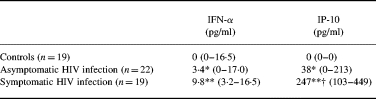
Data are given as medians and 25–75th percentiles. Symptomatic HIV-infected patients: CDC group B, n = 6 + CDC group C, n = 13.
†P < 0.05 versus asymptomatic HIV infection; *P < 0.05 and **P < 0.001 versus controls.
IFN-α, IP-10, IFN-γ and neopterin levels during HAART
Blood samples were taken at baseline (n = 41) and 8 (n = 38), 26 (n = 37), 52 (n = 38) and 78 (n = 28) weeks after initiating HAART. During therapy there was a significant increase in CD4+ T cell counts (maximum increase 137 (70–188) × 106/l, P < 0.001) and a pronounced fall in HIV RNA copy numbers in plasma (maximum decrease 4.49 (2.74–5.03)log10 copies/ml, P < 0.002). Also CD8+ T cell counts increased during HAART, but the rise was more modest than that for CD4+ T cells, reaching significance only at 78 weeks of therapy (P <0.002). Concomitant with the increase in T cell counts and decrease in viral load, HAART induced a significant decrease in plasma levels of both IFN-α, neopterin and IP-10 (Fig. 1). Interestingly, there was a highly significant correlation between IFN-α and IP-10 levels at all time points during the study period, but no such correlation was found between neopterin and IP-10 or IFN-α (data not shown). Naturally occurring neutralizing antibodies against IFN-α may influence both the measurement and the activity of this cytokine, but such antibodies were not detected either at baseline or after initiating HAART when analysing levels in 25 HIV-infected patients (data not shown). Although there was a marked decline in IFN-α, neopterin and IP-10 levels during HAART, there was no normalization of these parameters, and the levels were significantly elevated compared with healthy controls throughout the study period (Fig. 1). Furthermore, while neopterin and IP-10 levels were significantly decreased compared with baseline throughout the study, IFN-α levels tended to return to baseline at the end of the study (Fig. 1). In contrast to the pronounced decrease in IFN-α, neopterin and IP-10, the IFN-γ concentrations were low or undetectable throughout the study (data not shown).
Fig. 1.
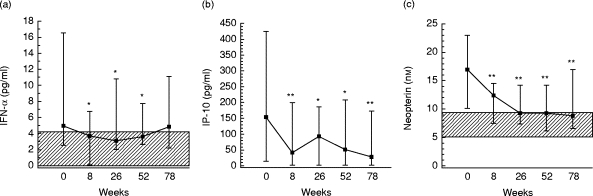
Plasma levels of IFN-α (a), IP-10 (b) and neopterin (c) after start of HAART. Forty-one HIV-infected patients were studied; blood samples were taken at 8 (n = 38), 26 (n = 37), 52 (n = 38), and 78 (n = 28) weeks after start of therapy. Data are medians and 25–75th percentiles. *P < 0.05 and **P < 0.01 versus baseline. Hatched areas indicate 25–75th percentiles in 19 healthy controls. As for IP-10 (b), both 25th and the 75th percentiles in healthy controls were below the detection limit of the assay (see Table 2).
IFN-α, neopterin and IP-10 levels in relation to immunological and virologic response during HAART
During HAART there was a significant negative correlation between CD4+ T cell counts and plasma levels of IP-10 and IFN-α at both 26 and 52 weeks of therapy (data not shown). To examine further the relationship between immunological response and IFN-α, IP-10 and neopterin levels during HAART, the patients were classified as immunological responders (n = 28) or non-responders (n = 10) after 52 weeks of therapy. Since no standardized criteria for immunological response exist we chose to define patients as immunological non-responders on the basis of the following criteria: < 20% increase in CD4+ T cells compared with baseline (patients with > 100 × 106/l CD4+ cells at baseline) or < 20 × 106/l increase in CD4+ T cells compared with baseline (patients with < 100 × 106/l CD4+ cells at baseline). As shown in Fig. 2, immunological non-responders had significantly higher levels of both IFN-α and IP-10 at several time points during the first 52 weeks of therapy compared with other HIV-infected patients. In fact, non-responders had markedly increased IFN-α levels even before initiating therapy (Fig. 2). Moreover, while responders had a significant decrease in both IP-l0 and IFN-α levels after initiating HAART, non-responders had only a minor non-significant decrease (IFN-α) or even an increase (IP-10) in concentration after start of therapy (Fig. 2). A similar pattern of correlations was found also after 78 weeks on HAART. As for neopterin, more modest differences were found between immunological responders and non-responders at baseline. However, while neopterin levels significantly decreased in responders (P < 0.001), this was not seen in patients with immunological treatment failure (data not shown).
Fig. 2.

IFN-α and IP-10 levels in relation to immunological treatment failure after 52 weeks of HAART. Plasma levels of IFN-α (a) and IP-10 (b) at different times after initiation of HAART in 10 patients classified as immunological non-responders (▪) and in 28 immunological responders (□). Immunologic treatment failure was defined as < 20% increase in CD4+ T cells compared with baseline (patients with > 100 × 106/l CD4+ cells at baseline) or < 20 × 106/l increase in CD4+ T cells compared with baseline (patients with < 100 × 106/l CD4+ cells at baseline) after 52 weeks of therapy. Data are medians and 25–75th percentiles. *P < 0.05 and **P < 0.01 versus responders; †P < 0.05 and ††P < 0.01 versus baseline.
In contrast to the correlation with immunological response, no significant relationships were found between virologic response and IFN-α, neopterin or IP-10 levels during HAART (data not shown).
Effect of exogenously added IFN-α and IP-10 on PBMC proliferation in vitro
Our findings suggest that a persistent elevation of IP-10 and IFN-α may be associated with lack of immunological response during HAART. It is noteworthy that these trends were seen long before manifestations of treatment failure, and as for IFN-α, even high baseline levels appear to predict immunological treatment failure. To examine further the possible immunosuppressive effect of IFN-α and IP-10 during HIV infection, we measured the effect of different concentrations of these cytokines on PHA-stimulated proliferation of PBMC in six HIV-infected patients on HAART (five immunological responders and one non-responder) and five healthy controls. Low IFN-α doses (< 100 pg/ml) exhibited a modest and non-significant stimulatory effect on PHA-stimulated PBMC proliferation (~10% increase). In contrast, a marked dose-dependent suppressive effect was observed in all patients and controls with higher doses, reaching ~40% of baseline at the highest concentration tested (100 ng/ml) (Table 3). This suppressive effect was blocked by neutralizing IFN-α antibodies added before stimulation (data not shown). Notably, the suppressive effect was already detectable at doses as low as 100 pg/ml, comparable with IFN-α plasma levels in some HIV-infected patients. In contrast, IP-10 even at high doses exhibited only a slight suppressive effect on PHA proliferation in PBMC in some HIV-infected patients and controls (Table 3). As we found for IFN-α, addition of low IP-10 doses caused a modest and non-significant increase (~10%) in proliferation (data not shown).
Table 3.
Effect of exogenously added IFN-α on phytohaemagglutinin (PHA)-stimulated proliferation of peripheral blood mononuclear cells
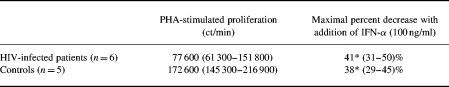
Data are given as medians and 25–75th percentiles.
*P < 0.05 versus PHA-stimulated proliferation. As for IP-10, a median reduction in PHA stimulated proliferation of 4% and 1% (patients and controls, respectively) was seen at the highest concentration used (10 ng/ml).
The effect of IFN-α on PHA-stimulated apoptosis
To elucidate the mechanisms for the inhibitory effect of IFN-α on lymphocyte proliferation, we tested whether IFN-α influenced PHA-induced apoptosis in PBMC from two blood donors and two HIV-infected patients on HAART. The HIV-infected patients had markedly enhanced PHA-stimulated lymphocyte apoptosis (annexin labelling and TUNEL assay, data not shown). However, in neither patients nor controls did IFN-α change the percentage of viable lymphocytes (propidium iodide staining) or the percentage of lymphocytes undergoing apoptosis (annexin labelling and TUNEL assay, data not shown).
DISCUSSION
HIV infection is associated with significant abnormalities of cytokine production [7,29–31], and there are reasons to believe that this dysregulated cytokine network may play an important pathogenic role in the progression of HIV-related disease [32]. The present study, by demonstrating high levels of both IP-10 and IFN-α in HIV-infected patients, with particularly high levels in those with most advanced clinical and immunological disease, further supports this hypothesis.
Treatment of HIV-infected patients with HAART has a profound down-regulatory effect on HIV replication in vivo and is associated with increases in CD4+ and CD8+ T cell counts [18]. In the present study we found that HAART induced a marked decrease in plasma concentrations of IFN-α, neopterin and IP-10, though not to normal levels. Furthermore, while the neopterin and IP-10 levels were significantly decreased throughout the study period, IFN-α levels returned to baseline at the end of the study. These observations support the notion that full immunological normalization may not be achieved during HAART. Even more importantly, our findings suggest that persistently high levels of IP-10, and particularly IFN-α, are associated with lack of immunological response as reflected by CD4+ cell increase. Notably, a lack of decline or even a rise in these cytokines was an early indicator of immunological treatment failure, and as for IFN-α, even high baseline levels appear to predict such treatment failure. Furthermore, our finding of a marked suppressive effect of IFN-α on PHA-induced PBMC proliferation, even in concentrations comparable to circulating levels in HIV-infected patients, suggests that the association between immunological treatment failure and persistently high IFN-α levels are not only parallel phenomena, but rather reflect an important immunopathogenic role of IFN-α associated with impaired numerical and functional restoration of CD4+T cells during HAART.
IFN-α has previously been reported to impair proliferation of various cell types [1,33], and in the present study we found a markedly suppressive effect of exogenously added IFN-α on PHA-stimulated lymphocyte proliferation in both HIV-infected patients and controls, which appears not only to reflect a decreased proportion of viable cells when thymidine was added to cell cultures. Although IFN-α has been reported to promote apoptosis in some cell lines [34–36], this was not observed in PHA-stimulated PBMC. The mechanisms for the suppressive effect of IFN-α on lymphocyte proliferation are therefore unclear, but may involve factors such as enhanced production of cytokines with anti-proliferative effects (e.g. IL-10) [37], and/or disturbances of specific components of the cell cycle control apparatus (e.g. cyclins and cyclin-dependent kinases) [34,35]. While the plasma concentrations of IFN-α in the majority of patients were below the concentration which would be expected to have suppressive effects on lymphocyte proliferation, concentrations of both IFN-α and other relevant cytokines are probably considerable higher in lymphoid tissue. Thus whatever the mechanisms, our findings, in addition to the recent demonstration of inhibitory effects of IFN-α on production of chemokines [17] and IL-12 [38], suggest a role for IFN-α in HIV-related disease and immunodeficiency.
The present study is to our knowledge the first report of elevated IP-10 levels during HIV infection. IP-10 has been shown to be produced by a variety of cell types [20,21], and although it was named as a protein inducible by IFN-γ, other agents including IFN-α have been found to induce IP-10 expression in vitro [20,39]. Interestingly, we found a significant correlation between IFN-α and IP-10 levels at all time points during HAART, possibly reflecting in vivo induction of IP-10 production by IFN-α. Furthermore, and with relevance to HIV infection, IP-10 seems to be predominantly chemotactic to activated T cells and enhanced IP-10 levels have been suggested to play a pathogenic role in various inflammatory disorders [20,40,41]. Similar mechanisms may also be operating in HIV infection, possibly favouring a persistent ‘inflammatory stress’ which again may be related to disease progression. On the other hand, IP-10 may have potential beneficial effects in HIV-infected patients, e.g. by impairing the development of Kaposi's sarcoma [42]. Although the biological significance of raised IP-10 levels in HIV infection is unclear, IP-10 may represent a ‘new’ chemokine involved in the pathogenesis of HIV infection.
The role of IFN-α in HIV infection is complex and only incompletely understood. Several in vitro studies have shown that IFN-α has significant anti-retroviral activities affecting the ability of HIV to infect and replicate in its target cell [2,6–8]. Moreover, beneficial effects of IFN-α in the treatment of early HIV-infection with stabilizing effect on CD4+T cell counts have also been reported in addition to its effect on Kaposi's sarcoma [7,14,43]. On the other hand, elevated serum levels of IFN-α and its surrogate markers are found in patients with advanced HIV disease, suggesting an association with adverse clinical outcome [6,15,16]. Moreover, although IFN-α may have anti-viral effects against HIV, Gingeri et al. demonstrated clinical and immunological beneficial effects of anti-IFN-α immunization in HIV-infected patients [44]. Furthermore, as also suggested by the present study, IFN-α has been found to mediate immunosuppression rather than immunostimulation in HIV-infected patients [17]. Thus, any anti-viral effects IFN-α may have in HIV infection may be overshadowed by detrimental effects on the immune system.
The failure of state-of-the-art HAART regimens to totally eradicate the virus, the emergence of drug-resistant strains, serious long-term side effects and in particular the persistence of HIV-associated immunodeficiency, call for additional immunomodulating therapy in HIV infection. The present study suggests that further exploration of IFN-α as target for immunomodulating therapy in HIV-infected patients might be rewarding.
Acknowledgments
This work was supported by the Research Council of Norway, the Norwegian Cancer Society, Anders Jahre's Foundation, Medinnova Foundation and Odd Kre Rabben's Memorial Found for AIDS Research. We thank MSD, Merck Sharp & Dohme, for financial support. We also thank Bodil Lunden, Lisbeth Wikeby, Vigdis Bjerkeli and Merete Tjalve for excellent technical assistance.
References
- 1.Baron S, Tyring SK, Fleischmann WR, Coppenhaver DH, Niesel DW, Klimpel GR, Stanton J, Hughes TK. The interferons: mechanisms of action and clinical applications. JAMA. 1991;266:1375–83. doi: 10.1001/jama.266.10.1375. [DOI] [PubMed] [Google Scholar]
- 2.Laurence J. Immunology of HIV infection, I: Biology of the interferons. AIDS Res Hum Retrovir. 1990;6:1149–56. doi: 10.1089/aid.1990.6.1149. [DOI] [PubMed] [Google Scholar]
- 3.Gutterman JU. Cytokine therapeutics: lessons from interferon α. Proc Natl Acad Sci USA. 1994;4:1198–205. doi: 10.1073/pnas.91.4.1198. [DOI] [PMC free article] [PubMed] [Google Scholar]
- 4.Biron CA. Role of early cytokines, including alpha and beta interferons (INF-α/β), in innate and adaptive immune responses to viral infections. Semin Immunol. 1998;10:383–90. doi: 10.1006/smim.1998.0138. [DOI] [PubMed] [Google Scholar]
- 5.Boehm U, Klamp T, Groot M, Howard JC. Cellular responses to interferon-γ. Annu Rev Immunol. 1997;15:749–95. doi: 10.1146/annurev.immunol.15.1.749. [DOI] [PubMed] [Google Scholar]
- 6.Francis ML, Meltzer MS, Gendelman HE. Interferons in the persistence, pathogenesis and treatment of HIV infection. AIDS Res Hum Retrovir. 1992;8:199–207. doi: 10.1089/aid.1992.8.199. [DOI] [PubMed] [Google Scholar]
- 7.Poli G, Biswas P, Fauci AS. Interferons in the pathogenesis and treatment of human immunodeficiency virus infection. Antiviral Res. 1994;24:221–33. doi: 10.1016/0166-3542(94)90069-8. [DOI] [PubMed] [Google Scholar]
- 8.Valdez H, Lederman MM. Cytokines and cytokine therapies in HIV infection. AIDS Clin Rev. 19971998:187–228. [PubMed] [Google Scholar]
- 9.Murray HW, Rubin BY, Masur H, Roberts RB. Impaired production of lymphokines and immune (gamma) interferon in the acquired immunodeficiency syndrome. N Engl J Med. 1984;310:883–8. doi: 10.1056/NEJM198404053101404. [DOI] [PubMed] [Google Scholar]
- 10.Ullum H, Lerri AC, Bendtzen K, Victor J, Gøtzsche PC, Philips AN, Skinhøj P, Pedersen BK. Low production of interferon γ is related to disease progression in HIV infection: evidence from a cohort of 347 HIV-infected individuals. AIDS Res Hum Retrovir. 1997;13:1039–46. doi: 10.1089/aid.1997.13.1039. [DOI] [PubMed] [Google Scholar]
- 11.Voth R, Rossol S, Klein K, Hess G, Schutt KH, Schrøder HC, Büschennfelde MZ, Müller WG. Differential gene expression of INF-α and tumor necrosis factor-α in peripheral blood mononuclear cells from patients with AIDS related complex and AIDS. J Immunol. 1990;144:970–5. [PubMed] [Google Scholar]
- 12.Skillman DR, Malone JL, Decker CF, Wagner KF, Mapou RL, Liao MJ, Testa D, Meltzer MS. Phase I trial of interferon alfa-n3 in early-stage human immunodeficiency virus type 1 disease: evidence for drug safety, tolerance and antiviral activity. J Infect Dis. 1996;173:1107–14. doi: 10.1093/infdis/173.5.1107. [DOI] [PubMed] [Google Scholar]
- 13.Frissen PHJ, van der Ende ME, Napel CH, et al. Zidovudine and interferon-α combination therapy versus zidovudine monotherapy in subjects with symptomatic human immunodeficiency virus type 1 infection. J Infect Dis. 1994;169:1351–5. doi: 10.1093/infdis/169.6.1351. [DOI] [PubMed] [Google Scholar]
- 14.Stein DS, Timpone JG, Gradon JD, Kagan JM, Schnittman SM. Immunobased therapeutics: scientific rationale and the promising approaches to the treatment of the human immunodeficiency virus-infected individual. Clin Infect Dis. 1993;17:749–71. doi: 10.1093/clinids/17.4.749. [DOI] [PubMed] [Google Scholar]
- 15.Von Sydow M, Sönnerborg A, Gaines H, Strannegård Ö. Interferon-alpha and tumor necrosis factor-alpha in serum of patients in various stages of HIV-1 infection. AIDS Res Hum Retrovir. 1991;7:375–80. doi: 10.1089/aid.1991.7.375. [DOI] [PubMed] [Google Scholar]
- 16.Krown S, Niedzwiecki D, Bhalla RB, Flomenberg N, Bundow D, Chapman D. Relationship and prognostic value of endogenous interferon-α, β2-microglobulin, and neopterin serum levels in patients with Kaposi sarcoma and AIDS. J Acquir Immune Defic Syndr. 1991;4:871–80. [PubMed] [Google Scholar]
- 17.Zagury D, Laghagar A, Chams V, et al. Interferon α and Tat involvement in the immunosuppression of uninfected T cells and C-C chemokine decline in AIDS. Proc Natl Acad Sci USA. 1998;7:3851–6. doi: 10.1073/pnas.95.7.3851. [DOI] [PMC free article] [PubMed] [Google Scholar]
- 18.Kelleher AD, Carr A, Zaunders J, Cooper DA. Alterations in the immune response of human immunodeficiency virus (HIV)-infected subjects treated with an HIV-specific protease inhibitor, ritonavir. J Infect Dis. 1996;173:321–9. doi: 10.1093/infdis/173.2.321. [DOI] [PubMed] [Google Scholar]
- 19.Pantaleo G. How immune-based intervention can change HIV therapy. Nature Med. 1997;3:483–6. doi: 10.1038/nm0597-483. [DOI] [PubMed] [Google Scholar]
- 20.Neville LF, Mathiak G, Bagasra O. The immunobiology of interferon-gamma inducible protein 10kD (IP-10): a novel, pleiotropic member of the C-X-C chemokine superfamily. Cytokine Growth Factor Rev. 1997;3:207–19. doi: 10.1016/s1359-6101(97)00015-4. [DOI] [PubMed] [Google Scholar]
- 21.Venugopal G, Simons FE, Hayglass KT. Human IP-10 selectively promotes dominance of polyclonally activated and environmental antigen-driven INF-γ over IL-4 responses. FASEB J. 1998;12:705–13. doi: 10.1096/fasebj.12.9.705. [DOI] [PubMed] [Google Scholar]
- 22.Centers for Disease Control and Prevention. 1993 revised classification for HIV infection and expanded surveillance case definition for AIDS among adolescents and adults. MMWR. 1992;41:1–19. [PubMed] [Google Scholar]
- 23.Thasavu PW, Longhurst S, Joel SP, Slevin ML, Balkwill FR. Measuring cytokine levels in blood. Importance of anticoagulants, processing, and storage conditions. J Immunol Methods. 1992;153:115–24. doi: 10.1016/0022-1759(92)90313-i. [DOI] [PubMed] [Google Scholar]
- 24.Müller F, Rollag H, Gaudernack G, Frøland SS. Impaired in vitro survival of monocytes from patients with HIV infection. Clin Exp Immunol. 1990;81:25–30. doi: 10.1111/j.1365-2249.1990.tb05286.x. [DOI] [PMC free article] [PubMed] [Google Scholar]
- 25.Sgonc R, Boeck G, Dietrich H, Gruber J, Recheis H, Wick G. Simultaneous determination of cell surface antigens and apoptosis. Trends Genet. 1994;10:41–42. doi: 10.1016/0168-9525(94)90140-6. [DOI] [PubMed] [Google Scholar]
- 26.Dolzhanskiy A, Basch RS. Flow cytometric determination of apoptosis in heterogeneous cell populations. J Immunol Methods. 1995;180:131–40. doi: 10.1016/0022-1759(94)00309-k. [DOI] [PubMed] [Google Scholar]
- 27.Brinchman JE, Vartal F, Gaudernak G, Markussen G, Funderud S, Ugelstad S, Thorsby E. Direct immunomagnetic quantification of lymphocyte subsets in blood. Clin Exp Immunol. 1988;71:182–6. [PMC free article] [PubMed] [Google Scholar]
- 28.Ross C, Svenson M, Hansen MB, Vejlsgaard GL, Bendtzen K. High avidity IFN-neutralizing antibodies in pharmaceutically prepared human IgG. J Clin Invest. 1995;95:1974–8. doi: 10.1172/JCI117881. [DOI] [PMC free article] [PubMed] [Google Scholar]
- 29.Clerici M, Shearer GM. A Th1?Th2 switch is a critical step in the etiology of HIV infection. Immunol Today. 1993;14:107–11. doi: 10.1016/0167-5699(93)90208-3. [DOI] [PubMed] [Google Scholar]
- 30.Maggi E, Mazztti M, Ravina A, et al. Ability of HIV to promote a Th1 to TH2 shift and to replicate preferentially in Th2 and Th0 cells. Science. 1994;265:244–8. doi: 10.1126/science.8023142. [DOI] [PubMed] [Google Scholar]
- 31.Aukrust P, Liabakk NB, Muller F, Lien E, Espevik T, Frøland SS. Serum levels of tumor necrosis factor-α (TNF-α) and soluble TNF receptors in human immunodeficiency virus type 1 infection—correlations to clinical, immunologic, and virologic parameters. J Infect Dis. 1994;169:420–4. doi: 10.1093/infdis/169.2.420. [DOI] [PubMed] [Google Scholar]
- 32.Fauci SA. Host factors and the pathogenesis of HIV-induced disease. Nature. 1996;384:529–34. doi: 10.1038/384529a0. [DOI] [PubMed] [Google Scholar]
- 33.Brouty-Boyé D. Inhibitory effects of interferons on cell multiplication. Lymphokine Reports. 1980;1:99–112. [Google Scholar]
- 34.Stark RG, Kerr IM, Williams BRG, Silverman RH, Schreiber RD. How cells respond to interferons. Annu Rev Biochem. 1998;67:227–64. doi: 10.1146/annurev.biochem.67.1.227. [DOI] [PubMed] [Google Scholar]
- 35.Giandamenico V, Vaccari G, Fiorucci G, et al. Apoptosis and growth inhibition of squamous carcinoma cells treated with interferon-alpha, INF-beta and retinoic acid are associated with induction of the cyclin-dependent kinase inhibitor p21. Eur Cytokine Net. 1998;4:619–31. [PubMed] [Google Scholar]
- 36.Spets H, Georgii-Hemming P, Siljason J, Nilsson K, Jernberg-Wiklund H. Fas/APO-1 (CD95)-mediated apoptosis is activated by interferon-γ and interferon-α in interleukin-6 (IL-6)-dependent and IL-6-independent multiple myeloma cell lines. Blood. 1998;92:2914–23. [PubMed] [Google Scholar]
- 37.Aman J, Tretter T, Eisenbeis I, et al. Interferon-α stimulates production of interleukin-10 in activated CD4+ T cells and monocytes. Blood. 1996;87:4731–6. [PubMed] [Google Scholar]
- 38.Cousens LP, Orange JS, Su HC, Biron CA. Interferon-α/β inhibition of interleukin 12 and interferon-γ production in vitro and endogenously during viral infection. Proc Natl Acad Sci USA. 1997;94:634–9. doi: 10.1073/pnas.94.2.634. [DOI] [PMC free article] [PubMed] [Google Scholar]
- 39.Vanguri P, Farber JM. Identification of CRG-2: an interferon-inducible mRNA predicted to encode a murine monokine. J Biol Chem. 1990;265:15049–57. [PubMed] [Google Scholar]
- 40.Loetscher M, Gerber B, Loetscher P, Jones SA, Piali L, Clark-Lewis I, Baggiolini M, MoSeries B. Chemokine receptor specific for IP-10 and MIG: structure, function, and expression in activated T-lymphocytes. J Exp Med. 1996;184:963–9. doi: 10.1084/jem.184.3.963. [DOI] [PMC free article] [PubMed] [Google Scholar]
- 41.Gattass CR, King LB, Luster AD, Ashwell JD. Constitutive expression of interferon γ-inducible protein 10 in lymphoid organs and inducible expression in T cells and thymocytes. J Exp Med. 1994;179:1373–8. doi: 10.1084/jem.179.4.1373. [DOI] [PMC free article] [PubMed] [Google Scholar]
- 42.Geras-Raaka E, Varma A, Ho H, Clark-Lewis I, Gershegorn MC. Human interferon-gamma-inducible protein 10 (IP-10) inhibits constitutive signaling of Kaposis sarcoma-associated herpesvirus G protein-coupled receptor. J Exp Med. 1998;188:405–8. doi: 10.1084/jem.188.2.405. [DOI] [PMC free article] [PubMed] [Google Scholar]
- 43.Schnittmann SM, Vogel S, Baseler M, Lane CH, Davey RT. A phase I study of interferon-α2b in combination with interleukin-2 in patients with human immunodeficiency virus infection. J Infect Dis. 1994;169:981–9. doi: 10.1093/infdis/169.5.981. [DOI] [PubMed] [Google Scholar]
- 44.Gingeri A, Santagostino E, Cusini M, et al. Absence of clinical, virological, and immunological signs of progression in HIV-1-infected patients receiving active anti-interferon-α immunization: a 30-month follow-up report. J Acquir Immune Defic Syndr Human Retrovirol. 1996;13:55–67. doi: 10.1097/00042560-199609000-00009. [DOI] [PubMed] [Google Scholar]