

Abstract
Pathogenic antigens involved in the induction of Heymann nephritis (HN), an experimental rat model of human membranous nephritis, have been identified in megalin (gp330) and the receptor-associated protein (RAP) [1,2]. A pathogenic epitope has been identified in RAP (amino acid 1–86) that plays a significant role in the formation of immune deposits in glomeruli in HN. A synthetic peptide (P31−53) derived from RAP1−86 contains a pathogenic epitope recognized by antibodies eluted from glomerular immune deposits and includes two putative RT-1B1 MHC class II-binding motifs. We have investigated whether RAP P31−53 can be recognized by T cells. Five peptide-specific T cell lines were generated from regional lymph node (LN) T cells from Lewis rats immunized with P31−53. The T cell lines were characterized by using a T cell proliferation assay for their specificity, FACS and MHC restriction assay for the phenotype, reverse transcription-polymerase chain reaction for TCR Vβ repertoire and cytokine expression, and cloning and sequencing for the analysis of the CDR3 sequence of TCR. The helper function of the T cell line was confirmed by autoantibody production in vitro. In this study, we clearly identify that the synthetic pathogenic peptide P31−53 contains a T cell epitope recognized by CD4+ Th2 cells in Lewis rats. This recognition was restricted by MHC class II RT1.B1. These CD4+ Th2 cells were able to promote B cells to produce specific antibodies and used a restricted set of TCR Vβ genes with preferential usage of Vβ18. A charged amino acid motif at the CDR3 region of predominant TCR Vβ subfamilies may contribute to the specific ability of these cells to recognize the immunogenic T cell epitope within RAP peptide P31−53.
Keywords: RAP, Heymann nephritis, epitope, T cell line, T cell receptor
INTRODUCTION
Active Heymann nephritis (HN) is an experimental rat model of autoimmune-mediated glomerulonephritis that shares evident similarities at pathophysiologic and immunohistologic levels with human membranous nephropathy [3,4]. Active HN is commonly induced by immunizing rats with a crude renal tubular antigen (RTA/Fx1A) emulsified in Freund's complete adjuvant (FCA) [5,6]. In HN renal injury is thought to be due to the binding of autoantibodies to autoantigens expressed on glomerular epithelial cells, leading to the formation of subepithelial immune deposits (ID) along the glomerular basement membrane with the activation of complement, resulting in severe glomerular dysfunction and proteinuria [7].
Both megalin (gp330) [1,2] and the receptor-associated protein (RAP) [8] are considered to be major pathogenic autoantigens since active HN can be induced by immunization of rats with either. Recently significant progress has been made in mapping a pathogenic epitope within the 86 N-terminal amino acids of RAP (RAP1−86) which plays a key role in the formation of subepithelial ID during the initiation of HN [9]. Furthermore, a synthetic peptide (P31−53) derived from RAP1−86 has been shown to contain an ID-inducing epitope by SPOTs assay. Injection of antibodies raised against this synthetic P31−53 into rats can induce stable glomerular ID [10].
Previous studies have shown that the induction of an autoantibody response to RTA (Fx1A) is dependent upon CD4+ T helper (Th) cells, which provide help for autoantibody production [11]. The role of CD4+ T cells in the mediation of HN was further confirmed by the observation that anti-CD4 MoAb therapy can totally prevent the proteinuria [12]. Although CD4+ T cells have an established role in the production of pathogenic autoantibody in HN [11,12], little is known about the immunogenic T cell epitopes or their responding T cell receptors (TCR). One obvious candidate is RAP, which contains a well-characterized pathogenic epitope P31−53 that binds antibodies eluted from the glomeruli of rats with active HN and initiates ID. This peptide contains two putative RT1.B1 MHC class II peptide binding motifs (S x x x x x E), thought to be important for generation of antibodies in Lewis rats [13]. Based on those findings, we reasoned that RAP P31−53 may be presented by antigen-presenting cells (APC) in the context of MHC class II and recognized by T cells. If so, the identification of T cell epitopes and analysis of corresponding TCR should provide important information for the design of rational therapeutic interventions.
MATERIALS AND METHODS
Animals
Inbred male Lewis rats were obtained from the Animal Resources Centre in Perth, Western Australia. Rats weighing 180–200 g at the age of 8–10 weeks were used in all experiments.
Antigens
Peptide P31−53 of RAP (sequence KAKRLHLSPVRLAELHSDLKIQE) was synthesized after the published data [10]. The irrelevant peptide sequence of a cellular structural protein was used (CESLYRQLERNSLLSNELKLTL) as a control. The two peptides were synthesized by Peptide Express (Colorado State University, Fort Collins, CO) and purified to >90% by reverse phase HPLC.
Immunization
Each group of four Lewis rats was immunized in both hind footpads with a 100-μ l emulsion of 300 μ g or 600 μ g of P31−53 in FCA containing 1 mg Mycobacterium tuberculosis H37Ra (Difco, Detroit, MI). Boosters were given subcutaneously with P31−53 in Freund's incomplete adjuvant (FIA) at 3 weeks and 7 weeks. Five control rats were immunized with FCA prepared without P31−53.
Production of T cell lines
T cell lines were independently developed from five rats. Popliteal lymph nodes were obtained 14 days after immunization and teased to a single-cell suspension. Lymph node (LN) cells (4 × 10⁶) were stimulated with P31−53 at a concentration of 20 μ g/ml for 7 days in complete RPMI medium supplemented with 2·5% syngeneic rat serum. Following stimulation, the T cell blasts were isolated on Lymph-prep (Cedar Lane, Canada). The T cells (1 × 10⁶) were restimulated weekly with P31−53 (20 μ g/ml) and 3 × 10⁶ irradiated syngeneic splenocytes as APC in complete RPMI supplemented with 10% fetal calf serum (FCS) and 10% concanavalin A (Con A) supernatant. After the first round of stimulation, the cells were analysed for their specificity to P31−53 in a proliferation assay. Following nine rounds of stimulation, the five T cell lines were characterized in detail.
T cell proliferation assay
After the first round of P31−53 stimulation, 1 × 10⁵ cells were seeded in microtitre plates with 3 × 10⁵ irradiated (25 Gy) syngeneic splenocytes as APC in the presence of peptide at 20 μ g/ml. The culture was incubated in triplicate for 72 h. Each well was pulsed with 1 μ Ci of 3H-thymidine for the final 18 h. 3H-TdR uptake was determined by standard technique. Proliferation was expressed as mean ct/min. The results were expressed as mean ct/min and a stimulation index (SI).
FACS analysis
Cell lines were incubated with either OX-35 (anti-CD4) or OX8 (anti-CD8) FITC-conjugated anti-rat MoAbs (PharMingen, San Diego, CA) or an isotype control antibody. Samples were analysed using a Becton Dickinson (Heidelberg, Germany) FACScan analyser.
Determination of MHC restriction pattern
Anti-MHC MoAbs were used with the proliferation assay to determine the MHC restriction of T cell responses to P31−53: OX6 (anti-RT1.B, class II), OX17 (anti-RT1.D, class II), OX18 (anti-RT1.A, class I) and an isotype control antibody.
P31−53 specific immunoglobulin production in vitro
Demonstration of immunoglobulin production in vitro was essentially according to the method of Saoudi et al. [14]. Co-cultures were performed by seeding 1 × 10⁵ cells from the P31−53-specific T cell lines after nine rounds of peptide stimulation to 5 × 10⁵ naive syngeneic spleen cells in a final volume of 0·2 ml/well in microculture plates in the present of P31−53 at 20 μ g/ml for 13 days. A volume of 150 μ l of culture supernatant was collected from each well at days 6, 9 and 13. Cultures were assayed for anti-P31−53 autoantibodies by ELISA.
RNA extraction and cDNA synthesis
Total RNA was extracted from LN cells and T cell lines by acid guanidinium thiocyanate-phenol-chloroform extraction method [15]. cDNA was synthesized by using random hexamer primers (Promega, Madison, WI) and M-MuLV reverse transcriptase (Gibco BRL, Grand Island, NY).
Reverse transcription-polymerase chain reaction for TCR Vβ repertoire
Oligonucleotide primers used for rat TCR Vβ1–20 were those described by Gold et al. [16]. Oligonucleotide primers for TCR Cβ (5′-tgtttgtctgcgatctctgc-3′), for TCR Vβ and TCR C-Cβ primers (5′-accatgtggagctgagctg-3′ and 5′-cactacccagcgtacttgacaaagc-3′) specific for the constant region of TCR were designed using PCRprim software. The polymerase chain reaction (PCR) profile used was 1 min at each of 95°C, 60°C and 72°C for 32 cycles.
The specificity of each PCR product was verified by separate hybridization with Tris (2,2′-bipyridine) ruthenium (II) chelate (TBR)-labelled sequence-specific oligonucleotide probes. Sequence of probe specific for TCR Vβ PCR products was 5′-aggtctccttgtttgagcca-3′ and probe for TCR C-Cβ PCR products was 5′-acaatcctcgcaaccacttc-3′. The electrochemiluminescent signal of the hybridized probe was detected with a QPCR 5000 system (Perkin Elmer, Norwalk, CT), as described [17,18]. The relative luminosity of each Vβ family member was expressed as a percentage of the total luminosity detected in all of the Vβ regions for a given sample.
To optimize the reverse transcription (RT)-PCR technique, two quantities of PBL cDNA were amplified with TCR C-Cβ primers with cycles from 24 to 41. QPCR luminosity units increased exponentially with the number of cycles until a plateau was reached. Thirty-two PCR cycles were used for the construction of a TCR Cβ standard curve in triplicate over a range of serial dilutions of known quantity of pooled PBL RNA for TCR Cβ. PCR amplification was performed in triplicate for TCR Vβ gene usage in all experimental samples in dilutions chosen so that the luminosity reading for the experimental sample fell upon the steep part of the standard curves.
Semiquantitative RT-PCR for cytokine genes
Oligonucleotide primers used for rat cytokine genes IL-2, IL-10, IL-4 and interferon-gamma (IFN-γ) were those described [19,20]. TCR C-Cβ primers specific for the constant region of TCR served as the internal control. The PCR profile used was 1 min each at 95°C, 60°C and 72°C for 30 cycles for TCR C-Cβ, 32 cycles for IL-10 and IFN-γ and 35 cycles for IL-2 and IL-4. RT-PCR fragments of cytokine genes were electrophoresed on a 2% agarose gel and then photographed on a negative film (Polaroid 665). Signal was quantified by densitometry (Molecular Dynamics, Sunnyvale, CA).
To measure PCR products of cytokine genes semiquantitatively, standard curves of the linear range of amplification for each cytokine gene primer pair were constructed over three logs of a known concentration of pooled RNA obtained from Con A-stimulated rat T cells collected at different stimulation times. PCR amplification was performed in triplicate for cytokine genes in all experimental samples in dilutions chosen so that the densitometry reading for the experimental sample fell on the steep part of the standard exponential curve.
Cloning and sequencing of TCR Vβ RΤ-PCR products
TCR Vβ PCR products were purified and then cloned into the pGEM-T vector system (Promega). DNA plasmid preparations were made from individual colonies using the Wizard plus SV miniprep kit (Promega). DNA sequencing was performed in both directions by the dideoxy chain determination method.
Antibody determination
Autoantibody titres were determined by ELISA as previously described [12]. Normal Lewis rat serum or culture media were used as the negative control. All samples were assayed in triplicate.
Immunofluorescence analysis
Kidneys were taken at 12 weeks post-inoculation for use in direct immunofluorescence studies. The frozen sections (4 μ m) were incubated for 30 min with FITC-labelled goat anti-rat IgG (Zymed Labs, San Francisco, CA).
Frozen sections (4 μ m) of normal Lewis rat kidney were fixed in acetone for 5 min and incubated with serum from a rat immunized with P31−53 at 12 weeks of sacrifice. For controls, sections were incubated with serum either from a rat immunized with FCA alone as the negative control or from a rat immunized with Fx1A as the positive control. The sections were then incubated with FITC-labelled goat anti-rat IgG (Zymed Labs).
RESULTS
Primed LN cell proliferation in response to a synthetic RAP P31−53
Proliferation of the LN cells specifically in response to P31−53 was detected after the first stimulation in vitro. As shown in Fig. 1, five rats manifested a strong T cell proliferative response to P31−53 but not to an irrelevant control peptide. In the control group, the rats immunized with FCA alone had no T cell proliferation in response to both P31−52 and an irrelevant peptide. The T cell proliferative response measured as a SI in the P31−53-immunized rats to P31−53 was 21·4 ± 16·4 and to the control peptide was < 1 or negligible. Thus, an antigenic T cell epitope was present within synthetic P31−53.
Fig. 1.

Proliferative responses of lymph node cells primed in vivo and stimulated in vitro for 7 days with peptide P31−53. The different symbols in each panel denote results obtained with individual rats. The data are expressed as mean ct/min in triplicate cultures.
T cell lines specific for P31−53 were CD4+CD8− and restricted by MHC class II RT1.B1
Five T cell lines were generated successfully by in vitro restimulation of draining LN cells from five rats immunized with P31−53. After nine rounds of stimulation with P31−53, FACS analysis of the phenotype of peptide-specific T cell lines showed that 95–98% of T cells in each cell line were CD4+CD8−. Addition of anti-RT1.B MoAb reduced proliferation of all T cell lines by > 70%, whereas anti-RT1.D or anti-RT1.A MoAbs had no significant effect on T cell proliferation (Fig. 2). These results demonstrate that the antigen-specific T cells of the five lines were CD4+CD8− cells and that T cell recognition of P31−53 was restricted by MHC class II RT1.B1.
Fig. 2.

Anti-MHC MoAb inhibition of peptide P31−53-specific T cell line responses to P31−53 after nine rounds of peptide stimulation in vitro. T cell lines were cultured with irradiated antigen-presenting cells and 20 μ g/ml P31−53 in the presence of 10 μ g/ml MoAb specific for RT1.B (OX6), RT1.D (OX17), RT1.A (OX18) and isotype control MoAb.
T cells specific for P31−53 had a restricted Th2 cytokine profile
After nine rounds of stimulation, T cell lines had a Th2 cytokine profile, in that IL-4 and IL-10 mRNA expression appeared to increase, whereas IL-2 and IFN-γ mRNA expression were almost undetectable (Fig. 3). To confirm these results further, we screened cytokine mRNA expression from T cell lines collected after 0, three, six and nine rounds of stimulation. Expression of mRNA encoding IL-4 and IL-10 genes increased substantially with increasing rounds of stimulation with P31−53. In contrast, expression of mRNA encoding IL-2 and IFN-γ gene decreased with increasing rounds of stimulation with P31−53.
Fig. 3.

The peptide-specific T cell line has a Th2 pattern of expression of cytokine mRNA with increasing rounds of peptide stimulation in vitro measured by semiquantitative reverse transcription-polymerase chain reaction (RT-PCR). The numbers at the top represent different rounds of peptide stimulation in vitro. The TCR β-chain constant region (TCR C-Cβ) was an internal control for the semiquantitative RT-PCR. Data show a representative repeated experiment from a cell line. All PCR products were separated on a 2% agarose gel (top panel) and of the expected size based on the molecular weight markers in lane 1. The results are expressed as ratio of cytokine gene densitometry score to TCR C-Cβ densitometry score (bottom panel).
Specific T cell lines promote B cell activation of antibody production
As shown in Fig. 4, low but measurable titres of autoantibodies (IgG) to peptide P31−53 were detectable in supernatant at 9 and 13 days after co-culture of T cell lines with naive spleen cells, but not at 6 days. In controls, no antibody could be detected in supernatants obtained from the cultures of T cell lines with or without irradiated spleen cells and spleen alone.
Fig. 4.

Ability of two peptide-specific T cell lines to trigger in vitro antibody production by syngenic spleen cells. Antibodies (immunoglobulin) to P31-53 were measured by ELISA.▪, ELISA optical density(OD) results from the supernatant from co-cultures of T cell line and naive syngenic spleen cells; □, results from the co-culture of T cell lines with irradiated syngenic spleen cells; diagonal and horizontal hatched bars, respectively, show the results from supernatant of culture T cell lines alone and the supernatant from culture of T cell lines alone and the supernatant from culture of syngeneic spleen cells alone. Results are plotted as mean ± s.e.m. of three individual cultures.
T cell lines specific for P31−53 use a restricted set of TCR Vβ
By the ninth stimulation, TCR Vβ gene usage by five peptide-specific T cell lines was largely restricted to Vβ18. Percentages of Vβ18 in total TCR repertoire of five cell lines were 54%, 47·4%, 41·4%, 36·4% and 21·1%, respectively. To demonstrate how the RAP peptide shapes TCR Vβ repertoire over time in vitro, a representative cell line was analysed for TCR Vβ gene expression after 0, three and six cycles of peptide-specific stimulation. Table 1 show that TCR Vβ gene usage became progressively limited to Vβ18 (54%), Vβ4 (10%) and Vβ14 (10%). By the ninth stimulation, these three Vβ subfamilies accounted for > 70% of all the cells in the line.
Table 1.
T cell receptor (TCR) Vβ usage became progressively limited to Vβ18, Vβ4 and Vβ14
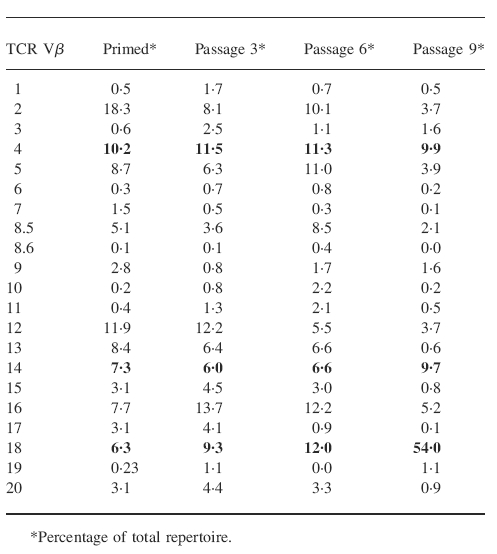
Percentage of total repertoire.
Analysis of CDR3 sequence of Vβ PCR products
The deduced amino acid sequences are shown in Table 2. Analysis of CDR3 sequence encoding Vβ18 RT-PCR products from a representative T cell line after nine rounds of peptide stimulation demonstrated that 12 out of 12 clones shared identical CDR3 sequences based on identity at the nucleic acid level. In contrast, Vβ18 RT-PCR products derived directly from LN cells were remarkably heterogeneous, as shown in Table 3. Of 34 clones, 28 showed different CDR3 sequences at the nucleic acid level. Usage of CDR3 region of TCR Vβ18 segments in the cell line became highly restricted with increasing rounds of P31−53 stimulation in vitro. Six out of 34 clones (17·6%) derived directly from LN cells primed with P31−53 had the same CDR3 sequence as that seen in the T cell line studied after nine rounds of peptide stimulation (Table 3). By three rounds and six rounds of P31−53 stimulation, eight out of 14 (57%) and six out of six clones (100%) had, respectively, the same CDR3 sequence as that seen in the T cell line studied after nine rounds of peptide stimulation. These results demonstrate that repeated stimulation with P31−53 creates a clonal expansion of T cells bearing TCR Vβ18 segments with an antigen-specific CDR3 sequence.
Table 2.
CDR3 sequences of T cell receptor (TCR) Vβ reverse transcription-polymerase chain reaction products of lymph node (LN) cells from a rat immunized with the P31–253 stimulation

Standard single-letter codes for amino acids are employed. Underlined residues are encoded by D region. Bold residues are positively charged arginine (R) and negatively changed aspartic acid (D), or glutamic acid (E) residues encoded within the putative CDR3 regions. CDR3 include the 50′ S residue of the conserved C-A-S-(S) motif of most TCR Vb gene and the 3′ amino acid that precedes the conserved (X)-F-G-X-G motif presenting all TCR Jb gene [25].
Table 3.
CDR3 sequences of T cell receptor (TCR) Vβ reverse transcription-polymerase chain reaction products of lymph node (LN) cells from a rat immunized with the P31–253

As shown in Table 2, analysis of CDR3 sequence encoding Vβ4 RT-PCR products showed that 10 out of 10 clones had a common CDR3 sequence after nine rounds of P31−53 stimulation in vitro. Ten Vβ14 clones examined had three different CDR3 sequences after nine rounds of P31−53 stimulation in vitro.
Of particular interest is the striking similarity in the sequences of charged amino acids in the CDR3 regions of Vβ18 and Vβ4 in the T cell receptors we had sequenced after nine rounds of P31−53 stimulation in vitro. The CDR3 loops of Vβ18 and Vβ4 both contained a feature motif: positively charged residues (arginine) and negatively charged residues (aspartic acid) encoded N region addition/deletions and two hydrophobic residues (glycine) encoded D regions. Interestingly, a similar N region-encoded arginine (or the structurally similar histidine) was found in the CDR3 loops of Vβ14. An over-representation of another negatively changed residue (glutamic acid) in the CDR3 loops of Vβ18, Vβ4 and Vβ14 was contributed by the Jβ segment due to the nature of the joining process. These charged amino acids at the CDR3 region of these three predominant TCR Vβ subfamilies may contribute to the specific ability of these cells to recognize P31−53.
Assessment of disease activity
Anti-peptide P31−53 autoantibodies (IgG) were detectable in the sera of all rats immunized with P31−53 at 4 weeks and throughout the course until the rats were killed at 12 weeks (Fig. 5). The site specificity of these anti-peptide P31−53 autoantibodies was verified by staining normal rat kidney sections by indirect immunofluorescence. Autoantibodies against P31−53 reacted with an epitope of RAP present in the brush border region of the proximal renal tubules.
Fig. 5.

Serum titres of IgG antibodies to peptide P31−53 in groups of Lewis rats immunized with the peptide in Freund's complete adjuvant (FCA) to induce Heymann nephritis. Groups were immunized with 300 μ g of P31−53 in FCA (•; n = 4), or with 600 μ g of P31−53 (○; n = 4). Control rats was immunized with FCA alone (▾; n = 4).
We also analysed kidney sections from rats immunized with P31−53 at the time of sacrifice stained with FITC-labelled goat anti-rat IgG by direct immunofluorescence staining. The results showed that minimal faint staining for rat IgG was present on the glomerular basement membrane (Fig. 6a). The fluorescent signal was slightly higher than the control staining for endogenous rat IgG usually present in normal rat kidney sections (Fig. 6b). None of the rats immunized with P31−53 developed proteinuria.
Fig. 6.

FITC-labelled anti-rat IgG staining by directed immunofluorescence on frozen kidney sections from a rat immunized with P31−53 (a) and normal rat as a control (b) (mag. × 400). Faint staining for rat IgG (a) is seen in the capillary loops 12 weeks after immunization.
DISCUSSION
In this study we have shown that a synthetic pathogenic P31−53 recognized by antibodies eluted from the glomeruli of rats with HN also contains a T cell epitope. After immunization with P31−53, five T cell lines from primed regional LN cells manifested a strong T cell proliferation in response to P31−53. This proliferative response was specifically inhibited by RT1.B1 MHC class II antibody, suggesting that P31−53 was presented in the context of RT1.B1 molecules to T cells. This result is consistent with the predictions of Kerjaschki [9], in that the 23 amino acid P31−53 contained two putative RT1.B1 MHC class II binding motifs specific for Lewis rats which comprise a serine residue separated from a glutamic acid residue by five intervening amino acids (S x x x x x E) [13]. T cell recognition in ID-inducing P31−53 was clearly restricted by RT1.B1 MHC class II.
The peptide-specific T cell lines expressed the CD4 determinant and had a significant increase in mRNA expression for cytokines IL-4 and IL-10, suggesting that the cell lines were of CD4+ Th2 phenotype. Th2 cells are helpers for B cells. They trigger resting B cells to secrete antibodies directed at specific antigens, and are particularly effective in promoting IgG1 and IgE responses [21]. We have demonstrated that these CD4+ Th2 cells are able to trigger syngeneic naive B cell activation for anti-peptide immunoglobulin autoantibody production in vitro. CD4+ Th2 cells may play an important role in the pathogenic process of autoantibody production involved in initiation of HN in vivo.
Since CD4+ Th cells are strong autoantibody inducers [11,12], characterization of their TCR should provide important information regarding the relationship between the CDR3 of the TCR and the resulting antigenic peptide specificity. Interestingly, anti-P31−53 autoantibody-inducing CD4+ Th2 cells used a restricted set of Vβ18 (54%), Vβ4 (10%) and Vβ14 (10%) TCRs after nine rounds of stimulation with peptide. Sequencing analysis of TCR CDR3 regions of these three predominant Vβ segments from the T cell line specific for P31−53 showed striking features: a motif of charged residues was found in the V-D-J junctional regions of highly restricted Vβ18 and Vβ4 in TCR (bold letters in Table 2). The CDR3 region from a currently proposed TCR structure is thought to contact the antigenic peptides bound within a groove on the molecules of MHC during conventional antigenic peptide recognition [22,23]. Recent studies show that amino acid charge substitutions in the antigenic peptide induce T cell responses with reciprocal charge alterations in the junctional regions of the TCR β-chain [24]. Our CDR3 sequencing of these three predominant TCR Vβ genes suggest that a charged amino acid motif at the CDR3 region of TCR in the specific antibody-inducing CD4+ Th2 cell line may contribute to the specific ability of these cells to recognize the T epitopes within P31−53 of RAP.
In this study we have shown a synthetic pathogenic P31−53 of RAP contains a T cell epitope, and we have also characterized RAP P31−53-specific T cell lines. In future studies we plan to identify T cell epitopes in megalin/gp330 and their corresponding TCR. We hope that these experiments may eventually lead in turn to the development of rational immunotherapeutic interventions for the treatment of HN, and eventually of human membranous glomerulopathy.
Acknowledgments
This work was supported by grants from the Australian Kidney Foundation and the New Children's Hospital Fund. H.W. was the recipient of an Overseas Postgraduate Research Scholarship from the University of Sydney. We would like to thank Dr Paul Roy and Dr Takashi Ando for their assistance with interpretation of renal biopsies. We also thank Dr Mark Penny and Dr Luana Ferrara for their assistance with establishing the active HN model. Professor Peter Gunning kindly provided the control peptide.
REFERENCES
- 1.Kerjaschki D, Farquhar MG. Immunocytochemical localization of the Heymann nephritis antigen (GP330) in glomerular epithelial cells of normal Lewis rats. J Exp Med. 1983;157:667–86. doi: 10.1084/jem.157.2.667. [DOI] [PMC free article] [PubMed] [Google Scholar]
- 2.Huang J, Makker SP. Role of receptor-associated 39/45 kD protein in active Heymann nephritis. Kidney Int. 1995;47:432–41. doi: 10.1038/ki.1995.56. [DOI] [PubMed] [Google Scholar]
- 3.Heymann W, Hackel DB, Harwood S, Wilson SG, Hunter J. Production of nephrotic syndrome in rats by Freund's adjuvants and rat kidney suspensions. Proc Exp Biol Med. 1959;100:660–4. doi: 10.3181/00379727-100-24736. [DOI] [PubMed] [Google Scholar]
- 4.Salant DJ, Quigg RJ, Cybulsky AV. Heymann nephritis: mechanism of renal injury. Kidney Int. 1989;35:976–84. doi: 10.1038/ki.1989.81. [DOI] [PubMed] [Google Scholar]
- 5.Edgington TS, Glassock RJ, Watson JI, Dixon FJ. Characterization and isolation of specific renal tubular epithelial antigens. J Immunol. 1967;99:1199–210. [PubMed] [Google Scholar]
- 6.Edgington TS, Glassock RJ, Dixon FJ. Autologous immune complex nephritis induced with renal tubular antigen. I. Identification and isolation of the pathogenetic antigen. J Exp Med. 1968;127:555–71. doi: 10.1084/jem.127.3.555. [DOI] [PMC free article] [PubMed] [Google Scholar]
- 7.Makker SP. Analysis of glomeruli-eluted Gp330 autoantibodies and of Gp330 antigen of Heymann nephritis. J Immunol. 1993;151:6500–8. [PubMed] [Google Scholar]
- 8.Pietromonaco S, Kerjaschki D, Binder S, Ullrich R, Farquhar MG. Molecular cloning of a cDNA encoding a major pathogenic domain of the Heymann nephritis antigen gp330. Proc Natl Acad Sci USA. 1990;87:1811–5. doi: 10.1073/pnas.87.5.1811. [DOI] [PMC free article] [PubMed] [Google Scholar]
- 9.Kerjaschki D, Ullrich R, Diem K, et al. Identification of a pathogenic epitope involved in initiation of Heymann nephritis. Proc Natl Acad Sci USA. 1992;89:11179–83. doi: 10.1073/pnas.89.23.11179. [DOI] [PMC free article] [PubMed] [Google Scholar]
- 10.Kerjaschki D, Ullrich R, Exner M, Orlando RA, Farquhar MG. Induction of passive Heymann nephritis with antibodies specific for a synthetic peptide derived from the receptor-associated protein. J Exp Med. 1996;183:2007–15. doi: 10.1084/jem.183.5.2007. [DOI] [PMC free article] [PubMed] [Google Scholar]
- 11.Cheng IK, Dorsch SE, Hall BM. The regulation of autoantibody production in Heymann's nephritis by T lymphocyte subsets. Lab Invest. 1988;59:780–8. [PubMed] [Google Scholar]
- 12.Quiza CG, Leenaerts PL, Hall BM. The role of T cells in the mediation of glomerular injury in Heymann's nephritis in the rat. Int Immunol. 1992;4:423–32. doi: 10.1093/intimm/4.4.423. [DOI] [PubMed] [Google Scholar]
- 13.Zhao W, Wegmann KW, Trotter JL, Ueno K, Hickey WF. Identification of an N-terminally acetylated encephalitogenic epitope in myelin proteolipid apoprotein for the Lewis rat. J Immunol. 1994;153:901–9. [PubMed] [Google Scholar]
- 14.Saoudi A, Castedo M, Nochy D, et al. Self-reactive anti-class II T helper type 2 cell lines derived from gold salt-injected rats trigger B cell polyclonal activation and transfer autoimmunity in CD8-depleted normal syngeneic recipients. Eur J Immunol. 1995;25:1972–9. doi: 10.1002/eji.1830250726. [DOI] [PubMed] [Google Scholar]
- 15.Chomcynski P, Sacchi N. Single step method of RNA isolation by acid guanidinium thiocyanate-phenol-chloroform extraction. Anal Biochem. 1987;162:152–9. doi: 10.1006/abio.1987.9999. [DOI] [PubMed] [Google Scholar]
- 16.Gold DP, Vainiene M, Celnik B, et al. Characterization of the immune response to a secondary encephalitogenic epitope of basic protein in Lewis rats. II. Biased T cell receptor V beta expression predominates in spinal cord infiltrating T cells. J Immunol. 1992;148:1712–7. [PubMed] [Google Scholar]
- 17.Wu H, Zhang GY, Clarkson AR, Knight JF. Conserved T-cell receptor beta chain CDR3 sequences in IgA nephropathy biopsies. Kidney Int. 1999;55:109–19. doi: 10.1046/j.1523-1755.1999.00243.x. [DOI] [PubMed] [Google Scholar]
- 18.DiCesare J, Grossman B, Katz E, Picozza E, Ragusa R, Woudenberg T. A high-sensitivity electrochemiluminescence-based detection system for automated PCR product quantitation. Biotechniques. 1993;15:152–7. [PubMed] [Google Scholar]
- 19.Zipris D, Greiner DL, Malkani S, Whalen B, Mordes JP, Rossini AA. Cytokine gene expression in islets and thyroids of BB rats. IFN- gamma and IL-12p40 mRNA increase with age in both diabetic and insulin-treated nondiabetic BB rats. J Immunol. 1996;156:1315–21. [PubMed] [Google Scholar]
- 20.Nielsen PR, Ellgaard L, Etzerodt M, Thogersen HC, Poulsen FM. The solution structure of the N-terminal domain of alpha2-macroglobulin receptor-associated protein. Proc Natl Acad Sci USA. 1997;94:7521–5. doi: 10.1073/pnas.94.14.7521. [DOI] [PMC free article] [PubMed] [Google Scholar]
- 21.Abbas AK, Murphy KM, Sher A. Functional diversity of helper T lymphocytes. Nature. 1996;383:787–93. doi: 10.1038/383787a0. [DOI] [PubMed] [Google Scholar]
- 22.Davis MM, Bjorkman PJ. T-cell antigen receptor genes and T-cell recognition. Nature. 1988;334:395–402. doi: 10.1038/334395a0. [DOI] [PubMed] [Google Scholar]
- 23.Bentley GA, Boulot G, Karjalainen K, Mariuzza RA. Crystal structure of the beta chain of a T cell antigen receptor. Science. 1995;267:1984–7. doi: 10.1126/science.7701320. [DOI] [PubMed] [Google Scholar]
- 24.Jorgensen JL, Esser U, de St Groth BF, Reay PA, Davis MM. Mapping T-cell receptor–peptide contacts by variant peptide immunization of single-chain transgenics. Nature. 1992;355:224–30. doi: 10.1038/355224a0. [DOI] [PubMed] [Google Scholar]
- 25.Currier JR, Deulofeut H, Barron KS, Kehn PJ, Robinson MA. Mitogens, superantigens, and nominal antigens elicit distinctive patterns of TCRB CDR3 diversity. Hum Immunol. 1996;48:39–51. doi: 10.1016/0198-8859(96)00076-6. [DOI] [PubMed] [Google Scholar]