

Abstract
The effects of peroxisome proliferators on the immune system of male C57Bl/6 mice have been investigated. Significant atrophy of the thymus and spleen was observed in animals treated with potent peroxisome proliferators (e.g. perfluorooctanoic acid (PFOA), di(2-ethylhexyl)phthalate (DEHP), Wy-14 643 and nafenopin), whereas the effects of a moderate peroxisome proliferator (i.e. acetylsalicylic acid (ASA)) were relatively weak. The time course of thymic and splenic atrophy caused by PFOA was found to resemble the time course of the increase in liver weight and of peroxisome proliferation. Analysis of the numbers and phenotypes of thymocytes and splenocytes from PFOA-treated mice revealed the following: (i) the numbers of thymocytes and splenocytes were decreased >90% and about 50%, respectively, by PFOA treatment; (ii) although all populations of thymocytes were decreased, the immature CD4+CD8+ population was decreased most dramatically; (iii) the numbers of both T and B cells in the spleen were decreased by PFOA treatment. Analysis of the cell cycle of thymocytes indicated that the thymic atrophy caused by PFOA in mice results, at least in part, from inhibition of thymocyte proliferation. Interestingly, in vitro exposure to PFOA for up to 24 h did not produce analogous effects in either thymocytes or splenocytes. Thus, the thymic and splenic atrophy caused by PFOA appears to involve an indirect pathway.
Keywords: immunology, thymus atrophy, thymocytes, splenocytes, phenotype, peroxisome proliferators, immunotoxicology, mice
Introduction
Peroxisome proliferators constitute a very large family of widespread foreign compounds, including many industrial chemicals (e.g. phthalates and perfluoro fatty acid), agrochemicals (e.g. phenoxyacetic acids) and important clinical drugs (e.g. acetylsalicylic acid (ASA) and hypolipidaemic agents, such as fibrate derivatives). The most extensively characterized effects of peroxisome proliferators on rodents are increases in the number and size of peroxisomes and hypertrophy of the liver, as well as potent up-regulation of hepatic peroxisomal fatty acid β-oxidation. Prolonged treatment of rodents with peroxisome proliferators results in the formation of liver tumours [1–3].
There is an increasing awareness that drugs and other foreign chemicals (e.g. pesticides) can modulate the immune system via direct or indirect mechanisms. Literally hundreds of journal articles and at least 10 books examine, in extensive detail, the immunotoxicity of drugs and environmental agents [4–6]. Peroxisome proliferators have not yet been examined in detail in this respect [7–9].
Alteration in immune function due to exposure to xenobiotics may result in change of an organism's ability to resist infectious disease and tumour cell growth; in hypersensitivity and autoimmune disease; as well as in general and specific organ toxicity. The thymus and spleen both fulfil central functions in the immune system of higher animals. These organs are highly sensitive to damage by xenobiotics and are thus examined routinely in connection with immunotoxicological evaluations [10,11].
We investigate here the effects of different peroxisome prolifetrators, e.g. perfluorooctanoic acid (PFOA), nafenopin (2-methyl-2 (p (1,2,3,4-tetrahydroxy-naphthyl)-phenoxy)proprionic acid), ASA, WY-14643 (4-chloro-6–2,3xylidino)2-pyrimidinyl-thio)acetic acid) and di(2-ethylhexyl)phthalate (DEHP), on the body, liver, spleen and thymus weights; and cellularity and cell phenotypes of the thymus and spleen in male C57Bl/6 mice. Furthermore, the time course of PFOA-induced alterations was characterized. Alterations in the cell cycle of thymocytes and splenocytes after PFOA treatment in vivo and in vitro were also examined. Peroxisome proliferators were found to exert potent effects on both T and B cells in the thymus and spleen.
Materials and methods
Chemicals
PFOA (Aldrich Chemical Company, Steinheim, Germany); ASA (Sigma Chemical Co., St Louis, MO); WY-14643 (Wyeth Laboratory Inc., Philadelphia, PA) and DEHP (Fluka Chemicals AG, Switzerland) were purchased from the sources indicated. Nafenopin was a kind gift from Dr C. A. Brownley (CIBA Pharmaceutical Co., Summit, NJ). The complete medium consisted of RPMI 1640 medium containing 25 mm HEPES buffer with l-glutamine (Life Technologies, Gaithersburg, MD), supplemented with 10% (v/v) fetal bovine serum (FBS; Life Technologies), 1 mm sodium pyruvate (Life Technologies) and 100 U penicillin and 100 μg streptomycin per ml (Life Technologies). The complete PBS consisted of PBS containing 2% FBS and 0·01% NaN3. All other materials and chemicals were obtained from common commercial sources.
Animals and treatment
Male C57B1/6 mice (ALAB, Sollentuna, Sweden) weighing 22–28 g (about 8 weeks old) were housed and treated in steel cages in groups of four. These animals were maintained on a 12-h light/dark cycle at 25°C and given free access to laboratory chow R3 containing 5% fat, 24% protein, and 49% carbohydrate (Astra Ewos AB, Södertälje, Sweden). Peroxisome proliferators were dissolved in 20 ml acetone and mixed with 500 g powdered food in order to prepare a diet containing 0·02% PFOA (w/w), 1% ASA (w/w), 0·125% nafenopinin (w/w), 0·125% WY-14643 (w/w) or 0·2% DEHP (w/w). This chow was dried in a ventilated hood until no smell of acetone was detectable (> 24 h).
For investigation of the effects of different peroxisome proliferators on lymphoid organs (EXP-1), mice received the appropriate diet for 10 days. For examination of the time course (Exp. 2), 0·02% PFOA was administered to animals for 2, 5, 7 or 10 days. In other experiments (Exp. 3), the animals were exposed to 0·02% PFOA for 7 days.
At the end of the feeding period, the mice were killed by ether inhalation to avoid the coagulation of blood. The liver, thymus and spleen were dissected out and weighed. In Exp. 1 and Exp. 2, the organs were homogenized individually at 440 rev/min in ice-cold 0·25 m sucrose using four up-and-down strokes of a Potter-Elvehjem homogenizer. More sucrose solution was then added to give 2 ml homogenate for each spleen and 1 ml homogenate for each thymus. In Exp. 3, the thymus and spleen were dissected out using an aseptic technique.
Preparation of cell suspensions
Thymocytes and splenocytes were isolated from normal and treated mice (Exp. 3) by pressing the thymus or spleen suspended in cold complete medium through a 200-gauge and, subsequently, a 50-gauge steel mesh. Erythrocytes among the splenocytes were lysed with 0·83% NH4Cl–Tris buffer pH 7·6. The remaining, predominantly lymphocyte population was washed three times with cold complete medium and the isolated cells finally resuspended in this same medium.
Treatment of thymocytes and splenocytes with PFOA
Thymocytes or splenocytes (107 cells) from untreated mice were seeded into 25-cm2 tissue flasks. PFOA was dissolved in dimethylsulfoxide (DMSO) to obtain stock solutions of different concentrations and these were diluted in complete medium to obtain 50, 100 or 200 μm PFOA and 0·1% DMSO. The same amount of DMSO alone was added to the medium in the control flasks. The cells were incubated at 37°C for 8 h or 24 h in a humidified atmosphere containing 5% CO2. At the end of the culture period, cells were transferred to test tubes, subjected to three washes with cold complete medium and finally resuspended in this same medium.
Cellularity and cell viability
The cells were counted using a haemocytometer. Cell viability (judging from trypan blue exclusion) was always >90%.
Staining of cellular DNA with propidium iodide
Single-cell suspensions of thymocytes or splenocytes were stained with propidium iodide (PI) as described by Nicoletti and co-workers [12]. Briefly, the cells were washed twice with complete PBS, then fixed in 2 ml 70% ice-cold ethanol with vortexing and thereafter maintained at 4°C for 60 min. Subsequently, one more wash with 1 ml complete PBS and resuspension in 0·5 ml of this same solution were performed. RNase (0·5 ml; 1 mg/ml in PBS) and 1 ml PI (100 μg/ml) were then added and the cells incubated for 20 min at room temperature in the dark. Thereafter, the cells were stored at 4°C in the dark until analysis.
Immunofluorescent staining
Single-cell suspensions of thymocytes or splenocytes (2·0 × 106) suspended in 100 μl cold (4°C) complete medium were incubated in the dark on ice for 20 min with the following MoAbs: FITC-conjugated or Cy-chrome-conjugated anti-mouse CD3; anti-mouse CD4 (L3T4); anti-mouse CD8a (Ly-2); or anti-mouse CD19 (PharMingen, San Diego, CA). For dual-parameter analysis, two MoAbs were present in the same incubation. After two washes with cold complete PBS (containing 2% albumin), all samples were fixed in 2% paraformaldehyde (in PBS) for 20 min on ice. After two further washes in cold complete PBS, the stained cells were analysed by flow cytometry.
Flow cytometric analysis
Cells were analysed using a single laser FACSCalibur cytometer (Becton Dickinson, San Jose, CA) with excitation at 488 nm. The data were collected and analysed employing CellQuest Software. For analysis of cell phenotype markers, the lymphocyte populations were gated on the basis of the forward scatter (FSC) and the side scatter (SSC) signals collected in the linear mode, i.e. aggregates of cells were gated out. The two fluorescent signals were analysed on a logarithmic scale and data are presented as the percentage of the total population exhibiting the fluorescence signal of interest. For cell cycle analysis, the pulse area versus pulse width approach was applied. In this case, doublets and larger aggregates must be gated out from the single population. The data are presented as histograms of cell number versus DNA content. For each sample, 10 000 cells were analysed.
DNA content was assayed fluorimetrically using 4,6-diamidino-2-phenylindole (DAPI) as reagent and salmon sperm DNA as standard [13].
Statistical analysis
Each experimental group contained four animals. Data are presented as means ±s.d. and the results of statistical analysis using Student's t-tests are presented where appropriate.
Results
Selection of the compounds tested, doses and toxicity
The effective, extensively studied peroxisome proliferators which we chose to test in this investigation were administered at the doses normally employed by groups working in this field (for PFOA, see [14]; for a general review [15]). After dietary administration of these peroxisome proliferators to mice for 10 days, none of the animals demonstrated any apparent signs of toxicity (e.g. loss of hair, lethargy, and change in colour or behaviour).
A decrease in body weight was caused by administration of the peroxisome proliferators (Table 1), with no significant decrease in food intake (each mouse consumed about 3 g food/day), in agreement with earlier observations in our laboratory. The peroxisome proliferator-activated receptor α (PPAR α) is the well-known mediator of many of the biological effects of peroxisome proliferators, acting as a transcription factor. Significant body weight loss is observed in wild-type mice fed DEHP; whereas PPAR α-null mice administered this same substance demonstrate no change in body weight [16]. Therefore, the decrease in body weight observed here does not reflect general toxicity. Other experiments presently ongoing in our laboratory indicate that this decrease in body weight is due to very specific loss of adipose tissue (Y. Xie et al., unpublished observations).
Effects of different peroxisome proliferators on the weight and DNA content of thymus, spleen and liver in mice
As expected, when male C57Bl/6 mice received PFOA, ASA, nafenopin, WY-14643 or DEHP at the indicated doses in their diet for 10 days, significant increases in liver weight were observed in all cases (Table 1a). At the same time, significant decreases in the weights of the thymus (Table 1b) and spleen (Table 1c) were produced by the potent peroxisome proliferators (i.e. PFOA, WY-14643, DEHP and nafenopin). Because peroxisome proliferators cause a decrease in the body weight of treated animals, as discussed above, both relative and absolute weights are presented. The weak peroxisome proliferator ASA also caused a significant decrease in the weight of the thymus, but not of the spleen (Table 1b,c). In all cases, the relative DNA content (per mg wet weight) in the thymus decreased, possibly indicating a change in the cell cycle (Table 1b; see also Discussion). In contrast, the relative DNA content of the spleen remained unchanged (Table 1c).
Table 1a.
The effects of peroxisome proliferators on body and liver weights in mice
| Treatment | Body weight (g) | (% of control) | Liver weight (g) | (% of control) | Relative liver weight (g/100 g body weight) | (% of control) | |
|---|---|---|---|---|---|---|---|
| Group 1 | None (control) | 24·5 ± 1·68 | (100) | 1·45 ± 0·14 | (100) | 5·93 ± 0·36 | (100) |
| PFOA | 20·3 ± 0·58** | (83) | 2·84 ± 0·11*** | (196) | 14·0 ± 0·53*** | (236) | |
| Nafenopin | 19·4 ± 0·83** | (79) | 2·51 ± 0·20*** | (173) | 12·9 ± 0·53*** | (217) | |
| Group 2 | None (control) | 27·0 ± 1·16 | (100) | 1·38 ± 0·19 | (100) | 5·07 ± 1·09 | (100) |
| ASA | 25·7 ± 1·47 | (95) | 2·10 ± 0·24** | (152) | 8·16 ± 0·72** | (161) | |
| WY-14643 | 22·8 ± 1·42** | (84) | 3·25 ± 0·31*** | (236) | 14·3 ± 1·46*** | (282) | |
| DEHP | 18·3 ± 1·41*** | (68) | 1·70 ± 0·10* | (123) | 9·24 ± 0·94*** | (182) |
All values are means ±s.d. for four animals.
P < 0·05
P < 0·01
P < 0·001 compared with the control group.
Experimental conditions were as described in Materials and methods.
Table 1b.
The effects of peroxisome proliferators on thymus weight and DNA content in mice
| Treatment | Thymus weight (mg) | (% of control) | Relative thymus weight (mg/g body weight) | (% of control) | Total thymic DNA content (mg) | (% of control) | Relative thymic DNA content (mg/mg wet weight) × 100 | (% of control) | |
|---|---|---|---|---|---|---|---|---|---|
| Group 1 | None (control) | 63·9 ± 3·08 | (100) | 2,62 ± 0·19 | (100) | 1·21 ± 0·24 | (100) | 1·89 ± 0·37 | (100) |
| PFOA | 8·90 ± 1·33*** | (14) | 0·44 ± 0·06*** | (17) | 0·10 ± 0·03*** | (8) | 1·16 ± 0·24* | (61) | |
| Nafenopin | 15·6 ± 4·12*** | (24) | 0·81 ± 0·23*** | (31) | 0·17 ± 0·07*** | (14) | 1·08 ± 0·32* | (57) | |
| Group 2 | None (control) | 60·0 ± 14·0 | (100) | 2·24 ± 0·57 | (100) | 1·21 ± 0·36 | (100) | 2·00 ± 0·32 | (100) |
| ASA | 37·5 ± 9·60* | (63) | 1·47 ± 0·41* | (66) | 0·32 ± 0·05** | (26) | 0·79 ± 0·22*** | (40) | |
| WY-14643 | 30·0 ± 0·00** | (50) | 1·32 ± 0·08* | (59) | 0·29 ± 0·09** | (24) | 1·08 ± 0·17** | (54) | |
| DEHP | 9·00 ± 2·65** | (15) | 0·50 ± 0·19** | (22) | 0·12 ± 0·02** | (10) | 1·34 ± 0·22* | (67) |
All values are means ±s.d. for four animals.
P < 0·05
P < 0·01
P < 0·001 compared with the control group.
Experimental conditions were as described in the Materials and Methods.
Table 1c.
The effects of peroxisome proliferators on spleen weight and DNA content in mice
| Treatment | Spleen weight (mg) | (% of control) | Relative spleen weight (mg/g body weight) | (% of control) | Total splenic DNA content (mg) | (% of control) | Relative splenic DNA content (mg/mg wet weight) × 100 | (% of control) | |
|---|---|---|---|---|---|---|---|---|---|
| Group 1 | None (control) | 80·0 ± 10·0 | (100) | 3·38 ± 0·40 | (100) | 1·99 ± 0·07 | (100) | 2·55 ± 0·29 | (100) |
| PFOA | 52·5 ± 5·00** | (70) | 2·59 ± 0·30* | (77) | 1·01 ± 0·09*** | (51) | 2·09 ± 0·15 | (82) | |
| Nafenopin | 37·0 ± 6·06*** | (49) | 1·89 ± 0·30*** | (56) | 0·77 ± 0·10*** | (39) | 2·10 ± 0·22 | (82) | |
| Group 2 | None (control) | 85·0 ± 5·77 | (100) | 3·16 ± 0·30 | (100) | 2·08 ± 0·06 | (100) | 2·45 ± 0·15 | (100) |
| ASA | 90·0 ± 11·6 | (106) | 3·49 ± 0·25 | (110) | 2·12 ± 0·20 | (102) | 2·49 ± 0·37 | (102) | |
| WY-14 643 | 57·5 ± 5·00*** | (68) | 2·53 ± 0·26* | (80) | 1·42 ± 0·18*** | (68) | 2·37 ± 0·09 | (97) | |
| DEHP | 30·0 ± 10·0*** | (35) | 1·62 ± 0·43** | (51) | 0·79 ± 0·11*** | (38) | 2·76 ± 0·65 | (113) |
All values are means ±s.d. for four animals.
P < 0·05
P < 0·01
P < 0·001 compared with the control group.
Experimental conditions were as described in the Materials and Methods.
Time course of thymic and splenic atrophy following PFOA administration
In order to elucidate how peroxisome proliferators impair these vital organs of the immune system, the highly potent and largely metabolically inert peroxisome proliferator PFOA was chosen for further study. Upon administration of 0·02% PFOA for 2, 5, 7 or 10 days, a significant increase in liver weight was observed even at the earliest time point (Table 2 and Fig. 1). Subsequently, significant and rapid decreases in thymus and spleen weights were detected (Table 2 and Fig. 1).
Table 4.
Effects of perfluorooctanoic acid (PFOA) on the cell cycle of thymocytes and splenocytes
| Organs | Treatment | G1/2 phase | (%) | G0/G1 phase | (%) | S phase | (%) | G2/M phase | (%) |
|---|---|---|---|---|---|---|---|---|---|
| Thymus | None (control) | 0·45 ± 0·12 | (100) | 86·0 ± 1·56 | (100) | 2·66 ± 0·42 | (100) | 10·6 ± 1·20 | (100) |
| PFOA | 1·78 ± 0·43*** | (395) | 92·3 ± 0·73*** | (107) | 0·61 ± 0·26*** | (23) | 5·25 ± 0·89*** | (50) | |
| Spleen | None (control) | 0·21 ± 0·02 | (100) | 90·5 ± 1·85 | (100) | 0·48 ± 0·02 | (100) | 8·76 ± 1·83 | (100) |
| PFOA | 0·21 ± 0·12 | (100) | 89·3 ± 1·28 | (99) | 0·32 ± 0·07** | (67) | 10·1 ± 1·36 | (115) |
All values (given as arbitrary units of fluorescence) are means ±s.d. for four animals.
P < 0·05
P < 0·01
P < 0·001 compared with the control group.
Experimental conditions were as described in Materials and methods.
Fig. 1.
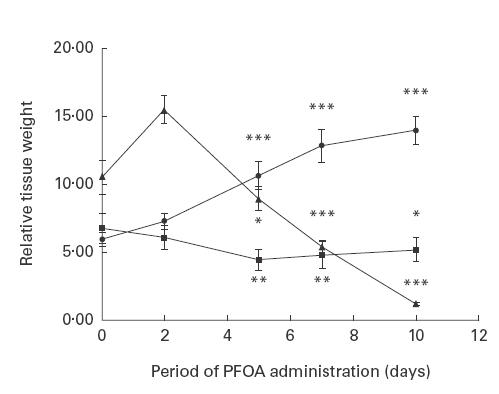
Time course of the changes in relative liver (•), thymus (▴) and spleen (▪) weights during perfluorooctanoic acid (PFOA) treatment. The results shown are means ±s.d. of four separate experiments (see further Table 2). *P < 0·05; **P < 0·01; ***P < 0·001 compared with the control group.
Effect of PFOA administration on the cellularity and cell surface phenotype of thymocytes and splenocytes
After administration of 0·02% PFOA to mice for 7 days, thymocytes and splenocytes were isolated. Significant decreases (by approximately 85% and 80%, respectively) in the total number of thymocytes and splenocytes were observed (Table 3). However, in the case of the spleen, the decreases in DNA content were much smaller than these decreases in cell number (Tables 1b,c).
Table 3.
Effects of perfluorooctanoic acid (PFOA) on the cellularity and cell surface phenotype of thymocytes and splenocytes
| Control mice Cell number | PFOA-treated mice Cell number | |||||
|---|---|---|---|---|---|---|
| Organs | Phenotype | (× 106) | (% of total) | (× 106) | (% of control) | (% of total) |
| Thymus | Total | 67·0 ± 16·5 | 9·47 ± 1·43*** | (14) | ||
| CD4−CD8− | 4·85 ± 0·86 | 7·34 ± 1·70 | 2·11 ± 1·12** | (44) | 21·9 ± 9·92* | |
| CD4+CD8+ | 47·2 ± 12·5 | 70·2 ± 1·47 | 2·40 ± 0·92*** | (5) | 26·3 ± 11·7*** | |
| CD4+ | 9·52 ± 1·82 | 14·4 ± 0·83 | 3·41 ± 0·97*** | (36) | 35·9 ± 6·51*** | |
| CD8+ | 5·44 ± 1·31 | 8·12 ± 0·19 | 1·52 ± 0·37*** | (28) | 16·0 ± 1·96*** | |
| Spleen | Total | 122 ± 5·91 | 23·9 ± 0·82*** | (20) | ||
| CD3+ | 50·5 ± 3·63 | 41·2 ± 2·26 | 12·4 ± 1·07*** | (25) | 52·0 ± 6·61* | |
| CD4+ | 32·2 ± 1·98 | 26·3 ± 1·21 | 7·12 ± 1·06*** | (22) | 30·0 ± 4·55*** | |
| CD8+ | 15·8 ± 0·94 | 12·9 ± 0·36 | 4·06 ± 0·28*** | (26) | 17·1 ± 0·86*** | |
| CD19+ | 41·6 ± 6·23 | 34·0 ± 5·42 | 5·67 ± 0·80** | (14) | 23·6 ± 2·90* | |
All values are means ±s.d. for three animals.
P < 0·05
P < 0·01
P < 0·001 compared with the control group. Experimental conditions were as described in Materials and methods.
In order to determine whether PFOA selectively affects immature or mature thymocytes in the thymus and mature T or B cells in the spleen, we examined CD4+ and CD8+ expression by the former cells and CD3+ and CD19+ expression by the latter, employing a two-colour flow cytometric technique. The results, quantified in Table 3, reveal that PFOA dramatically altered the phenotypic distribution of thymocytes: the number of cells expressing CD4 and CD8 decreased by 95%; the number of cells expressing neither of these antigens decreased by 57%; and the number of cells expressing only CD4 or CD8 decreased by 64% and 72%, respectively.
In the case of splenocytes (also documented in Table 3), there were decreases in the number of T cells (CD3) by 75% and in B cells (CD19) by 86% upon PFOA treatment. In conjunction with the decrease in T cells, significant decreases in both T-helper (CD4+, −78%) and T-cytotoxic (CD8+, −74%) cells were observed.
Effects of PFOA administration on the cell cycle of thymocytes and splenocytes in vivo
In order to determine whether thymic and/or splenic atrophy reflects a decrease in the percentage of cells undergoing DNA synthesis, we examined the cell cycle in thymocytes and splenocytes using a flow cytometric technique based on binding of the dye PI to DNA. This approach allowed us to measure the percentage of the cells that were in the G0/G1, S and G2/M stages of the cell cycle. Upon administration of PFOA to mice for 7 days, significant decreases in the proportion of thymocytes in the S and G2/M phases (77% and 50%, respectively) and significant increases in the sub G0 region (G1/2, 300%) and in the G0/G1 phases were observed (illustrated in Fig. 2 and quantified in Table 4). This indicated that thymocyte proliferation was inhibited by PFOA treatment. In contrast, the only change in the case of splenocytes was a significant decrease in the proportion of the cells in the S phase (Table 4).
Fig. 2.
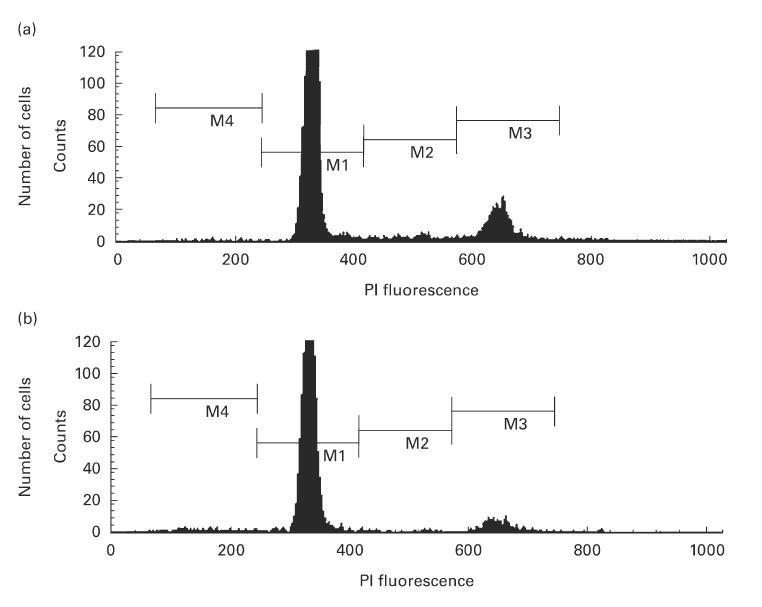
Distribution of the DNA content in thymocytes and splenocytes from untreated (a) and perfluorooctanoic acid (PFOA)-treated (b) mice. The cells were stained with propidium iodide (PI). In these frequency histograms: M4, cells with a content of DNA less than that seen in normal cells during the G0/G1 phase; M1, cells in the G0/G1 phase; M3, cells in the G2/M phase; M2, this region between the second and the third peaks contains cells in S phase. Experimental conditions were as described in Materials and methods. The results shown are representative of the four independent experiments quantified in Table 4.
Effects of exposure of thymocytes and splenocytes to PFOA in vitro
In order to examine possible mechanisms by which PFOA might cause thymus and spleen atrophy, thymocytes or splenocytes (isolated from non-treated animals) were cultured in vitro with varying concentrations of PFOA (50, 100 or 200 μm) for different periods of time (8 h or 24 h). Subsequently, cell cycle analysis by flow cytometry as described above was performed. The area of the sub G0 region, containing cells with subdiploid DNA (G1/2 phase), was employed as a measure of apoptotic cells [12]. Figure 3a,b clearly illustrates spontaneous apoptosis (an increase in the G1/2 phase) in both thymocytes and splenocytes after 8 h or 24 h of culturing. However, PFOA did not significantly alter the cell cycle or apoptosis under these conditions.
Fig. 3.
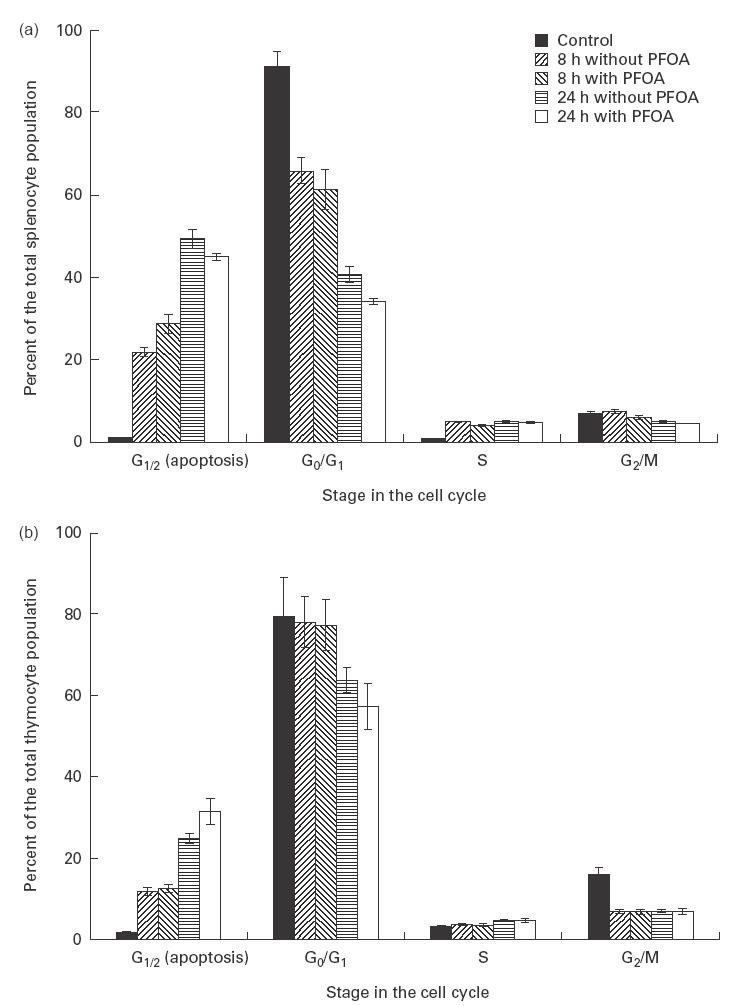
Cell cycle analysis (based on DNA content) of thymocytes (a) and splenocytes (b) isolated from untreated mice and exposed to perfluorooctanoic acid (PFOA) in vitro. The cells were exposed to different concentrations of PFOA for 8 h or 24 h and subsequently stained with propidium iodide. The results shown are means ±s.d. (bars) of four independent experiments.
Discussion
In the present study, pronounced atrophy of the thymus and spleen of mice was caused by treatment with the potent peroxisome proliferators PFOA, nafenopin, Wy-14643, and DEHP, whereas the weak peroxisome proliferator ASA caused atrophy of the thymus only (Table 1b,c). PFOA is a representative of the perfluorinated carboxylic acids used as commercial wetting agents and flame-retardants. This compound is considered to be relatively inert, even metabolically [17]. Furthermore, we have been characterizing the effects of PFOA on rodent and human cells for almost a decade [18,19]. Thus, we chose this peroxisome proliferator for further investigation of the possible mechanism(s) underlying this organ atrophy observed in mice.
Table 2.
Time course of the effects of perfluorooctanoic acid (PFOA) on body, liver, thymus and spleen weights and on thymic and splenic DNA contents in mice
| Period of treatment (days) | Body weight (g) | Liver weight (g) | Thymus weight (mg) | Total thymic DNA content (mg) | Spleen weight (mg) | Total splenic DNA content (mg) |
|---|---|---|---|---|---|---|
| None (control) | 24·5 ± 1·68 | 1·45 ± 0·14 | 63·9 ± 3·08 | 1·21 ± 0·25 | 82·5 ± 9·57 | 1·99 ± 0·07 |
| (100) | (100) | (100) | (100) | (100) | (100) | |
| 2 | 23·4 ± 0·21 | 1·70 ± 0·07* | 72·5 ± 15·8 | 1·31 ± 0·27 | 71·0 ± 5·48 | 1·80 ± 0·08* |
| (96) | (117) | (113) | (108) | (86) | (90) | |
| 5 | 20·3 ± 1·21** | 2·15 ± 0·36* | 36·0 ± 9·80** | 0·58 ± 0·15** | 44·3 ± 8·02*** | 1·01 ± 0·24*** |
| (83) | (148) | (56) | (48) | (54) | (51) | |
| 7 | 21·0 ± 0·74** | 2·70 ± 0·15*** | 22·5 ± 3·00*** | 0·28 ± 0·05*** | 50·0 ± 0·00*** | 1·18 ± 0·06*** |
| (86) | (186) | (35) | (23) | (61) | (59) | |
| 10 | 20·3 ± 0·58** | 2·84 ± 0·11*** | 8·90 ± 1·30*** | 0·10 ± 0·03*** | 52·5 ± 5·00*** | 1·01 ± 0·09*** |
| (83) | (196) | (14) | (8) | (64) | (51) |
All values are means ±s.d. for four animals. The data in parentheses represent the percentage of changes compared with the control group.
P < 0·05
P < 0·01
P < 0·001.
Experimental conditions were as described in Materials and methods.
Determination of the time course revealed that the increase in liver weight and decrease in spleen weight are parallel processes. After an initial delay (perhaps even involving an increase in organ weight), the thymus atrophies with a similar time course (Fig. 1). The time course observed here resembles the time course of peroxisome proliferation and up-regulation of related enzymes in mouse liver in response to PFOA treatment (unpublished observations).
Stem cells produced in the bone marrow enter the bloodstream and are transported to the thymus. In the earliest stage, these cells express neither CD4 nor CD8, then they differentiate to become CD4+/CD8+ thymocytes. These double-positive cells then undergo a rigorous process of selection. Cells that survive this process down-regulate either their CD4 or CD8 molecules to become single-positive cells, which are then released into the periphery. These are immunocompetent T cells, capable of recognizing foreign antigens presented by cell surface molecules of the MHC [20].
The numbers of thymocytes and splenocytes in mice are decreased by PFOA treatment. However, in contrast to thymocytes, the decrease in splenocyte number caused by PFOA treatment was greater than the decrease in spleen wet weight. This may reflect primarily a loss of splenocytes, rather than of organ matrix. The phenotypic analysis of thymocytes demonstrated that although all populations of thymocytes are decreased in number, the immature CD4+CD8+ population is affected most. This may reflect impaired thymocyte maturation from CD4−CD8− to CD4+CD8+ cells. Phenotypic analysis of splenocytes revealed that the total number of B cells, as well as the proportion of the total splenocyte population which consists of this cell type, are decreased by treatment of mice with PFOA. This finding indicates that B cell maturation and/or differentiation in the bone marrow may also be inhibited.
The cell cycle analysis performed here demonstrates that PFOA causes arrest of thymocytes in vivo in the G0/G1 phase, with significant decreases in the percentages of these cells present in the S and G2/M phases. This indicates inhibition of thymocyte proliferation. The larger decrease in the total DNA content of the thymus than in the wet weight of this organ caused by PFOA may be explained by this decrease in the S and G2/M populations.
Many foreign compounds have previously been shown to affect thymic development in rodents (for a general review, see [21]). Some of these agents appear to interact directly with the thymus and affect either thymocytes or thymic epithelial cells, while other agents appear to have indirect and/or poorly defined effects by diverse mechanisms, including alterations in bone marrow-derived thymocyte precursors [22–25]. Several reports suggest that the thymic atrophy caused by certain of these chemicals involves increased production of glucocorticoids, which deplete the thymic cortex of immature cells (reviewed in [26]).
Interestingly in this context, exposure of cultures of thymocytes or splenocytes (isolated from untreated mice) to PFOA in vitro did not produce analogous effects. Thus, thymic and splenic atrophy caused by PFOA appears to involve an indirect pathway.
It is now well established that a family of nuclear receptors, designated peroxisome proliferator-activated receptors (PPARs), mediates many, if not all, of the adaptive responses to exposure to PP [3]. The primary functions of PPARs can be deduced from the nature of their target genes; the ones known to date encode proteins involved in lipid transport and metabolism, e.g. fatty acid uptake across membranes, fatty acid binding in cells, fatty acid oxidation and lipoprotein assembly and transport [1]. Consequently, PPs may affect the immune system indirectly through alteration of fatty acid transport and/or metabolism.
There are a number of cases known where toxicants alter the numbers of immune cells, but do not alter immunological function. However, it has been reported that treatment with peroxisome proliferators can alter the immune response in rats. For example, perfluorodecanoic acid (PFDA) treatment significantly decreases keyhole limpet haemocyanim-specific IgG2a production and lessens the DTH response [9]. Furthermore, dioctyl phthalate causes a significant depression of mitogenesis in T lymphocytes and, to an even greater extent, in B lymphocytes [7].
Indeed, both α and γ isoforms of the PPAR have been reported to be involved in regulation of inflammatory processes. PPAR α is expressed predominantly by the liver and controls the duration of an inflammatory response and the clearance of leukotriene B4 (a potent chemotactic agent that initiates, co-ordinates, sustains and amplifies the inflammatory response) by the liver [27]. In contrast, PPAR γ is expressed predominantly in adipose tissue and the immune system [28] and γ seems to exert an anti-inflammatory effect [29,30].
In conclusion, potent peroxisome proliferators cause severe thymic and splenic atrophy in mice. The possible impairment of circulating lymphocytes and/or of functional lymphocyte responses to foreign antigens is now under investigation in our laboratory. Standard histological analyses, together with immunohistochemistry and electron microscopic examination of the thymus and spleen of mice exposed to PPs, are presently being performed. Furthermore, the molecular mechanism(s) underlying the ability of peroxisome proliferators to cause immunosuppression in rodents will be examined. Such studies may help elucidate a new mechanism by which non-genotoxic compounds such as peroxisome proliferators cause tumours.
Acknowledgments
The Knut and Alice Wallenberg Foundation (Stockholm) and the Environmental Fund of the Swedish Association of Graduate Engineers (Stockholm) have supported this study. We are grateful to Jarl Olsson for help with the animals. We also thank Professor G. Möller and Dr M. Abedi-Valugerdi for their stimulating discussion and critical reading of the manuscript.
References
- 1.Gonzalez FJ, Peters JM, Cattley RC. Mechanism of action of the nongenotoxic peroxisome proliferators: role of the peroxisome proliferator-activator receptor alpha. J Natl Cancer Inst. 1998;90:1702–9. doi: 10.1093/jnci/90.22.1702. [DOI] [PubMed] [Google Scholar]
- 2.Cattley RC, DeLuca J, Elcombe C, et al. Do peroxisome proliferating compounds pose a hepatocarcinogenic hazard to humans? Regul Toxicol Pharmacol. 1998;27:47–60. doi: 10.1006/rtph.1997.1163. [DOI] [PubMed] [Google Scholar]
- 3.Gelman L, Fruchart JC, Auwerx J. An update on the mechanisms of action of the peroxisome proliferator-activated receptors (PPARs) and their roles in inflammation and cancer. Cell Mol Life Sci. 1999;55:932–43. doi: 10.1007/s000180050345. [DOI] [PMC free article] [PubMed] [Google Scholar]
- 4.Luster MI, Rosenthal GJ. Chemical agents and the immune response. Environ Health Perspect. 1993;100:219–26. doi: 10.1289/ehp.93100219. [DOI] [PMC free article] [PubMed] [Google Scholar]
- 5.Voccia I, Blakley B, Brousseau P, Fournier M. Immunotoxicity of pesticides: a review. Toxicol Ind Health. 1999;15:119–32. doi: 10.1177/074823379901500110. [DOI] [PubMed] [Google Scholar]
- 6.Descotes J. An introduction to immunotoxicology. 1. London: Taylor & Francis Ltd; 1999. [Google Scholar]
- 7.Dogra RK, Khanna S, Nagale SL, et al. Effect of dioctyl phthalate on immune system of rat. Indian J Exp Biol. 1985;23:315–9. [PubMed] [Google Scholar]
- 8.Harris MW, Uraih LC, Birnbaum LS. Acute toxicity of perfluorodecanoic acid in C57BL/6 mice differs from 2,3,7,8-tetrachlorodibenzo-p-dioxin. Fundam Appl Toxicol. 1989;13:723–36. doi: 10.1016/0272-0590(89)90330-8. [DOI] [PubMed] [Google Scholar]
- 9.Nelson DL, Frazier DE, Ericson JE, et al. The effects of perfluorodecanoic acid (PFDA) on humoral, cellular, and innate immunity in Fischer 344 rats. Immunopharmacol Immunotoxicol. 1992;14:925–38. doi: 10.3109/08923979209009242. [DOI] [PubMed] [Google Scholar]
- 10.Van Loveren H, Steerenberg PA, Vos JG. Early detection of immunotoxicity: from animal studies to human biomonitoring. Toxicol Lett. 1995;77:73–80. doi: 10.1016/s0378-4274(97)84688-7. [DOI] [PubMed] [Google Scholar]
- 11.Karol MH. Target organs and systems: methodologies to assess immune system function. Environ Health Perspect. 1998;106(Suppl. 2):533–40. doi: 10.1289/ehp.98106533. [DOI] [PMC free article] [PubMed] [Google Scholar]
- 12.Nicoletti I, Migliorati G, Pagliacci MC, et al. A rapid and simple method for measuring thymocyte apoptosis by propidium iodide staining and flow cytometry. J Immunol Methods. 1991;139:271–9. doi: 10.1016/0022-1759(91)90198-o. [DOI] [PubMed] [Google Scholar]
- 13.Shapira L, Takashiba S, Kalmar JR, et al. Rapid fluorometric quantification of monocyte attachment in tissue culture wells. J Immunol Methods. 1993;165:93–98. doi: 10.1016/0022-1759(93)90110-s. [DOI] [PubMed] [Google Scholar]
- 14.Ikeda T, Aiba K, Fukuda K, Tanaka M. The induction of peroxisome proliferation in rat liver by perfluorinated fatty acids, metabolically inert derivatives of fatty acids. J Biochem (Tokyo) 1985;98:475–82. doi: 10.1093/oxfordjournals.jbchem.a135302. [DOI] [PubMed] [Google Scholar]
- 15.DePierre JW, Sohlenius AK, Eriksson AM, et al. Responses of epoxide hydrolases, glutathione S-transferase, DT-diaphorase and catalase in mouse liver to treatment with peroxisome proliferators. In: Moody DE, editor. Peroxisome proliferators: unique inducers of drug-metabolizing enzymes. Boca Raton, Florida: CRC Press Inc; 1994. pp. 123–36. [Google Scholar]
- 16.Ward JM, Peters JM, Perella CM, Gonzalez FJ. Receptor and nonreceptor-mediated organ-specific toxicity of di(2-ethylhexyl) phthalate (DEHP) in peroxisome proliferator-activated receptor alpha-null mice. Toxicol Pathol. 1998;26:240–6. doi: 10.1177/019262339802600208. [DOI] [PubMed] [Google Scholar]
- 17.Vanden Heuvel JP, Kuslikis BI, Van Rafelghem MJ, Peterson RE. Disposition of perfluorodecanoic acid in male and female rats. Toxicol Appl Pharmacol. 1991;107:450–9. doi: 10.1016/0041-008x(91)90308-2. [DOI] [PubMed] [Google Scholar]
- 18.Sohlenius AK, Lundgren B, DePierre JW. Perfluorooctanoic acid has persistent effects on peroxisome proliferation and related parameters in mouse liver. J Biochem Toxicol. 1992;7:205–12. doi: 10.1002/jbt.2570070403. [DOI] [PubMed] [Google Scholar]
- 19.Shabalina IG, Panaretakis T, DePierre JW. Effects of the rodent peroxisome proliferator and hepatocarcinogen perfluorooctanoic acid on the cell cycle and apoptosis in human hepatoma HepG2 cells. Carcinogenesis. 1999 doi: 10.1093/carcin/20.12.2237. in press. [DOI] [PubMed] [Google Scholar]
- 20.Janeway CA, Travers P, Walport M, Capra JD. Immunobiology: the immune system in health and disease. 4. New York: Garland Publishing; 1999. [Google Scholar]
- 21.Schuurman HJ, Van Loveren H, Rozing J, Vos JG. Chemicals trophic for the thymus: risk for immunodeficiency and autoimmunity. Int J Immunopharmacol. 1992;14:369–75. doi: 10.1016/0192-0561(92)90166-i. [DOI] [PubMed] [Google Scholar]
- 22.Greenlee WF, Dold KM, Irons RD, Osborne R. Evidence for direct action of 2,3,7,8-tetrachlorodibenzo-p-dioxin (TCDD) on thymic epithelium. Toxicol Appl Pharmacol. 1985;79:112–20. doi: 10.1016/0041-008x(85)90373-4. [DOI] [PubMed] [Google Scholar]
- 23.Blaylock BL, Holladay SD, Comment CE, et al. Exposure to tetrachlorodibenzo-p-dioxin (TCDD) alters fetal thymocyte maturation. Toxicol Appl Pharmacol. 1992;112:207–13. doi: 10.1016/0041-008x(92)90189-y. [DOI] [PubMed] [Google Scholar]
- 24.Comment CE, Blaylock BL, Germolec DR, et al. Thymocyte injury after in vitro chemical exposure: potential mechanisms for thymic atrophy. J Pharmacol Exp Ther. 1992;262:1267–73. [PubMed] [Google Scholar]
- 25.McConkey DJ, Jondal M, Orrenius S. The regulation of apoptosis in thymocytes. Biochem Soc Trans. 1994;22:606–10. doi: 10.1042/bst0220606. [DOI] [PubMed] [Google Scholar]
- 26.Pruett SB, Ensley DK, Crittenden PL. The role of chemical-induced stress responses in immunosuppression: a review of quantitative associations and cause-effect relationships between chemical-induced stress responses and immunosuppression. J Toxicol Environ Health. 1993;39:163–92. doi: 10.1080/15287399309531744. [DOI] [PubMed] [Google Scholar]
- 27.Devchand PR, Keller H, Peters JM, et al. The PPARalpha-leukotriene B4 pathway to inflammation control. Nature. 1996;384:39–43. doi: 10.1038/384039a0. [DOI] [PubMed] [Google Scholar]
- 28.Braissant O, Foufelle F, Scotto C, et al. Differential expression of peroxisome proliferator-activated receptors (PPARs): tissue distribution of PPAR-alpha-beta, and -gamma in the adult rat. Endocrinology. 1996;137:354–66. doi: 10.1210/endo.137.1.8536636. [DOI] [PubMed] [Google Scholar]
- 29.Ricote M, Li AC, Willson TM, et al. The peroxisome proliferator-activated receptor gamma is a negative regulator of macrophage activation. Nature. 1998;391:79–82. doi: 10.1038/34178. [DOI] [PubMed] [Google Scholar]
- 30.Jiang C, Ting AT, Seed B. PPAR-gamma agonists inhibit production of monocyte inflammatory cytokines. Nature. 1998;391:82–86. doi: 10.1038/34184. [DOI] [PubMed] [Google Scholar]