

Abstract
Individuals differ not only in the ability to make decisions, but also in the degree to which they respond adaptively to uncertainty about those decisions. We examined how optimally 124 participants used an uncertain response on near-threshold trials of a psychophysical task. All participants showed overconfidence, but women tended to be more adaptive than men in responsiveness to uncertainty. Participants who responded to uncertainty most optimally exhibited more cognitive failures, fewer attention deficit and hyperactivity disorder symptoms, greater need for closure, better attention scanning skills, but larger effects of Stroop-task incongruity compared with participants who were least optimal in responsiveness to uncertainty. These data suggest that response competition might provide a mechanism for the cognitive experience of uncertainty.
Keywords: attention, gender differences, monitoring, personality, uncertainty
A PHYSICIAN EXAMINES an array of medical records. She is your physician. They are your records. Test results, symptom descriptions, X-rays, and other data provide conflicting and ambiguous clues about your physical health. Medical references and journal articles supply information on a host of candidate diseases and treatment options. Perhaps everything is fine and your illness is minor—but perhaps not.
At times like these, you want your physician to be the best diagnostician available. You need someone who is highly skilled at discriminating between tumor and shadow, between test results that suggest a serious disorder and those that indicate a transient condition, between a health issue that requires immediate treatment and one that lacks urgency. But what other cognitive attributes might you value in your physician at times like this? Is your physician one who, when in doubt, will rely on intuition and make a best guess? Will she order more tests, consult a colleague for a second opinion, and research the symptoms further? Will your physician recognize when she doesn’t really know what to diagnose? How will she respond to this lack of confidence? That is, is it important that your physician not only be skilled in diagnosis, but also someone who responds adaptively to her own uncertainty?
Although few people are faced with the kinds of life-or-death decisions that are referenced in this example, the general situation is clearly not unique to physicians. Everyone makes decisions, sometimes with substantial uncertainty. Can I safely merge into traffic at this time? Is this a good investment? Which of two applicants should I hire? Each decision could be easy and obvious, or could be difficult and confusing, depending on conditions. Further, decisions that are easy for some people may be challenging for others. Individuals differ in their ability to make decisions under given circumstances. A financial analyst may be able to identify winning investments from a host of options that would confuse novices, just as the skilled diagnostician will distinguish medical conditions that might be indiscriminable to a less experienced physician. However, even the expert decision maker in a particular domain will periodically face conditions that lead to uncertainty. The present investigation was designed to examine how people respond to such uncertainty. Do people tend to guess and to take their chances, or do they perceive their uncertainty and respond by seeking more information or by choosing not to make a decision—and, more broadly, what is meant by individual differences in characteristic responsiveness to uncertainty?
The literature is replete with studies about uncertainty, including demonstrations of the general state of poor calibration that exists between confidence and accuracy (e.g., Griffin & Tversky, 2002; Keren, 1991; Liberman, 2004; McClelland & Bolger, 1994; West & Stanovich, 1997); explicit studies of metacognitive judgments, such as feelings of knowing (e.g., Bless & Forgas, 2000; Brown, 1991; Nelson, 1984); and many general examinations of the nature of decision making under conditions of uncertainty, including those for which Kahneman received the Nobel Prize for economics in 2002 (Tversky & Kahneman, 1974; see also Blackwood et al., 2004; Pitz & Sachs, 1984; Tversky & Fox, 1995). Few researchers, however, have systematically examined individual differences in how people cope with or respond to uncertainty itself. Some, principally Sorrentino and colleagues, have considered orientation toward uncertainty as a trait-like disposition and have compared questionnaire-based groups that are oriented toward discovery and uncertainty with those that prefer knowledge and certainty (e.g., Brouwers, Sorrentino, Roney, & Hanna, 2004; Shuper, Sorrentino, Otsubo, Hodson, & Walker, 2004; Sorrentino & Roney, 2000). People who score highly on certainty-orientation will disengage passively from uncertain situations, whereas uncertainty-oriented individuals are thought to be happy and energized to act (e.g., to seek out information) in uncertain situations. However, these self-reported preferences do not really address individual differences in the degree to which people monitor and respond adaptively to uncertainty.
In contrast, Smith and colleagues have demonstrated empirically that individuals differ in responsiveness to uncertainty, even when that uncertainty is determined empirically (versus being based on self report) and matched across individuals (for a review of these studies, see Smith, Shields, & Washburn, 2003). Psychophysical paradigms were used to bring each participant to a region of uncertainty within which the participant did not know how to respond (i.e., the participant was equally likely to respond correctly or incorrectly). In one study, participants were required to judge whether a box of illuminated pixels on a computer screen contained a target density of dots. If the box contained exactly 2,950 pixels, one response (“target present”) was required, but any fewer than 2,950 pixels required a second (“target absent”) response. Across trials, the number of illuminated dots was titrated so as to approach the threshold region in which individual participants could no longer reliably judge that difference from 2,950. Some participants were relatively good at this discrimination (perhaps able to determine reliably that 2,700 pixels was fewer than the target value), whereas other participants were less skilled in this primary discrimination (perhaps unable to discriminate between 2,700 and 2,950 pixels). In each case, however, the task gradually brought each participant to an empirically defined and equivalent objective state of uncertainty in which the participant did not know how to respond.
What makes this paradigm particularly well suited for studying metacognition is the presence of a third response option available on every trial. Participants can use this third response option (here, interchangeably called the “escape” option, in that it allows participants to escape the risk of error; the “uncertain” response; or the “star response,” because participants touch a star on the screen to select this option) to be told the answer on any trial. Thus, participants can avoid ever making an error by responding on the primary discrimination for any trial in which they are absolutely confident, and by choosing this third response option on any trial in which they are at all uncertain. Selection of the uncertain response does have some time cost (it takes longer to make two responses—uncertain response and then the correct answer—than simply to select the correct answer), and the time penalty is potentially greater with extensive overuse of the uncertain response. Notwithstanding, the option is available any time it is needed.
Smith and colleagues (Smith et al., 2003) reported that the participants tended to respond on this task in exactly the fashion described above. That is, they tended to respond by using the primary discrimination response options when the trials were easy, but the escape response was used precisely in that region of trials around the discrimination threshold, the region in which we know empirically from participants’ performance that they are uncertain. Thus, it seems that people monitor their level of confidence and respond adaptively (by escaping near-threshold trials) to uncertainty.
Although no one uses the uncertain option as often as he or she should (i.e., people sometimes guess and make errors when they could—and when their performance suggests that they should—escape and avoid errors). When they do use the uncertain response, they do so at the appropriate place in the continuum of decision space. People seldom escape trials on which their performance suggests that they are confident about the answer. Within the range of demonstrable uncertainty, however, people vary widely in how readily they use this third response option, with some individuals seldom acknowledging their uncertainty but others using the uncertain response more adaptively to avoid errors.
The general question that motivated the present investigation is, “What do these individual differences in adaptive use of an uncertain response mean?” In particular, we examined whether individual differences in responsiveness to uncertainty relate to individual differences in personality, disposition, and cognitive ability. It seems reasonable to suggest that the tendency to monitor and to respond adaptively to their uncertainty may also be reflected in temperament measures of one’s conscientiousness and intellect, as well as in self-reflective scores on tests of information- or stimulation-seeking, metacognitive ability, and attention skills. We anticipated that these correlations would reveal the general traits associated with adaptive responding to uncertainty and perhaps also provide insight into the cognitive underpinnings of subjective uncertainty.
Method
Participants
Undergraduate students (N = 124; M age = 20.9 years; 62 women and 62 men) volunteered to participate in this study in exchange for research-participation credit. The experiment required approximately 60 min to complete.
Tasks and Procedure
Each participant was individually tested using a Pentium-class personal computer on a computerized battery of tasks. The students used the mouse or computer keyboard to respond to stimuli presented on a 17-in. monitor. Computerized versions of the Goldberg Adjective Checklist Personality Assessment (Goldberg, 1992), the Need for Cognition Scale (Cacioppo & Petty, 1982), the Personal Need for Closure Scale (Webster & Kruglanski, 1994), the Personal Need for Structure Scale (Thompson, Naccarato, Parker, & Moskowitz, 2001; see also Neuberg & Newsome, 1993), and the Fear of Invalidity Scale (Neuberg, Judice, & West, 1997) were written and administered. Each was programmed following the procedure for the paper-and-pencil versions, but each required participants to click an answer (e.g., “strongly agree”) to respond to survey items. These instruments were selected to reflect a range of personality and temperament variables that might be related to metacognitive dispositions. The adjective checklist, for example, provides a measure of the five basic personality dimensions that have been identified in numerous psychometric studies (the Big Five): Surgency (extroversion/introversion), Conscientiousness, Emotional Stability (neuroticism), Intellect, and Agreeableness (see Goldberg). The other scales each tapped different aspects of individuals’ preference for cognitive stimulation, for closure and certainty, for simple structure and clarity, as well as individual differences in aversion toward ambiguity and error.
To assess individual differences in responsiveness to uncertainty, we used a 16-min version of the psychophysical dense–sparse tasks used by Smith, Shields, Schull, & Washburn (1997). The task, described in the introduction above, required the participants to judge whether a box contained exactly 2,950 pixels. This computer-generated box of 50 to 2,950 illuminated pixels was presented on the upper-left of the screen. If the box contained exactly 2,950 pixels, then the participants were instructed to use the arrow keys on the keyboard to move a plus-shaped cursor (+) into contact with the box. If the box contained any fewer than 2,950 illuminated pixels (nontarget or sparse trials), then the participants were to use the arrow keys to move the cursor into contact with a computer-generated S on the upper-right of the screen. Auditory and visual feedback indicated whether responses were correct, and points were awarded for correct responses. Across trials, the number of pixels in the box was titrated such that when participants responded correctly, the trials became harder (i.e., the number of illuminated pixels in sparse trials got closer to 2,950). When errors were made, the discrimination became easier (i.e., the number of illuminated pixels was made more discrepant from 2,950). In this way, the program quickly ramped up the level of difficulty and found each participant’s threshold level, or the region within which the participants were as likely to make a correct as an incorrect response.
On every trial, irrespective of difficulty, a third response option was also available on the screen. A star was visible in the center of the bottom half of the screen directly below the cursor, which began each trial positioned in the middle of the three response options. Participants could move the cursor to the star on any trial, whereupon the screen would briefly clear and then be refreshed only with the correct response for that trial (i.e., only the S appeared if it was a sparse trial, and only the box appeared if there were exactly 2,950 pixels). In this way, the participant could be shown the correct answer on any trial with no penalty other than the brief delay inherent in making two responses (star + correct answer) rather than just one response. Indeed, the participants were encouraged in the instructions to use the star response whenever they were uncertain.
Each correct response, including the guaranteed-win responses that followed each use of the star, was signaled with a brief tone. Every correct response also generated a counter, which appeared at the top of the screen and showed the total number of points (or wins), to be augmented by one point. Incorrect responses resulted in a 12-s buzzing noise, after which the number of wins was reduced by one point. Other than this timeout period, each trial was participant-paced, and the instructions emphasized that the goal was to get as many wins as possible during the session. Thus, the participants could maximize their performance (and points) by making the primary response (box or S) on any trial on which they were confident about the answer, but making a star response (thereby revealing the correct answer) any time they were unsure.
How close each participant’s actual performance approximated this maximum possible score, given the participant’s own perceptual sensitivity to the target–nontarget discrimination, was used as the primary measure of responsiveness to uncertainty in this study. In particular, each participant’s signal-detection parameters (sensitivity and bias for the primary discrimination) and other performance measures (rate of responding, use of the star or escape response) were used in a series of simulations to answer the question, “How frequently should this participant have used the uncertain response to obtain the maximum number of wins?” Iterative simulations in which the distribution of star responses was systematically varied yielded a measure of the optimal proportion of escape responses for each participant’s discrimination ability. Comparing this ideal proportion of escape responses with this observed use of the star for each participant produced a ratio (the optimality of responsiveness to uncertainty [ORU], calculated as observed/optimal). The ORU measure consequently reflects the proportion of trials on which the participant used the star response relative to how often the participant should have selected the star response, on a task that concentrated trial presentations within a region of decision space where participants were demonstrably uncertain (i.e., equally likely to be correct or incorrect when they guessed at the answer, as determined empirically).
Finally, each participant was tested with a battery of computerized tasks designed to reflect a variety of attention skills. The tasks, selected from the Assessment Software for Attention Profiles (ASAP) battery (Washburn & Putney, 1997), included a version of the Stroop color–word task, a visual search task, and an attention-cuing task. In the Stroop task, the participants indicated by mouse-click whether stimuli were red or blue. Each stimulus was either a series of Xs (baseline trials) or the words RED or BLUE (which appeared either in congruous or incongruous colors). Each participant completed 24 trials, for an average of 8 trials per condition (baseline, congruous, incongruous). The degree to which incongruous trials interfered with accuracy and latency was calculated for each participant. In the visual search task, the participants indicated by mouse-click whether an F appeared in arrays of 30, 50, or 70 other letters (E, L, T). Each participant completed 15 search trials (5 per array size) with a target probability of 0.75. The effect of search-array size on accuracy and response time was computed for each participant. On the cuing task, the participants indicated by mouse-click whether a stimulus was an E or an F. The target letter could appear on the left or right sides of the screen, and on some trials, a visual cue was presented where the target would appear. The participants completed 62 cuing-task trials divided among the conditions (central cues, peripheral cues, no cues, prosaccade cues, and antisaccade cues). The degree to which performance was facilitated (faster and more accurate responses) by these cues was computed for each participant. Finally, several computer-administered self-report measures of attention skills from the ASAP battery were also administered: The Boredom Proneness Scale (Farmer & Sundberg, 1986), the Cognitive Failures Questionnaire (Broadbent, Cooper, & FitzGerald, 1982), and a checklist of symptoms of attention deficit disorder (ADD).
Results
As was observed in previous studies with this density-discrimination task, the participants generally moved the cursor to the S when the number of pixels was clearly below 2,950 and were more likely to touch the box with the cursor as the number of illuminated pixels approached this target number. The standardized and averaged curves for the primary-response judgment are shown in Figure 1. One should note that use of the star response peaked and was tightly distributed around the crossover of the box curves and S curves—the empirically determined region of uncertainty where participants clearly did not know which of the primary options to select. This pattern of results has been interpreted to indicate that people know that they don’t know and respond to this uncertainty adaptively (see Smith et al., 2003).
FIGURE 1.
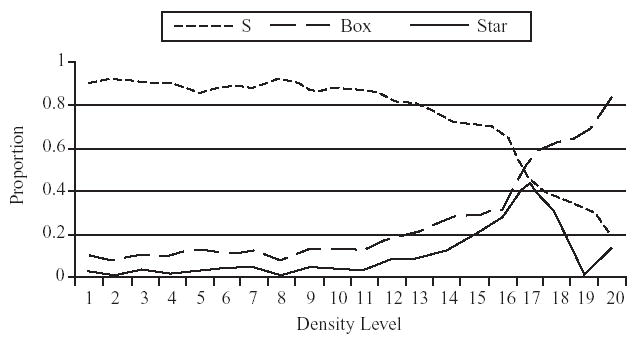
Response selection as a function of normalized stimulus density. Mean proportion of responses to the S and the Box (target) on trials in which the participants attempted the primary task, and mean proportion of responses to the star (uncertain response).
However, one should also note that people did not use the star response very often, even in this region of uncertainty. This, too, replicates a frequent finding in the judgment and decision-making literature, which indicates that people are overconfident in their judgments. Many errors could have been avoided and many more points accumulated had the participants guessed less frequently and used the star response more often to obtain information about the answer.
Some participants used the star response more often than did others. Across the sample, the ORU ranged from 0.00 (no trials in which the star response was used) to 0.80 (participants used the star response at 80% of the frequency they should have to optimize the number of wins, based on the participants’ own performance levels and signal-detection parameters). The mean ORU was 0.23, with a standard deviation of 0.21, reflecting the skewedness of this distribution. Split-half analyses produced a reliability estimate of .93.
Women and men performed equally well on the primary judgment task (determining whether the box contained exactly 2,950 illuminated pixels), averaging 71.8 (standard deviation = 20) and 74.0 (standard deviation = 22.2) wins, respectively, p > .05. Signal-detection sensitivity was also statistically comparable between women and men (d’ = 1.03 and 1.05, respectively, p > .05). Notwithstanding, there were reliable sex differences in responsiveness to uncertainty. Mean ORU score for women was 0.27 (i.e., on average, females used the uncertain response on 23% of the trials but would have scored optimally by using the uncertain response on 85% of the trials); mean ORU for men was 0.19, t(124) = 2.46, p < .05 (i.e., they only used the star on an average of 16% of the trials). Thus, given matched levels of empirically determined uncertainty and comparable skill levels in the actual detection of the targets, women were significantly more optimal in their use of the star response than were men.
Regression analyses were used to determine whether any of the self-report personality or temperament measures were associated with responsiveness to uncertainty. None of the Big Five personality measures (Surgency, Openness, Conscientiousness, Agreeableness, and Emotional Stability, as assessed with an adjective checklist) covaried with ORU. Correlation coefficients for these personality measures with ORU ranged from –.02 to .07 (p > .10). Similarly, no significant relations were found between ORU and scores on the Need for Cognition or Boredom Proneness scales (r = .05 and –.04, respectively, p > .10).
Modest, but significant, correlations were observed between ORU and score on the Cognitive Failures Questionnaire and score on the checklist of ADD symptoms (see Table 1). Estimated reliability for the ADD symptom checklist, developed for this study, was .83. More optimal responsiveness to uncertainty was associated with fewer reports of ADD symptoms, but with more reports of cognitive failures (e.g., action slips and similar errors of inattention).
TABLE 1.
Intercorrelations Between Measures
| 2 | 3 | 4 | 5 | 6 | 7 | 8 | 9 | 10 | 11 | 12 | 13 | |
|---|---|---|---|---|---|---|---|---|---|---|---|---|
| 1. ORU | .01 | –.02 | .07 | .02 | .04 | .05 | .20* | .19* | .00 | –.22* | –.04 | .19* |
| 2. Surgency | — | .31** | .26** | .03 | .36** | .20* | –.07 | –.06 | –.38** | –.10 | –.32** | .05 |
| 3. Agreeableness | — | .32** | .17 | .21* | .01 | .15 | .14 | .02 | –.11 | –.22* | –.07 | |
| 4. Conscientiousness | — | .21* | .17 | .03 | .27** | .29** | –.13 | –.46** | –.27* | .20* | ||
| 5. Emotional stability | — | –.13 | –.02 | –.04 | .07 | –.08 | –.21* | –.24** | .07 | |||
| 6. Intellect | — | .38** | –.02 | –.04 | –.16 | –.09 | –.28** | –.04 | ||||
| 7. Need for cognition | — | –.54** | –.45** | –.50** | –.21* | –.33** | –.02 | |||||
| 8. Need for structure | — | .70** | .53** | .00 | .07 | .08 | ||||||
| 9. Need for closure | — | .35** | –.06 | .07 | .17 | |||||||
| 10. Fear of invalidity | — | .24** | .36** | –.16 | ||||||||
| 11. Attention deficits | — | .46** | –.19* | |||||||||
| 12. Boredom proneness | — | .09 | ||||||||||
| 13. Cognitive failures | — |
Note. ORU = optimality of responsiveness to uncertainty.
p < .05.
p < .01.
The ORU measures were also significantly correlated with Need for Closure and particularly the second subscale in Need for Closure (r = .29, p < .01), which includes items about dislike of unpredictability (e.g., “I dislike unpredictable situations” and “I feel uncomfortable when I don’t understand the reason why an event occurred in my life”). Similar correlations were observed between ORU and the Personal Need for Structure Scale, particularly the second subscale (r = .29, p < .01). This subscale includes statements such as, “I don’t like situations that are uncertain,” “It upsets me to go into a situation without knowing what I can expect from it,” and “I hate to be with people who are unpredictable.” Not surprisingly, the second subscales from these two measures were highly inter-correlated (r = .71, p < .01). The subscales combine to account for 9% of the variance in ORU (multiple r = .31, p < .01). Indeed, having entered these two sub-scales into a regression to predict variations in ORU, only the Need for Cognition score added significantly to the variance in ORU accounted for (delta r2 = .052, multiple r = .38; for the three-variable model, F(13, 123) = 2.29, p < .01). The combined demographic, personality, cognitive style, and attention-skill measures from the entire suite of tests accounted for about 37% of the variance in ORU, multiple r(124) = .61, F(38, 123) = 1.33, p > .05.
Quartile splits were used to divide the ORU scores for an extreme-groups analysis. Participants who were most optimal in their responsiveness to uncertainty (best ORU group, with ORU scores above .35) were compared with participants who were least optimal in responsiveness (worst ORU group, with ORU scores below .05) on all other measures from the study. Not surprisingly, given the correlations discussed above, these performance-based groups differed reliably on score on the Cognitive Failures Questionnaire (mean CFQ score for best ORU group = 98; mean CFQ for worst ORU group = 80) and the ADD symptom checklist (mean = 5.55 for the best ORU group and 8.03 for the worst ORU group), p < .05. This extreme-groups analysis also revealed significant differences in Need for Closure score, with participants in the best ORU group reporting greater need for closure than did participants in the worst ORU group (57.8 and 50.9, respectively, p < .05).
Performance on two of the three attention tasks also differed between the groups in this analysis. Participants in the top quartile of ORU manifested significantly larger Stroop effects than did participants in the bottom quartile of ORU (p < .05). That is, incongruous response cues were more disruptive to response latency for participants who were relatively optimal in responsiveness to uncertainty than for people who were worst at escaping trials on which they were uncertain. Conversely, response times were faster on the visual search task for best ORU participants than for worst ORU participants (p < .05). No difference was observed for the two groups in the effects of central and peripheral cues on the shifting of attention.
Similarly, this extreme-groups analysis revealed no significant differences in the personality profiles of participants across the Big Five traits (see Figure 2). As was suggested by the correlations for the entire sample, groups formed on the basis of quartile-splits of the ORU metric did not differ in surgency, agreeableness, conscientiousness, intellect, or emotional stability (p > .05).
FIGURE 2.
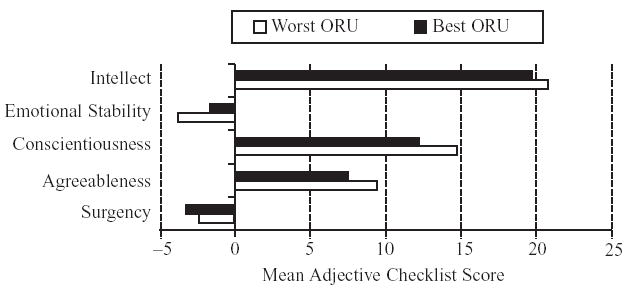
Score on the 5-factor personality inventory, as a function of groups formed on the basis of optimality of responsiveness to uncertainty (ORU).
Discussion
One goal for this study was to replicate the finding that individuals differ in responsiveness to uncertainty under conditions in which this uncertainty is empirically demonstrable and matched across participants. The psychophysical paradigm that we used here affords a measure of responsiveness to uncertainty that is not based on participants’ verbal reports or ratings of confidence. Neither is it dependent on memory or knowledge for facts as the basis for attempting to produce uncertainty and for equating the level of uncertainty across participants. In the present tasks, the difficulty of a density-discrimination task was titrated to find a range of trials for which there was a correct answer, but on which each participant was (on average) as likely as not to guess the incorrect answer. That is, the discrimination was made more difficult if the participant responded accurately and less difficult if the participant made errors, so as to concentrate trials around discrimination threshold. In this region of trials, participants can objectively be defined as uncertain. Although this region of uncertainty in decision (or stimulus) space was larger for some participants than for others, the participants in the present investigation had the opportunity on every trial to declare their uncertainty, to escape trials on which they did not know the answer, and to avoid errors. Although no participant used this uncertain response often enough, some participants were relatively more optimal in their responsiveness to uncertainty than were others. Thus, individual differences were observed in how readily and adaptively participants responded to uncertainty.
A second goal for the present study was to determine whether these individual differences in responsiveness to uncertainty were simply a manifestation of some more general personality characteristic or cognitive style. It seemed reasonable to predict that individuals high in conscientiousness might be low in responsiveness to uncertainty, perhaps because using the uncertain response seems like cheating to some participants (at least, according to their reports during the debriefing process). Similarly, responsiveness to uncertainty could reasonably be predicted to reflect variations in the personality trait of intellect, or the cognitive dispositions tapped by the Need for Cognition, Need for Closure, and similar self-report scales. Although reliable relations were observed between the optimality of responsiveness to uncertainty and some of these temperament measures, it is clear that the shared variance between any of these assessments is low. Whatever determines why some participants use the uncertain response more adaptively than others, it is not the case that those individual differences disappear when personality and cognitive style are taken into account. At least within the context of the measures used here, responsiveness to uncertainty seems to reflect a unique aspect of cognitive style or disposition.
This is not to suggest that the metacognitive differences observed here are unrelated to those identified in previous studies. Indeed, participants in the upper quartile for responsiveness to uncertainty reported significantly more need for closure (i.e., desire to obtain an answer and to eliminate or reduce uncertainty) than did participants who were relatively unresponsive to uncertainty. In fact, participants in the best ORU group scored higher than those in the worst ORU group in almost all of the self-report measures, although the difference was statistically reliable for only a few of the tests. For example, those participants who responded most optimally to uncertainty also reported significantly more action slips and attention errors on the Cognitive Failures Questionnaire. We are inclined to interpret such results as indicating greater metacognitive monitoring by some participants than by others. That is, one might expect people who are metacognitively insensitive generally to guess—because they fail to recognize that they are uncertain—on trials in which they don’t know the answer, but also to fail to report occasions in which they have been inattentive, and to score poorly on other self-report measures that require metacognitive reflection. That is, completing a survey on metacognitive ability is itself a task that requires metacognitive ability. Thus, we expect individuals high in this ability to report more action slips or cognitive failures, even if these people do not necessarily produce more failures of this type than do those with poor metacognitive skills. Individuals who are sensitive to their metacognitive states should also escape trials on which they are uncertain, as we have argued here, and score higher on other measures (need for closure, need for cognition) that are assessed using self-report techniques.
The point is that it seems unlikely that the relation between responsiveness to uncertainty and the reporting of cognitive failures truly reflects differences in the attention skills of these participants. Although the optimality of responsiveness to uncertainty was reliably correlated with the number of self-reported instances of inattentiveness, other measures indicate that the attention skills of the best ORU group were at least as good as those of the worst ORU group. For example, responsiveness to uncertainty was inversely related to ADD symptmatology, with those who were most optimal in responsiveness reporting significantly fewer indicators of attention deficits than those who were least responsive to uncertainty. (One should note that this is the one exception to the pattern in which best ORU participants produced higher self-report scores than worst ORU participants for all of the questionnaires.) Of course, the ADD symptom checklist included both statements about inattentiveness (e.g., “I am easily distracted by extraneous stimuli”) and about hyperactivity (e.g., “I talk excessively”), but there was no evidence that these subscales were differentially discriminating between the groups formed on the basis of ORU quartiles. Rather, the groups differed in overall ADD scores, which of course were relatively low on average for all of the participants in this undergraduate student sample.
A more specific pattern of relations between attention and metacognition is suggested by performance on the subset of ASAP tasks used in this study. Although participants who are highest in responsiveness to uncertainty reported fewer symptoms of ADD than their unresponsive cohort, there are markedly different profiles of attention skills for the two groups. Relative to the worst ORU group, participants in the best ORU quartile located targets more efficiently in a visual search task (i.e., they scanned attention more quickly in the search array so as to locate the target item). It is unclear why the ability to switch attention quickly between stimuli would be positively related to responsiveness to uncertainty, but these data do at least provide a converging argument to support the contention that people who are relatively unresponsive to conditions of uncertainty also manifest significantly poorer attention skills. The more interesting effect would seem to be the significant difference in Stroop-task performance between the two ORU groups, a difference that is in the opposite direction of the visual-search effects. That is, participants who were most likely to use the uncertain response in this sample were significantly more affected by incongruous stimulus cues (the meaning of the word RED that, when printed in blue, should produce the response “blue”). Response competition generated by a prepotent but incompatible cue (the incongruous meaning of the words) slowed responding for all participants relative to the congruous condition (the word BLUE printed in blue, requiring the response “blue”); however, the disruption in response latency was particularly great for those participants who were most likely to respond adaptively to their uncertainty.
Why would Stroop-task interference be greater for the participants who were most responsive to the uncertainty of a density discrimination? Two complementary explanations are indicated. On the one hand, metacognitive monitoring may be at least part of what causes the slowing of responses in the incongruous Stroop conditions. That is, the metacognitive processing that is required to avoid errors and to inhibit prepotent responses (e.g., respond “red” when the word is RED, irrespective of the color of the letters) likely takes time, and this processing time is reflected in the Stroop-task interference and facilitation effects. Participants who do relatively more metacognitive processing (such as the best ORU group in the present study) would thus show greater Stroop-task interference and facilitation effects than would participants who do relatively less metacognitive monitoring (such as the worst ORU participants in this sample).
The suggestion that the effects of incongruous stimuli on Stroop-task performance are mediated by metacognitive monitoring is appealing, but is not consistent with other studies of Stroop interference. Generally, children show larger effects of Stroop incongruity than do adults (e.g., Wright & Wanley, 2003). Stroop effects are also larger for children with attention deficit and hyperactivity disorder than for normally developing children (van Mourik, Oosterlaan, & Sergeant, 2005), and for nonhuman primates than for humans (Washburn, 1994). Although we have demonstrated that Rhesus monkeys do, in fact, respond adaptively to conditions of uncertainty, as do humans (see Smith et al., 2003), it seems unlikely that monkeys are more metacognitive than humans, or that children with attention deficits are more metacognitive than children or adults without such a diagnosis. The magnitude of Stroop interference seems more likely to be the result of the intensity of response competition and the necessity of executive attention to maintain task demands and to resolve this competition (Kane & Engle, 2003; Posner & Raichle, 1994; Washburn), rather than being the result of metacognitive monitoring per se.
A more intriguing explanation of the relation between the optimality of responsiveness to uncertainty and Stroop-task performance is that the cognitive experience of uncertainty is similar to the cognitive experience of response competition. That is, it may be the case that the same kind of response competition that characterizes Stroop-task performance under incongruous conditions (e.g., where the color of the letters compels the execution of one response but the meaning of the word elicits the execution of a different response) is experienced in our psychophysical task. If this is true, then the best ORU group may have differed from the worst ORU group, not in the degree of metacognitive monitoring, but rather in the amount of uncertainty (response competition) that was created by stimuli around the discrimination threshold. This argument would suggest that what is being monitored in uncertainty monitoring, confidence ratings, or similar metacognitive activities or judgments is the amount of competition between the response possibilities. Although this interpretation is speculative, it suggests interesting follow-up possibilities for research in which the associative strengths of various response options are systematically manipulated to determine the relation between response competition, the subjective experience of uncertainty, and the adaptive responsiveness to uncertainty.
Thus, this third goal for the present study—to illuminate the cognitive processes that underlie individual differences in responsiveness to uncertainty—generated more new questions than answers. Although it is clear that individuals differ in responsiveness to conditions of uncertainty, and that these differences are not simply an artifact of better-understood differences in personality or cognitive style, it remains to be demonstrated what subjective cues an individual monitors when he or she seeks to escape an uncertain situation.
Footnotes
This research was supported by grants from the Army Research Office (DASW01–98–K–0006) to Morris Brown College and from the National Institute of Child Health and Human Development (HD–38051) to Georgia State University. Lauren Taglialatela is now at Emory University.
Contributor Information
DAVID A. WASHBURN, Department of Psychology, Georgia State University.
J. DAVID SMITH, Department of Psychology, University at Buffalo.
LAUREN A. TAGLIALATELA, Department of Psychology, Georgia State University
References
- Blackwood N, ffytche D, Simmons A, Bentall R, Murray R, Howard R. The cerebellum and decision making under uncertainty. Cognitive Brain Research. 2004;20:46–53. doi: 10.1016/j.cogbrainres.2003.12.009. [DOI] [PubMed] [Google Scholar]
- Bless H, Forgas JP. The message within: The role of subjective experience in social cognition and behavior. New York: Psychology Press; 2000. [Google Scholar]
- Broadbent DE, Cooper PF, FitzGerald P. The Cognitive Failures Questionnaire (CFQ) and its correlates. British Journal of Clinical Psychology. 1982;21:1–16. doi: 10.1111/j.2044-8260.1982.tb01421.x. [DOI] [PubMed] [Google Scholar]
- Brouwers MC, Sorrentino RM, Roney CJR, Hanna SE. Predicting the impact of trauma disclosure on physiological responses: How cognitive style challenges our ideas about coping. Journal of Social and Clinical Psychology. 2004;23:697–715. [Google Scholar]
- Brown AS. A review of the tip-of-the-tongue experience. Psychological Bulletin. 1991;109:204–223. doi: 10.1037/0033-2909.109.2.204. [DOI] [PubMed] [Google Scholar]
- Cacioppo JT, Petty RE. The need for cognition. Journal of Personality and Social Psychology. 1982;42:116–131. doi: 10.1037//0022-3514.43.3.623. [DOI] [PubMed] [Google Scholar]
- Farmer R, Sundberg ND. Boredom proneness: The development and correlates of a new scale. Journal of Personality Assessment. 1986;50:4–17. doi: 10.1207/s15327752jpa5001_2. [DOI] [PubMed] [Google Scholar]
- Goldberg LR. The development of markers for the Big-Five factor structure. Psychological Assessments. 1992;4:26–42. [Google Scholar]
- Griffin D, Tversky A. The weighing of evidence and determinants of confidence. In: Gilovich T, Griffin D, Kahneman D, editors. Heuristics and biases: The psychology of intuitive judgment. New York: Cambridge University Press; 2002. pp. 230–249. [Google Scholar]
- Kane MJ, Engle RW. Working-memory capacity and the control of attention: The contributions of goal-neglect, response competition, and task set to Stroop interference. Journal of Experimental Psychology: General. 2003;132:47–70. doi: 10.1037/0096-3445.132.1.47. [DOI] [PubMed] [Google Scholar]
- Keren G. Calibration and probability judgments: Conceptual and methodological issues. Acta Psychologica. 1991;77:217–273. [Google Scholar]
- Liberman V. Local and global judgments of confidence. Journal of Experimental Psychology: Learning, Memory, & Cognition. 2004;30:729–732. doi: 10.1037/0278-7393.30.3.729. [DOI] [PubMed] [Google Scholar]
- McClelland AGR, Bolger F. The calibration of subjective probabilities: Theories and models 1980–1993. In: Wright G, Ayton P, editors. Subjective probability. Chichester: Wiley; 1994. pp. 453–482. [Google Scholar]
- Nelson TO. A comparison of current measures of accuracy of feeling-of-knowing predictions. Psychological Bulletin. 1984;95:109–133. [PubMed] [Google Scholar]
- Neuberg SL, Judice TN, West SG. What the Need for Closure Scale measures and what it does not: Toward differentiating among related epistemic motives. Journal of Personality and Social Psychology. 1997;72:1396–1412. [Google Scholar]
- Neuberg SL, Newsome JT. Personal need for structure: Individual differences in the desire for simpler structure. Journal of Personality and Social Psychology. 1993;65:113–131. [Google Scholar]
- Pitz GF, Sachs NJ. Judgment and decision: Theory and application. Annual Review of Psychology. 1984;35:139–163. doi: 10.1146/annurev.ps.35.020184.001035. [DOI] [PubMed] [Google Scholar]
- Posner MI, Raichle ME. Images of mind. New York: Scientific American Books; 1994. [Google Scholar]
- Shuper PA, Sorrentino RM, Otsubo Y, Hodson G, Walker AM. A theory of uncertainty orientation: Implications for the study of individual differences within and across cultures. Journal of Cross-Cultural Psychology. 2004;35:460–480. [Google Scholar]
- Smith JD, Shields WE, Schull J, Washburn DA. The uncertain response in humans and animals. Cognition. 1997;62:75–97. doi: 10.1016/s0010-0277(96)00726-3. [DOI] [PubMed] [Google Scholar]
- Smith JD, Shields WE, Washburn DA. The comparative psychology of uncertainty monitoring and metacognition. Behavioral and Brain Sciences. 2003;26:317–373. doi: 10.1017/s0140525x03000086. [DOI] [PubMed] [Google Scholar]
- Sorrentino RM, Roney CJR. The uncertain mind: Individual differences in facing the unknown. Philadelphia: Psychology Press; 2000. [Google Scholar]
- Thompson MM, Naccarato ME, Parker KCH, Moskowitz GB. The personal need for structure and personal fear of invalidity measures: Historical perspectives, current applications, and future directions. In: Moskowitz GB, editor. Cognitive social psychology: The Princeton symposium on the legacy and future of social cognition. Mahwah, NJ: Erlbaum; 2001. pp. 19–39. [Google Scholar]
- Tversky A, Fox CR. Weighing risk and uncertainty. Psychological Review. 1995;102:269–283. [Google Scholar]
- Tversky A, Kahneman D. Judgment under uncertainty: Heuristics and biases. Science. 1974;185:1124–1131. doi: 10.1126/science.185.4157.1124. [DOI] [PubMed] [Google Scholar]
- van Mourik R, Oosterlaan J, Sergeant JA. The Stroop revisited: A meta-analysis of interference control in AD/HD. Journal of Child Psychology & Psychiatry. 2005;46:150–165. doi: 10.1111/j.1469-7610.2004.00345.x. [DOI] [PubMed] [Google Scholar]
- Washburn DA. Stroop-like effects for monkeys and humans: Processing speed or strength of association? Psychological Science. 1994;5:375–379. doi: 10.1111/j.1467-9280.1994.tb00288.x. [DOI] [PubMed] [Google Scholar]
- Washburn DA, Putney RT. Assessment software for attention profiles. 1997. [Google Scholar]
- Webster DM, Kruglanski AW. Individual differences in need for cognitive closure. Journal of Personality and Social Psychology. 1994;67:1049–1062. doi: 10.1037//0022-3514.67.6.1049. [DOI] [PubMed] [Google Scholar]
- West RF, Stanovich KE. The domain specificity and generality of over-confidence: Individual differences in performance estimation bias. Psychonomic Bulletin & Review. 1997;4:387–392. [Google Scholar]
- Wright BC, Wanley A. Adults’ versus children’s performance on the Stroop task: Interference and facilitation. British Journal of Psychology. 2003;94:475–485. doi: 10.1348/000712603322503042. [DOI] [PubMed] [Google Scholar]