Abstract
Para-phenylenediamine (PPD) is known to be a common sensitizer of allergic contact dermatitis and contact urticaria. To clarify the mechanism of contact hypersensitivity (CHS) to PPD, we established a mouse model of PPD-induced CHS. BALB/c mice were immunized for 3 consecutive days by painting topically a 2·5% PPD solution on their shaved abdominal skin. On days 5, 7 or 9 after the initial application, the mice were challenged by applications of a 2·5% PPD solution. Maximal ear swelling was determined at 24 h but another statistically significant and smaller ear swelling was observed 1 h after challenge with PPD in a hapten-specific manner. Adoptive cell transfer experiments demonstrated that the ear swelling of the adoptive cell transferred mice displayed an early response at 6 h and a late response from 12 h to 24 h when the recipient mice were challenged immediately after transfer. Both MoAbs and complement treatment of the transferred cells demonstrated that the phenotype of the early response cells which elicited a response at 6 h after challenge was Thy1+, B220+, αβ TCR−, γδ TCR−, CD3−, CD4−, CD5+ and CD8−. The in vitro treatment of effector cells with MoAbs against not only αβ TCR but also γδ TCR, together with complement, was found to diminish substantially the late response, elicited 12–24 h after challenge. γδ T cells reconstituted the ability of αβ T cells to transfer 24 h CHS responsiveness. The phenotype of the γδ T cells that assist CHS effector αβ T cells was CD3+, CD4− and CD8+ and these regulatory γδ T cells were neither Ag-specific nor MHC-restricted. Furthermore, γδ T cells from normal spleen could also assist αβ T cells in adoptive transfer of the 24 h CHS response in a non-MHC-restricted manner. RT-PCR demonstrated that αβ T cells strongly expressed mRNA IFN-γ, whereas γδ T cells expressed not only IFN-γ but also IL-4 and IL-10. These data indicate that not only early response cells and αβ T cells but also Th2 type γδ T cells may play an important role in the elicitation of CHS to PPD.
Keywords: contact hypersensitivity, γδ T cells, para-phenylenediamine (PPD), Th2 cells
INTRODUCTION
Sensitization by para-phenylenediamine (PPD) has been considered by some countries to be so great a hazard that its use in hair dyes was banned in Germany in the early 1900s. It was subsequently prohibited in France, and in 1964 in Sweden; however, in Japan PPD is still used as a common component in hair dyes [1].
It is well known that PPD elicits not only contact hypersensitivity but also immediate-type hypersensitivity [2]. Contact dermatitis elicited by PPD may appear within a few hours of the dye being used or may appear the following day. The severity of such eczema varies considerably and intense oedema on the face with exudation of the scalp can occur. Severe cases of immediate-type hypersensitivity to PPD have also been reported [3], in which the patients developed severe oedema, irritation of the eyes and face and also difficulty in breathing. The allergenicity of PPD was first described by Mayer [4]. Rajka et al. [5] demonstrated that the sensitization for PPD was similar to that for benzoquinone based on an intracutaneous sensitization experiment using guinea pigs with PPD or benzoquinone.
To clarify further the mechanism of PPD-elicited contact hypersensitivity (CHS), Magnusson [6] established a guinea pig model of PPD based on both the intradermal injection of PPD as well as the topical application of PPD. Recently, Garrigue et al. [7] reported that mice were contact-sensitized to weak contact sensitizers such as isoeugenol or PPD after applying PPD for 3 consecutive days on the backs of mice; however, the degree of observed ear swelling was not substantial.
In this paper, to clarify the immune mechanism of CHS due to PPD, we established a murine model for CHS due to PPD and characterized the function of effector T cells which can elicit PPD-CHS.
MATERIALS AND METHODS
Animals
Female BALB/c,C3H/He and C57BL/10 mice 8–10 weeks of age were purchased from the Sankyo Co., Tokyo, Japan. They were all given food pellets and water ad libitum. Each experimental group consisted of at least five mice.
Reagents
The following reagents were obtained from commercial sources: 2,4,6-trinitrochlorobenzene (TNCB; PCl) and N-2-hydroxyethyl-piperazine-N,-2-ethanesulphonic acid (Hepes) from the Nakarai Chemical Co., Kyoto, Japan; p-phenylenediamine (PPD) from the Wako Junyaku Co., Tokyo, 4-ethoxyl methylene-2-phenyl-2-oxazol-5-one (Oxa) from the Sigma Chemical Co., St Louis, MO, USA; and trypsin,1 : 250, from Difco. The following MoAbs were used: anti-αβ TCR MoAb (Cedar Lane Laboratories Ltd, Canada, hamster), antiγδ TCR MoAb (Cedar lane Laboratories Ltd, Canada, hamster), anti-Thy1·2 MoAb (IgG2, Caltag Laboratory, CA, USA), anti-Ly2 MoAb (Cedar lane Laboratories Ltd, Canada, rat), antimouse CD4 (L3T4), antimouse CD3 MoAbs (Cedar Lane Laboratories Ltd, Canada, rat), anti-CD45R/B220 MoAb (PharMingen, USA), anti-CD5 (PharMingen,USA).
Immunization for the induction of contact hypersensitivity to PPD
Mice were contact sensitized by three daily consecutive topical applications of 100 μl of either 2·5% PPD, 5% PCl or 3% Oxa in acetone in olive oil (4 : 1) on their shaved abdominal skin. Control mice were treated in the same fashion with vehicle alone.
Challenge and quantification
On days 5, 7 or 9 after the initial abdominal application, the mice were challenged by applying 20 μl of hapten solution (either 2·5% PPD, 1% PCl, or 0·5% Oxa in olive oil) on both sides of the ears. The thickness of the ear was then measured at 1 h, 3 h, 6 h, 12 h, 24 h, 48 h, 72 h, 96 h, 120 h after challenge using an engineer's micrometer (Peacock, Ozaki Engineering, Tokyo, Japan) and the results were expressed as the mean ± s.d. in units of 10−2 mm. Non-immune control mice were also challenged by applying hapten solution on both sides of the ears.
Adoptive cell transfer of the CHS-T cell subpopulation depleted by in vitro treatment with MoAb and complement
On day 5 after the initial sensitization with either PPD or PCl, the mice were killed by a cervical dislocation. Their peripheral lymph nodes were then removed and a cell suspension prepared by gentle teasing. The cells were washed three times with phosphate-buffered saline (PBS). The ability of γδ T cells to influence αβ T cells in the successful transfer of CHS was determined by two protocols. Finally, for some experiments immune cells were incubated with either: anti-Thy 1 MoAb; anti-B220 MoAb; anti-CD3 MoAb; anti-L3T4 MoAb; anti-CD5 MoAb; anti-Ly2 MoAb; anti-δ TCR MoAb; anti-β TCR MoAb; anti-δ TCR MoAb and anti-Ly2 MoAb: anti-δ TCR MoAb and anti-L3T4 MoAb; or anti-δ TCR MoAb and anti-CD3 MoAb for 30 min at 4°C. After a single washing, the cells were then incubated with rabbit complement (Low-ToxicR-M rabbit complement, Cedar Lane Laboratory Limited, Ontario, Canada) diluted to a ratio of 1/10 and then mixed intermittently for an additional 45 min in a 37°C water bath. Usually, 1 × 10⁸ cells were incubated with 10–20 μg of MoAbs diluted in PBS containing 3% FCS in a volume of 5 ml. Cells treated with complement alone served as positive controls. Immune cells treated with antibodies and complement were resuspended and then 2 × 10⁷ of cells, either alone or mixed together, were injected intranevously (i.v.) in 0·5 ml PBS into naive syngeneic mice (n = 5). Simultaneously or 1 day after cell transfer, 20 ml of 2·5% PPD in olive oil, or olive oil alone was painted onto the ears of the mice. The swelling of the ear was measured at 1 h, 3 h, 6 h, 12 h, 24 h or 48 h after the injection. The increment of ear swelling was assessed using an engineer's micrometer.
Secondly, a technique using Dynabeads was employed to analyse depleted and enriched T cell subsets. Depletion and enrichment of the T cell subpopulation was achieved according to the manufacturer's protocol. Briefly, 1–2 × 10⁷ T cells were incubated in 5 ml complete medium containing 0·5 μg/ml MoAbs. The T cells, incubated for 30 min on ice, were washed and resuspended in 5 ml PBS/1% FCS. This cell suspension was incubated with 50 μl of goat antimouse IgG bound covalently to magnetic polystyrene beads (Dynabeads M-450; Dynal AS, Oslo, Norway) or antihamster MoAb-coated beads (Biomag, 1-mm iron magnetic particles, Advanced Magnetics, Inc., Cambridge, MA, USA) for 1 h at 4°C. The cells attached to the beads were pelleted by the application of a magnetic field; adherent cells (γδ T cell+ cells > 95%), and non-adherent cells (< 0·05% γδ T cells) were collected, washed and processed for RT-PCR experiments.
Analysis of T cell mRNA
Total cellular RNA was extracted from 1 × 10⁷ purified γδ or αβ T cells (> 95% cell purity) that had been incubated at 37°C in complete medium for 24 h after separation by the guanidinium isothiocyanate method using RNA zolR (Biotex CS 101). Twenty-two microlitres of RT mixture was prepared by mixing 4 ml of 10× buffer (100 mm Tris-HCl, pH 8·3, 500 mm KCl, 15 mm MgCl2), 4 μl of hexanucleotide mixture (62·5 A 260-U/ml, Boehringer Mannheim, Mannheim, Germany), 4 μl of 100 mm dithiothreitol, 2 ml of dNTP (2·5 mm each), 4 μl of ribonuclease inhibitor (20 U/ml, TaKaRa, Japan), 12 U of reverse transcriptase (RAV-2; TaKaRa, Japan) and water. An RT mixture was made for all samples and aliquoted at 22 μl/tube with 18 ml of total RNA (800 ng). The tubes were vortexed, spun briefly and left for 10 min at room temperature and then at 42°C for 60 min. RT was inactivated at 95° for 5 min. The samples were stored at − 70°C. A polymerase chain reaction (PCR) was performed by the previously reported method.
The PCR mixture contained 5 μl reverse-transcribed RNA (100 ng total RNA), 5 μl of 10× buffer, 4 μl of dNTP (2·5 mm each), 2·5 μl of 20 mm up-primer and 2·5 μl of 20 mm down-primer, 0·4 μl of 5 U/ml Taq polymerase (TaKaRa, Ohtsu, Japan) and 30·6 μl of water. Oligonucleotide primers specific for β-actin, IL-4, IL-10 or IFN‐γ were used. The forward and reverse DNA primers were as follows: IL-4 primers: upstream, 5′-CGAAGAACACCACAGAGAGTGAGCT-3′; downstream, 5′-GACTCATTCATGGTGCAGCTTATCG-3′; IL-10 primers: upstream, 5′-ATGCAGGACTTTAAGGGTTACTTGGGTT-3′; downstream, 5′-ATTTCGGAGAGAGGTACAAACGAGGTTT-3′; IFN-γ primers: upstream, 5′-AGCGGCTGACTGAACTCAG ATTGAAG-3′; downstream, 5′-GTCACATGTTTCAGCTGTAT AGGG-3′ and β-actin primer; upstream, 5′-TGGAATCCTGTGG CATCCATGAAAC-3′; downstream, 5-TAAAACGTAGCTCCA GTAACAGTCCG-3′.
β-actin, IFN-γ and IL-4 primers were synthesized by the phosphoramide method using a DNA synthesizer (model 392 PCR-MATA; Applied BIosystems, Inc., Foster City, CA, USA) and purified on a Sephadex G50 column (Pharmacia LKB Biotechnology, Gaithersburg, MD, USA) and by HPLC. The sequences of primers are specific as confirmed. PCR amplification was performed employing a 35-cycle program (β-actin: 25-cycle) consisting of denaturation, annealing and extension: 1 min of denaturation at 94°C, 1 min of annealing at 60°C and 2 min of extension at 72°C for β-actin; 1 min of denaturation at 94°C, 1 min of annealing at 62°C and 2 min of extension at 72°C for IL-4 or IFN-γ; 1 min of denaturation at 94°C, 1 min of annealing at 55°C and 2 min of extension at 72°C for IL-10. The PCR products were detected by electrophoresis on 1·7% agarose gel containing ethidium bromide.
Immunofluorescence (IF) analysis
After the T cells were rinsed in ice-cold PBS containing 0·1% sodium azide (NaN3) with 1% FCS, they were then incubated for 30 min with 2·5 μg/ml of the fluorescein isothiocyanate (FITC)-labelled anti-β TCR MoAb, anti-δ TCR MoAb or the appropriate FITC-labelled IgG1 control. Flow cytometry was performed by using either a Leitz Vario Orthomat 2 fluorescent microscope or FACS Analyser (Cyto ACE-150, TASCO Ltd, Japan), using 10 000 cells/sample. Dead cells were gated out with ethidium bromide.
Statical analysis
The experimental data are expressed as the mean ± s.d. (standard deviation). Statistical analysis was performed using Student's t-test.
RESULTS
Time-course studies of CHS elicited by PPD
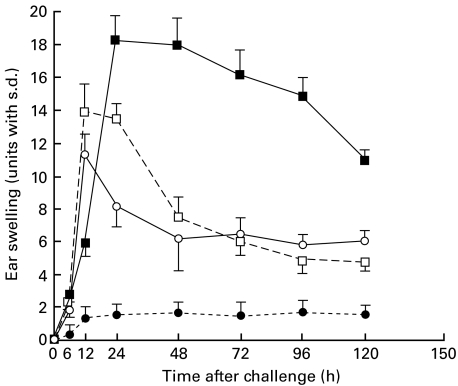
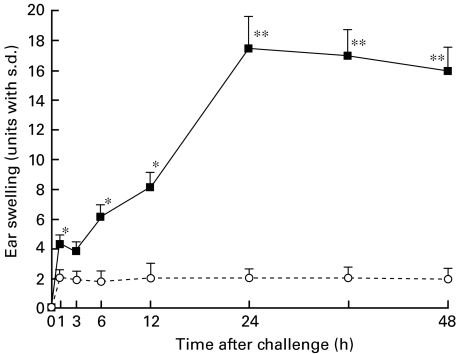
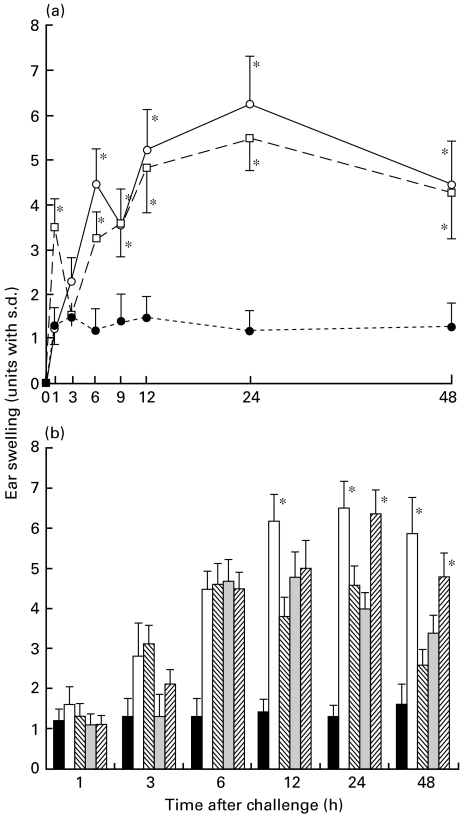
Naive mice were contact-sensitized with 2·5% PPD for 3 consecutive days and then on days 5, 7 or 9 after the initial immunization were challenged. As shown in Fig. 1, the maximal degree of ear swelling was detected at 24 h for the mice challenged on day 5 after the initial sensitization, and at 12 h for that on days 7 or 9. No significant ear swelling was detected in the non-immune control mice after the challenge (Fig. 1). These data indicate day 5 after the initial sensitization to be an optimal time for the challenge. We next investigated the time-course of the early response in the PPD-sensitized mice challenged on day 5. As shown in Fig. 2, biphasic skin reactions were induced in BALB/c mice with peak responses at 1 and 24 h after the challenge, which was conducted on day 5 after the initial sensitization.
Fig. 1.
Time-course of ear swelling after the final sensitization of the PPD-sensitized nonsensitized mice. Naive mice were contact-sensitized with 2·5% PPD for 3 consecutive days, then on day 5, day 7, day 9 after the initial immunization both they and non-sensitized mice were challenged. The maximal ear swelling was detected at 24 h for the mice challenged 5 days after the initial sensitization, and at 12 h for those challenged on day 7 or day 9. Non-immune control mice were also challenged by applying of PPD solution on both sides of both ears. The data presented are the mean values ± s.d. of five mice per group and are representative of three independent experiments. •, Negative control; ▪, day 5; □, day 7; ○, day 9.
Fig. 2.
Time-course of the early response after challenge. Naive mice were contact-sensitized with 2·5% PPD for 3 consecutive days and then on day 5 after the initial immunization they and non-sensitized mice as a negative control were challenged. Maximal ear swelling was detected 24 h after the mice were challenged. A statistically significant and smaller ear swelling response was also observed only 1 h after challenge of the actively PPD-sensitized mice. The data presented are the mean values ± s.d. of five mice per group and are representative of three independent experiments. *P < 0·01, significant compared to the results obtained with negative control mice, **P < 0·005, significant compared to the results obtained with negative control mice. ▪, PPD; ○, negative control.
Antigen specificity
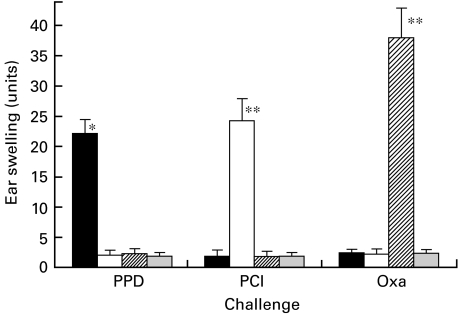
To determine whether PPD-elicited CHS was an antigen-specific response, mice were contact-sensitized with either PPD, PCl or Oxa, and were then challenged with each antigen. As shown in Fig. 3, a significant response was observed when PPD-sensitized mice were challenged with PPD on day 5 after the initial sensitization.
Fig. 3.
Antigen specificity of sensitization. Mice were contact-sensitized with either 2·5% PPD, 1% PCl or 1% Oxa. Then on day 5 after the initial sensitization, mice were challenged with each solution. Non-immune control mice were also challenged by applying hapten solution on both sides of both ears. Ear swelling was measured 24 h after the challenge. A significant response was observed when the PPD-sensitized mice were challenged with PPD but not with either PCl or Oxa. PCl- and Oxa-induced CHS was also antigen-specific. The data presented are the mean values ± s.d. of five mice per group and are representative of five independent experiments. *P < 0·01, significant compared to the results obtained with negative control mice, **P < 0·0001, significant compared to the results obtained with negative control mice, ***P < 0·0005, significant compared to the results obtained with negative control mice. ▪, PPD; □, PCI;  , Oxa;
  , (-).
PCl- and Oxa-elicited CHS also demonstrated antigen-specific responses (Fig. 3). Ear swelling was not detected in the non-immune control mice after the challenge with each solution (Fig. 3).
Comparison of PPD-elicited CHS between mice strains
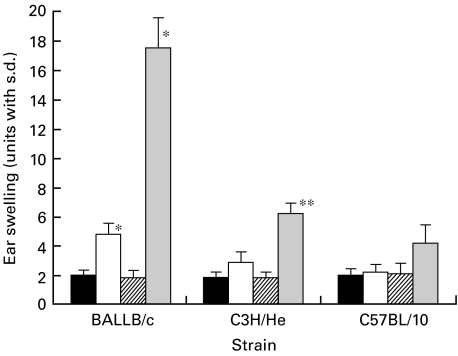
To compare PPD-elicited CHS between mice strains, CHS was induced in not only BALB/C mice but also C3H/He and C57BL/10 mice by the topical administration of a PPD solution. Twenty-four-hour ear swelling in CHS induced by PPD was observed in both BALB/c and C3H/He but not in C57BL/10 mice; however, 1 h ear swelling was only detected in the BALB/c mice but not in the C3H/He nor the C57BL/10 mice (Fig. 4).
Fig. 4.
Comparison of PPD-induced CHS between mice strains. To compare PPD-induced CHS between mice strains BALB/c, C3H/He and C57/10 mice were sensitized by topical painting using 10 ml of 2·5% PPD solution for 3 consecutive days, and then on day 5 after initial sensitization they were challenged on each of their ears with 20 ml of 2·5% PPD. Non-immune control mice were also challenged by applying 2·5% PPD solution on both sides of both ears. Ear swelling was measured at 1 h or 24 h after the challenge. PPD-induced CHS was observed with a peak response at 24 h after the challenge in both BALB/c and C3H/He mice but not in C57BL/10 mice. The data presented are the mean values ± s.d. of five mice per group and are representative of five independent experiments. *P < 0·005, significant compared to the results obtained with negative control mice, **P < 0·01, significant compared to the results obtained with negative control mice. ▪, Negative control (1 h); □, PPD (1 h);  , negative control (24 h);
  , PPD (24 h).
Adoptive cell transfer of PPD-CHS
Pooled lymph node cells from PPD contact sensitized BALB/c mice were harvested 5 days after the initial application, injected into naive mice, and then challenged with PPD solution simultaneously, or 1 day after cell transfer. Van Loveren et al. demonstrated that the time-course of ear swelling responses in recipients that are challenged immediately after transfer (immediate challenge) differs from those that received transfer 1 day before challenge (delayed challenge), in that the early responses occur somewhat later at 6–12 h after immediate challenge [8,9]. In agreement with their data, significant ear swelling in the adoptive transferred mice was detected as an early response at 6 h in immediately challenged mice followed by a later response at 12 h and then 24–48 h after challenge, whereas the early ear swelling response occurred at 1 h after delayed challenge in actively sensitized mice (Fig. 5a). As shown in Fig. 5b, the early response cells expressed neither αβ nor γδ TCR since this response was undiminished by depleting αβ or γδ T cells. To investigate the surface phenotype of the early response cells, the effect of monoclonal antibody plus complement treatment on the adoptive cell transfer of CHS elicited by PPD was examined.
Fig. 5.
γδ T cells assist αβ T cells in transfer of CHS. (a) The pooled lymph node cells from PPD contact-sensitized BALB/c mice were harvested and injected i.v. at a dose of 2 × 10⁷ cells into the naive mice. Then, they were challenged with 2·5% of PPD solution immediately after cell transfer (○) or 1 day after cell transfer (□). Non-immune control mice also were challenged by applying of PPD solution on both sides of the ears (•). Ear thickness was measured before transfer and 1, 3, 6, 12, 24 and 48 h after challenge. The data presented are the mean values ± s.d. of five mice per group and are representative of three independent experiments. *P < 0·01, significant compared to the results obtained with negative control mice. (b) The pooled lymph node cells from PPD contact-sensitized BALB/c mice were harvested and treated in vitro with various reagents and then centrifuged, resuspended and injected i.v. at a dose of 2 × 10⁷ cells into naive mice, challenged simultaneously with 2·5% of PPD solution. The mice in group (–) Control (▪) were not contact-sensitized with PPD; the mice in group C (□) received cells treated with complement (C) alone; the mice in group αβ T cells ( ) received cells treated with antiγδ TCR MoAb plus C; mice in group γδ T cells (
 ) received cells treated with ant-αβ TCR MoAb plus C; the mice in group αβ T cells + γδ T cells (
 ) received a 1 : 1 mixture of cells treated with antiγδ TCR MoAb plus C; the cells treated with antiαβ TCR MoAb + C. The ear swelling of the adoptive lymph node cells transferred mice registered a peak response at 6 h and from 12 h to 24 h (□) after application; however, the adoptive transferred mice with γδ T cells demonstrated a peak at 12 h (
 ) and mice which underwent the adoptive transfer with αβ T cells demonstrated a peak response between 12 h and 24 h (
 ). The data presented are the mean values ± s.d. of five mice per group and are representative of five independent experiments. *P < 0·01, significant compared to the results obtained with the mice receiving αβ T cells (cells treated with antiγδ TCR MoAb + C).
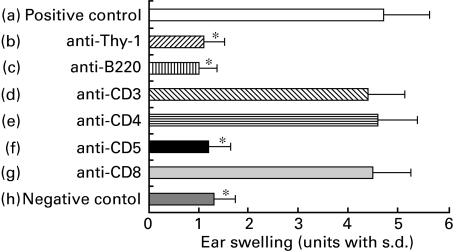
The results of Fig. 6 revealed the phenotype of the early response cells to be: Thy 1+, B220+, CD3−, CD4−, CD5+ and CD8−. The immune response transferred with lymph node cells was observed to be weaker than the CHS elicited by PPD topical administration and showed a peak response at 24 h (Fig. 2,5a,b).
Fig. 6.
The surface phenotype of early response cells. To determine the surface phenotype of early response cells, the pooled lymph nodes from BALB/c mice contact sensitized with PPD were harvested and treated with C alone (positive control group a), with anti-Thy-1 MoAb plus C (group b), with anti-B200 MoAb plus C (group c), with anti-CD4 MoAb plus C (group d), with anti-CD5 MoAb plus C (group e) or with anti-CD8 MoAb plus C (group f) and were then centrifuged, resuspended and injected i.v. at a dose of 2 × 10⁷ into groups of normal recipients that were simultaneously challenged on the ears with 2·5% PPD. As a negative control, non-sensitized mice were challenged with 2·5% PPD. Ear thickness was measured before transfer, and again at 6 h after the challenge. The data presented are the mean values ± s.d. of five mice per group and are representative of three independent experiments. *P < 0·01, significant compared to the results obtained with the positive control mice (group a).
To determine the phenotype of the effector cells of the late phase reaction, monoclonal antibody plus complement treatment on the adoptive cell transfer of CHS elicited by PPD was performed. Lymph node cells from PPD-immunized mice were harvested and incubated with various MoAbs and complement and the cells were transferred intravenously. The transfer of the αβ TCR depleted and the γδ depleted cells reduced the responsiveness of the PPD-CHS at 12–48 h but not at 6 h (Fig. 5b). The peak or the late immune response transferred by γδ-depleted T cells (i.e. αβ T cells) was detected 24 h after challenge, whereas that transferrd by αβ-depleted T cells (i.e. γδ T cells) was detected 12 h after challenge (Fig. 5b). Importantly, Fig. 5b shows that the mixture of αβ and γδ T cells reconstituted significantly the ability to elicit the 24 h component of CHS. As a result, it appears that γδ T cells are required to assist αβ T cells in the adoptive transfer of CHS responses.
Phenotype of γδ T cells that assist αβ T cells in the transfer of CHS
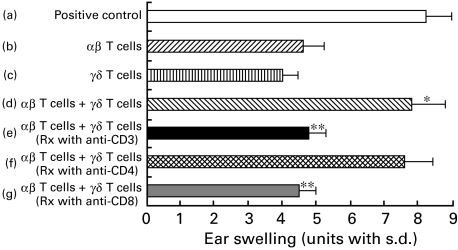
The phenotype of γδ T cells (i.e. αβ-depleted cells) was determined by additional treatment of antiαβ TCR-treated cells with anti-CD3, anti-CD4 or anti-CD8 plus C. Figure 7 shows the γδ T cells that assisted αβ T cells in the adoptive transfer of CHS to be CD3+, CD4− and CD8+ 0. As a result, the positive regulatory γδ T cells required for classical αβ TCR effector T cells to elicit CHS are: γδ TCR+, αβ TCR−, CD3+, CD4− and CD8+ (Fig. 7).
Fig. 7.
The surface phenotype of γδ T cells in lymph node cells that assist αβ T cells in the transfer of CHS. The pooled lymph nodes from BALB/c mice contact-sensitized with PPD were harvested and treated with C alone (positive control group a) or with antiγδ TCR MoAb plus C (group b) or with antiαβ TCR MoAb plus C (group c) and were then centrifuged, resuspended and injected i.v. at a dose of 2 × 10⁷ into groups of normal recipients that were challenged simultaneously on the ears with 2·5% PPD. Ear thickness was measured before transfer and again at 24 h after the challenge. Group d received a mixture of antiγδ-treated (i.e. αβ T cells) cells and antiαβ-treated (i.e. γδ T cells) cells and a similar mixture was transferred to groups e, f and g except in these cases either anti-CD3 MoAb (group e), anti-CD4 MoAb (group f) or anti-CD8 MoAb (group g) was added to the antiαβ TCR MoAb to examine the phenotype of the γδ TCR-enriched cells. The data presented are the mean values ± s.d. of five mice per group and are representative of four independent experiments. *P < 0·01 group b versus group d. **P < 0·01 group d versus groups e or g.
γδ T cells required for the elicitation of PPD-induced CHS do not act Ag specifically and are not MHC-restricted
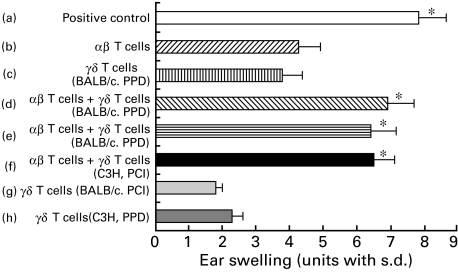
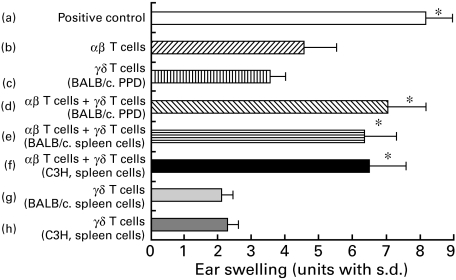
The previous experiments were performed using the PPD-CHS system in BALB/c (H-2d) mice and showed that the presence of γδ T cells among PPD-immune cells enabled αβ T cells in the PPD-immune cells to mediate the transfer of the 24-h CHS response. Figure 8 shows the results of an experiment designed to test whether the γδ TCR+ regulatory cells were Ag-specific or MHC-restricted. In these experiments, either BALB/c mice or C3H mice were sensitized with either PPD or PCl. In Fig. 8, groups a, b, c in both Ag systems show that neither αβ TCR nor γδ TCR-enriched cells alone could completely transfer optimal CHS. Groups b, d, e, f in Fig. 8 show that not only γδ TCR-enriched cells from PPD-sensitized donors but also γδ TCR-enriched cells from PCl-sensitized donors or from PPD sensitized C3H (H-2 k) mice could assist the αβ TCR-enriched PPD-immune CHS effector T cells; however, these γδ TCR enriched cells could not reconstitute PPD-CHS completely (Fig. 8). It was thus concluded that the CD3+, CD4−, CD8+ γδ T cells that assist αβ T cells in the adoptive transfer of the 24-h CHS response did not act in an Ag-specific manner, nor were these regulatory T cells MHC-restricted (Fig. 8).
Fig. 8.
γδ T cells that are required to elicit CHS to PPD do not demonstrate either Ag-specificity or MHC-restriction. Separate groups of BALB/c mice or C3H/He mice were contact-sensitized by painting with either PPD or PCl for consecutive days. Then on day 5 after the initial sensitization, the lymph nodes were harvested and treated in vitro with antiαβ TCR MoAb or antiγδ TCR MoAb and C, and were then centrifuged, resuspended and injected i.v. at a dose of 2 × 10⁷ into groups of BALB/c recipients that were challenged simultaneously on the ears with 2·5% PPD. Ear thickness was measured before transfer and at 24 h after challenge. Then the mice in group a received cells treated with C alone; group b received cells treated with anti-TCR γδm Ab + C; group c received cells from BALB/c mice contact-sensitized with PPD treated with antiαβ MoAb + C; groups d, e, f received a 1 : 1 mixture of cells treated with anti-TCR-γδ + C and cells treated with anti-TCR-αβ + C that were each equivalent to the numbers of the cells in groups b, c, g or h; group d received cells treated with antiγδ TCR MoAb (i.e. αβ T cells) + C from the PPD-sensitized mice which were supplemented with antiαβ TCR MoAb-treated cells (i.e. γδ T cells) from the PPD-sensitized BALB/c mice; group e received antiγδ TCR MoAb (i.e. αβ T cells) from the PPD-sensitized mice which were supplemented with antiαβ TCR MoAb-treated cells (i.e. γδ T cells) from the PCl-sensitized BALB/c mice; group f received antiγδ TCR MoAb (i.e. αβ T cells) from the PPD-sensitized mice which were supplemented with antiαβ TCR MoAb-treated cells (i.e. γδ T cells) from the PPD-sensitized C3H mice; group g received antiαβ TCR MoAb-treated cells from the PCl sensitized BALB/c mice; group h received antiαβ TCR MoAb-treated cells from the PPD-sensitized C3H mice. The presented data are the mean values ± s.d. of five mice per group and are representative of three independent experiments. Statistical significance for groups b versus groups a, d, e or f was considered to be present at P < 0·01.
γδ T cells in normal spleen assisted immunized αβ T cells in the adoptive transfer of CHS to PPD
The previous experiments indicated that γδ T cells in lymph nodes from PPD sensitized mice that assist αβ T cells in the adoptive transfer of the 24-h CHS response did not act in an Ag-specific manner, nor were these regulatory T cells MHC-restricted (Fig. 8). We also wanted to determine whether γδ T cells in the spleen of sensitized compared to non-sensitized animals can assist immunized αβ T cells in the adoptive transfer, as has been reported by others. Thus, γδ T cells from the normal spleen of BALB/c or C3H mice were prepared and transferred to normal BALB/c mice along with αβ T cells from sensitized lymph nodes. In Fig. 9, groups a, b, c in both Ag systems show that neither αβ TCR nor γδ TCR-enriched cells alone could completely transfer optimal CHS. Groups b, d, e, f show that not only γδ TCR-enriched T cells from lymph nodes of PPD-sensitized donors but also γδ TCR-enriched T cells from normal spleen of naive BALB/c mice (H-2d) or from naive C3H (H-2 k) mice could assist the αβ TCR-enriched PPD-immune CHS effector T cells; however, these γδ TCR-enriched cells could not reconstitute PPD-CHS completely (Fig. 9c,g,h). It was thus concluded that the γδ T cells in the normal spleen could assist αβ T cells in the adoptive transfer of the 24-h CHS response in a non-MHC-restricted manner (Fig. 9).
Fig. 9.
γδ T cells in normal spleen can assist immunized αβ T cells in the adoptive cell transfer of CHS to PPD. Separate groups of BALB/c mice were contact-sensitized by painting with 2·5% PPD for 3 consecutive days. Then on day 5 after the initial application, the lymph nodes from sensitized mice or spleens from normal BALB/c mice or normal C3H mice were harvested and treated in vitro with antiαβ TCR MoAb or antiγδ TCR MoAb and C, and were then centrifuged, resuspended and injected i.v. at a dose of 2 × 10⁷ into groups of BALB/c recipients that were challenged on the ears with 2·5% PPD simultaneously. Ear thickness was measured before transfer, and at 24 h after challenge. The mice in group a received lymph node cells treated with C alone; group b received lymph node cells treated with anti-TCR γδm Ab + C; group c received lymph node cells from BALB/c mice contact-sensitized with PPD treated with antiαβ MoAb + C; groups d, e, f received a 1 : 1 mixture of lymph node cells treated with anti-TCR-γδ + C and lymph node cells from sensitized mice or normal spleen cells from normal BALB/c mice or normal C3H mice treated with anti-TCR-αβ + C that were each equivalent to the numbers of the cells in groups b, c, g or h; group d received cells treated with antiγδ TCR MoAb (i.e. αβ T cells) + C from the PPD-sensitized mice which were supplemented with antiαβ TCR MoAb-treated lymph node cells (i.e. γδ T cells) from the PPD-sensitized BALB/c mice; group e received antiγδ TCR MoAb-treated lymph nodes cells (i.e. αβ T cells) from the PPD-sensitized mice which were supplemented with antiαβ TCR MoAb-treated normal spleen cells (i.e. γδ T cells) from the normal BALB/c mice; group f received antiγδ TCR MoAb-treated lymph nodes cells (i.e. αβ T cells) from the PPD-sensitized mice which were supplemented with antiαβ TCR MoAb-treated normal spleen cells (i.e. γδ T cells) from the normal C3H mice; group g received antiαβ TCR MoAb-treated normal spleen cells from the normal BALB/c mice; group h received antiαβ TCR MoAb-treated normal spleen cells from the naive C3H mice. The presented data are the mean values ± s.d. of five mice per group and are representative of three independent experiments. Statistical significance for groups b versus groups a, d, e or f was considered to be present at P < 0·01.
Cytokine mRNA pattern of lymph node cells from PPD-sensitized mice
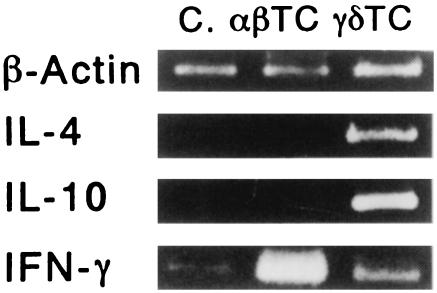
αβ TCR+ cells and γδ TCR+ cells were purified from the lymph node cells of the PPD-sensitized mice using the dynabead method. To determine the cytokine mRNA pattern of these subpopulations, m-RNA was extracted and amplified by the RT-PCR method.
Both expressed IFN-γ mRNA; however, the αβ TCR+ cells expressed IFN-γ mRNA most strongly. The mRNAs of both IL-4 and IL-10 were also detected in the γδ TCR+ cells (Fig. 10).
Fig. 10.
Cytokine mRNA pattern of lymph node cells from PPD-sensitized mice. From the lymph node cells of the mice sensitized with PPD, αβ cells and γδ cells (TCR αβ + cells or TCR γδ + cells > 95%) were sorted out using the Dynabeads technique. To determine the cytokine mRNA pattern of these cells, mRNA was extracted and then amplified by the RT-PCR method. Both the αβ cells (αβ TC) and γδ cells (γδ TC) expressed IFN-γ m-RNA; however, the αβ cells expressed IFN-γ mRNA the strongest. The mRNAs of both IL-4 and IL-10 were detected only in the γδ TCR+ cells. As a negative control, lymph node cells were prepared from non-sensitized mice (C). The presented data are representative of three independent experiments.
DISCUSSION
We established an optimal murine model system for CHS to PPD. The ear swelling reaction with a classic 24–48-h peak effect has been observed previously in mice painted with contact-sensitizing chemicals: TNCB and DNFB [10]. The murine CHS response to PPD was thus the same as that observed, since the maximal ear swelling reaction induced by the passive transfer of PPD-CHS was seen at 24 h after challenge, which is the same as the classic 24-h peak induced by TNCB or DNFB [10].
As PPD is not a strong sensitizer, it has been difficult to establish an animal model. Kligman [11] demonstrated that 10% of 24 subjects exposed to the maximization test of PPD were positive. In 1970, Rajika [5] reported that the intracutaneous sensitization method of PPD showed an unexpectedly high frequency. In 1974, Mangnusson [6] sensitized guinea-pigs to PPD by not only intradermal injections of PPD but also by the topical application of PPD. Recently, Garrigue [7] also attempted to establish murine models for the assessment of the contact-sensitizing properties of various chemicals, including PPD. They demonstrated that the back is a better site than the abdomen for optimal CHS induction; however, a sufficient degree of ear swelling was not achieved by the topical application of PPD on the back.
In a preliminary experiment, we compared three protocols of sensitization using either single, double or three consecutive daily applications of a PPD solution. With a single or double application, the mice were not sufficiently sensitized for PPD at any concentration of PPD solution (data not shown). We therefore used three consecutive doses for our experiments.
In the time-course study, the results of Fig. 1 confirm that the strongest CHS response to PPD was detected on day 5 after the initial sensitization. Garrigue et al. challenged the mice on day 9 after the initial application of PPD, which could be one reason why the optimal response was not achieved in their experiments [7]. We examined the time-course of the early phase of CHS to PPD and observed a strong ear swelling response 24 h after challenge and another statistically significant but smaller ear swelling response only 1 h after challenge with PPD (Fig. 2). These data correlate with the response of CHS to TNCB or DNFB when the biphasic response is observed at 2 h and 24 h after challenge.
To compare the response of CHS to PPD between strains, mice of three strains were sensitized by the topical administration of PPD. BALB/c mice showed the best response to PPD (Fig. 3) whereas the ear swelling response was extremely weak in C57BL/10 mice. It is well known that C57Bl/10 mice are Th1-dominant and IgE-resistant mice. This is one possible reason for the weak response in C57BL/10 mice, since we have already shown that IgE plays an important role in the elicitation of CHS [12].
The results of Fig. 5b confirm that αβ T cells do not act alone to transfer the CHS responses in mice. These observations are consistent with the findings of Ptaks [13], in which CD3+, CD4−, CD8+γδ T cells were found to assist αβ T cells in the adoptive transfer of CHS to PCl. Our study shows that αβ T cells require the assistance of the γδ T cell population. The peak ear swelling response in adoptive CHS transferred with γδ T cells was detected 12 h after challenge; however, the response in those transferred with αβ T cells was observed from 12 h to 24 h. These data suggest that γδ T cells may play a major role in the early phase of PPD induced CHS. On the other hand, αβ T cells may play a major role in the late phase of CHS. The adoptive transfer experiments revealed that the γδ T cells express CD3, CD8 but not CD4. Furthermore, the results of Figs 8 and 9 show that these regulatory γδ T cells are neither Ag-specific nor MHC-restricted and that γδ T cells from normal non-sensitized spleen can also assist αβ T cells in the adoptive transfer of the 24 h CHS response in a non-MHC-restricted manner.
Ptak et al. [13] suggested that three different T cell populations are needed for the induction of CHS to PCl or Oxa: the first population consists of hapten-specific CD4+ αβ TCR+ effector T cells; the second population comprises hapten-specific, non-MHC-restricted, Thy1+, CD5+, CD3−, sIg−, B220+, IL-3R+ CHS-initiating cells, which are needed for local serotonin release; while the third population consists of CD3+, γδ TCR+, CD4−, CD8+ cells which are involved in IL-4 secretion. In agreement with their observations [13], three types of cell populations are needed for the elicitation of CHS to PPD: early response cells, αβ T cells and γδ T cells. The early response at 1 h after challenge was not elicited following challenged immediately after cell transfer. Instead it was delayed until 6 h after challenge. However, when the challenge itself was delayed until 1 day after cell transfer the specific early ear swelling response occurred 1 h after challenge (Fig. 5a). These data support the previous observation of early response cells [8,9]. Van Loveren et al. demonstrated that the time-course of ear swelling responses in recipients that are challenged immediately after transfer differs somewhat from those animals receiving transfer 1 day before challenge, in that the early responses occur somewhat later at 6–12 h after immediate challenge but within 1–2 h after delayed challenge [8,9]. The early 6-h component was undiminished by depleting αβ or γδ T cells. This indicates that the cells which induce the early response express neither αβ TCR nor γδ TCR. The phenotype of the early response cells was Thy1+, B220+, CD3−, CD4−CD5+, CD8−. These data suggest that an early response component and two T cell populations are needed to induce a late phase reaction of CHS to PPD. In line with our data, Ptak et al. demonstrated that passive cell transfer induced both an early (2 h) and a late (24 h) phase response in CHS against PCl and that Thy1+, B220+, CD4−, CD8− but neither αβ T cell nor γδ T cells are required for the early phase reaction, while both αβ T cells and γδ T cells are required for the late phase reaction.
Recently, Salerno et al. [14] also demonstrated that three cell subsets are required for the transfer of delayed type hypersensitivity by using antigen-specific T cell lines. Matsuda et al. [15] reported that IgE antibodies bound to circulating IgE FceR bearing lymphoid cells (most probably basophils), sensitized in vitro, probably mediated the early activation of these circulating basophils to release mediators, thus causing a 5-HT release from cutaneous mast cells, so mediating CHS initiation. We speculate that mast cells mediate the early response to PPD since we could not detect the 1-h early response in mast cell-deficient mice (submitted for publication). It is thus necessary to determine whether or not PPD specific IgE is needed for the early response in PPD CHS.
The role of γδ T cells remains obscure. The population of γδ T cells in the lymph node is about 1–2% based on FACS analysis and a few γδ T cells infiltrated the CHS reaction site (data not shown). These regulatory γδ T cells are neither Ag-specific nor MHC-restricted and γδ T cells in normal spleen can also assist αβ T cells in the adoptive transfer of the 24-h CHS response, in agreement with Askenase's report [16] on PCl specific CHS. Thus γδ T cells may assist with adoptive transfer of CHS-effector αβ T cells by making these effector T cells resistant to suppressor T cells in normal recipients. Salerno et al. [14] also speculated that αβ +, CD4−, CD8−, B220 (CD45R)+, Thy1·2+ cells provided IL-4 and that γδ T cells, after binding to IL-4, augmented IL-4 production in an autocrine way, whose ultimate effect was the localization and subsequent activation of antigen-specific αβ effector T cells at the sites of antigen challenge. In agreement with their data, we found that γδ T, but not αβ T cells, expressed IL-4 mRNA (Fig. 10) and that γδ T cells may play an important role in the early phase of PPD-induced CHS (Fig. 5). Recently, Chomarat et al. [17] demonstrated that γδ T cell clones produced lower levels of IFN-γ and higher levels of IL-4 than αβ T cell clones, which is consistent with our results. Our data thus show that γδ T cells may assist αβ T cells by secreting IL-4, in the manner of Th2 type T cells, in PPD-induced CHS thereby inducing a Th2 response. We did not examine IL-5 expression in γδ T cells; however, γδ T cells may secrete IL-5 since a moderate infiltration of eosinophils was detected.
Recently, many reports [12–21] have demonstrated that not only Th1 cells but also Th2 cells play an important role in the elicitation of CHS. Wang [18] demonstrated that the epicutaneous exposure of protein antigen induces a predominant Th2-like response. Hoskin et al. [22] demonstrated that midrange antigen doses induce the development of Th1 cells, whereas very high and very low antigen doses induce Th2 cells. Very recently, we also reported that STAT6, which plays a crucial role in the induction of Th2 cells, plays an essential role in the elicitation of CHS [12]. In agreement with these reports, our present results summarized that Th2-type γδ T cells may play a major role in the development of PPD elicited CHS; however, in order to clarify the mechanism for the early phase reaction of CHS to PPD, further studies are called for.
Acknowledgments
This work was supported partially by a grant (no. 08670952) from the Ministry of Education, Japan. We also thank Ms Motoko Sekiya for her valuable technical assistance.
REFERENCES
- 1.Fisher AA. Contact dermatitis. 3. Philadelphia: Lea and Febiger; 1986. p. 381. [Google Scholar]
- 2.Edward EK, Jr, Edward EK. Contact urticaria and allergic contact dermatitis caused by paraphenylenediamine. Cutis. 1984;34:87–8. [PubMed] [Google Scholar]
- 3.Calnan CD. Hair dye reaction. Contact Dermatitis Newsletter. 1967;1:16. [Google Scholar]
- 4.Mayer RL. Group-sensitization to compounds of quinone structure and its biochemical basis role of these substances in cancer. Progr Allergy. 1954;4:79. [Google Scholar]
- 5.Rajka G, Blohm SG. The allergenicity of paraphenylenediamine II. Acta Derm (Stockh) 1970;50:51–4. [PubMed] [Google Scholar]
- 6.Magnusson B. The allegenicity of paraphenelenediamine versus that of paratoluenediamine. Contact Dermatitis Newsletter. 1974;15:432. [Google Scholar]
- 7.Garrigue J-L, Nicolas J-F, Fraginals R, Benezra C, Bour H, Schumitt D. Optimization of mouse ear swelling test for in vivo and in vitro studies of weak contact sensitizer. Contact Dermatitis. 1994;30:231–7. doi: 10.1111/j.1600-0536.1994.tb00650.x. [DOI] [PubMed] [Google Scholar]
- 8.Van Loveren H, Maeda R, Askenese PW. An early component of delayed-type hypersensitivity mediated by T cells and mast cells. J Exp Med. 1983;157:1604. doi: 10.1084/jem.157.5.1604. [DOI] [PMC free article] [PubMed] [Google Scholar]
- 9.Van Loveren H, Kato K, Meade R, et al. Characterization of two different Ly-1+ T cell populations that mediate delayed-type hypersensitivity. J Immunol. 1984;133:2402–11. [PubMed] [Google Scholar]
- 10.Asherson GL, Ptak W. Contact and delayed hypersensitivity in the mouse (I). Active sensitization and passive transfer. Immunology. 1968;15:405–16. [PMC free article] [PubMed] [Google Scholar]
- 11.Magnusson B, Kligman AM. The identification of contact allergens by animal assay, the guinea-pig maximization test method. J Invest Dermatol. 1969;52:268–76. doi: 10.1038/jid.1969.42. [DOI] [PubMed] [Google Scholar]
- 12.Yokozeki H, Ghoreishi M, Takagawa S, et al. Signal transducers and activators of transcription 6 (STAT6) is essential in the induction of contact hypersensitivity. J Exp Med. 2000;191:995–1004. doi: 10.1084/jem.191.6.995. [DOI] [PMC free article] [PubMed] [Google Scholar]
- 13.Ptak W, Askenase PW. γδ T cells assist αβ T cells in adoptive transfer of contact sensitivity. J Immunol. 1992;149:3503–8. [PubMed] [Google Scholar]
- 14.Salerno A, Dieli F, Sireci G, et al. Three cell subsets are required for the transfer of delayed-type hypersensitivity reaction by antigen-specific T cell line, Cellular Immunology. 1997;175:157–63. doi: 10.1006/cimm.1996.1034. [DOI] [PubMed] [Google Scholar]
- 15.Matsuda H, Ushio H, Palwal V, Ptak W, Askenase PW. Adoptive cell transfer of contact sensitivity-initiation mediated by nonimmune cells sensitized with monoclonal IgE antibodies: dependence on host skin mast cells. 1995;154:5080–92. [PubMed] [Google Scholar]
- 16.Askenase PW, Szczepanik M, Ptak M, Paliwal V, Ptak W. γδ T cells in normal spleen assist immunized αβ T cells in adoptive cell transfer of contact sensitivity: effect of Bordetella pertussis, cyclophosphamide, and antibodies to determinants on suppressor cells. J Immunol. 1995;154:3644–53. [PubMed] [Google Scholar]
- 17.Chomarat P, Kjeldsen-Kragh J, Quayle A, Natvig JB Miossec Pierre. Different cytokine production profiles of γδ T cell clones: relation to inflammatory arthritis. Eur J Immunol. 1994;24:2087–91. doi: 10.1002/eji.1830240923. [DOI] [PubMed] [Google Scholar]
- 18.Wang L-F, Lin J-Y, Hsieh K-H, Lin R-H. Epicutaneous exposure of protein antigen induces a prominent Th2-like response with high IgE production in mice. J Immunol. 1996;156:4079–82. [PubMed] [Google Scholar]
- 19.Kitagaki H, Fujisawa S, Watanabe K, Hayakawa K, Shiohara T. Immediate-type hypersensitivity response followed by a late reaction is induced by repeated epicutaneous application of contact sensitizing agents in mice. J Invest Dermatol. 1995;105:749–55. doi: 10.1111/1523-1747.ep12325538. [DOI] [PubMed] [Google Scholar]
- 20.Probst P, Kuntzlin D, Fleischer B. Th2-type infiltrating T cells in nickel-induced contact dermatitis. Cell Immunol. 1995;165:134–40. doi: 10.1006/cimm.1995.1196. [DOI] [PubMed] [Google Scholar]
- 21.Steinbrink K, Sorg C, Macher E. Low zone tolerance to contact allergens in mice: a functional role for CD8+ T helper type 2 cells. J Exp Med. 1996;183:759–68. doi: 10.1084/jem.183.3.759. [DOI] [PMC free article] [PubMed] [Google Scholar]
- 22.Hosken NA, Shibuya K, Heath AW, Murphy KM, Garra AO. The effect of antigen doses on CD4+ T helper cell phenotype development in a T cell receptor-αβ-transgenic model. J Exp Med. 1995;182:1579–84. doi: 10.1084/jem.182.5.1579. [DOI] [PMC free article] [PubMed] [Google Scholar]


