Abstract
There is increasing evidence that proinflammatory cytokines contribute to many of the small intestinal features in coeliac disease. The aim of the study was to investigate the expression of two proinflammatory cytokines, migration inhibition factor (MIF) and tumour necrosis factor alpha (TNF-α) in duodenal biopsy specimens from patients with coeliac disease on a gluten-free diet and normal control subjects. A flow cytometric system was used to analyse intracellular protein levels of MIF and TNF-α in freshly isolated cells from duodenal biopsies taken from 12 patients with treated coeliac disease and 10 healthy control subjects. From the biopsy specimens, single cell suspensions of the epithelium and lamina propria were prepared using EDTA/DTT and enzymes. Intracellular cytokine expression was studied in intraepithelial lymphocytes (IELs), lamina propria T cells (LP T) and intestinal epithelial cells using different surface labelling antibodies. MIF protein was constitutively expressed in IELs, LP T cells and epithelial cells from normal intestinal mucosa. In contrast, although TNF-α was found in LP T cells, this cytokine was virtually undetectable in either IELs or epithelial cells. In coeliac disease, intracellular levels of MIF were significantly higher in epithelial cells compared with control subjects (P = 0·005). Raised levels of TNF-α were found in epithelial cells (P = 0·03) as well as IELs (P = 0·045) from coeliac patients compared with controls. The findings from this study show up-regulated expression of MIF and TNF-α in IELs and epithelial cells of histologically normal mucosa in patients with coeliac disease. Increased expression of proinflammatory cytokines in cells occupying the epithelial layer could help explain the rapidity with which the coeliac mucosa may respond to gluten challenge.
Keywords: coeliac disease, flow cytometry, migration inhibition factor, tumour necrosis factor
INTRODUCTION
Coeliac disease (CD) is an inflammatory disease of the small intestinal mucosa in which the lesion of villous atrophy and crypt cell hyperplasia improves on withdrawal of gluten from the diet [1]. Currently, it is suggested that deamidation of gliadin peptides by tissue transglutaminase and subsequent activation of gliadin-specific HLA-DQ2 restricted T cells is central to the disease pathology [2]. Cytokines produced by gliadin-specific T cells may contribute to some of the histological changes including epithelial cell crypt hyperplasia, increased numbers of intraepithelial lymphocytes, enhanced expression of MHC class II antigens as well as activation of T cells and macrophages. Previous studies investigating the role of cytokines suggest that there is an increase in the numbers of cells secreting TNF-α, IL-6 and IFN-γ in the lamina propria of patients with active disease compared with controls [3–5].
TNF-α is a potent proinflammatory cytokine which is produced mainly by activated macrophages and T cells and at high concentrations can influence several parameters of immune and inflammatory activation. Many of the biological properties of TNF-α are mediated in synergy with other cytokines such as IL-1 and IFN-γ [6]. In animal studies, neutralizing the effects of TNF-α inhibits the development of villous atrophy in experimental graft versus host disease [7].
Migration inhibition factor (MIF), a cytokine which was cloned in 1989 [8], has been shown to promote the production of proinflammatory cytokines such as TNF-α. Furthermore, neutralizing the effects of MIF in vitro significantly attenuates TNF-α production [9,10]. MIF was originally described as a T cell derived cytokine which inhibited the random migration of macrophages [11]. More recently, preformed MIF has been found in a wide variety of cell types including the corticotrophic cells of the anterior pituitary gland [12], in monocytes/macrophages [9,13], eosinophils [14] and glomerular epithelial cells [15,16]. MIF is now described as a key modulator of both inflammatory and immune responses. Several proinflammatory properties of MIF have been verified. MIF induces TNF-α and IL-8 secretion by macrophages [17] and can interact with proinflammatory cytokines, such as IFN-γ, to promote macrophage nitric oxide release [18]. Recently, it was suggested that MIF acts in synergy with TNF-α to augment proinflammatory responses in diseases such as adult respiratory distress syndrome [16], sepsis [18] and collagen-induced arthritis [19]. However, information regarding the inflammatory capacity of MIF in gastrointestinal disease is presently unknown.
The techniques employed previously for analysis of proinflammatory cytokines in coeliac disease were in situ hybridization [4,5], immunohistochemistry [3] and ELISPOT [20]. Detection of intracellular cytokines, using flow cytometry, has recently been used in quantification of proinflammatory cytokines in diseases such as malaria [21], inflammatory bowel disease [22] and atopic dermatitis [23]. This technique involves the use of permeabilized cells which together with monoclonal antibodies to cell surface markers can be used to identify the cellular origin of cytokine production. Furthermore, the percentage of cytokine producing cells as well as the amount of cytokine produced per cellular population (median fluorescence intensity (MFI)) may be determined [24]. This methodology offers several advantages over other techniques for analysis of cytokine protein such as Western blotting or ELISAs.
In this study, we have analysed intracellular MIF and TNF-α protein levels in duodenal biopsy specimens from patients with coeliac disease and controls employing flow cytometry. Using this technique, the aims of the study were: to compare levels of MIF and TNF-α separately in intraepithelial lymphocytes and lamina propria T cells from coeliac patients and controls; and to analyse expression of MIF and TNF-α in small intestinal epithelial cells.
PATIENTS AND METHODS
Subject populations
Twelve patients with coeliac disease were studied. The diagnosis was based on a typical histological lesion, positive serology (IgA endomysial and gliadin antibodies) and positive histological and serological response to a gluten free diet. The patients studied were on gluten-free diets for a mean of 3 years (range 2 months−7 years) and showed histological improvement following gluten exclusion. Biopsies from six of these patients (five females: one male; mean age 35 years ± 3·2 s.e.m.; range 17–59) were histologically normal (treated coeliac disease) while the remaining six individuals (four females: two males; mean age 39 years ± 4·4 s.e.m.; range 25–58) showed partial villous atrophy (partially treated coeliac disease). All patients with treated coeliac disease were negative for IgA antibodies to gliadin and endomysium whereas in those with partially treated disease, four were positive for antigliadin antibodies and one for anti-endomysial antibodies. The control group consisted of 10 individuals (six females: four males; mean age 31 years ± 4·2 s.e.m.; range 24–50) undergoing endoscopy for investigation of upper gastrointestinal symptoms. These individuals had a normal small intestinal mucosa on biopsy and subjects displaying any duodenal abnormalities were excluded. Six of these individuals had dyspepsia, two had oesophagitis and two had mild abdominal discomfort. These individuals were negative for antibodies against gliadin and endomysium. Approval for these studies was obtained from the St James's Hospital Ethics Committee.
Preparation of epithelial layer and lamina propria mononuclear cell (LPMC) single cell suspensions
Four duodenal biopsy specimens were used to prepare single cell suspensions suitable for flow cytometric analysis. For each subject, the biopsy specimens were transported within one hour in Ca++/Mg++ free Hanks's buffered salt solution (HBSS, Gibco, Life Technology, Paisley, Scotland, UK). The epithelial layer was removed with 1 mm EDTA (Analar, BDH chemicals Ltd, Pool, UK) and 1 mm dithiothreitol (DTT, Sigma, St Louis, USA). After continuous agitation at 37°C for 45 min, the single cell suspension was pelletted from the supernatant and washed once with 5 ml RPMI-1640 medium (Gibco) supplemented with antibiotic/antimycotic solution (Gibco) and 10% fetal calf serum. To obtain lamina propria mononuclear cells, the remaining tissue was washed twice with RPMI 1640 medium, disrupted with a scalpel and treated with collegenase (type 1 A, Sigma; 128 U/ml in RPMI) for 3 h with continuous agitation at 37°C. After this time, cells from the supernatant were washed twice with RPMI. Finally, the epithelial and lamina propria cell suspensions were resuspended at 1 × 10⁶ cells/ml of RPMI and were kept on ice until stained. Cell number and viability were determined using ethidium bromide/acridine orange staining. Following removal of the epithelial layer with EDTA/DTT, it was shown that (a) the basement memmbrane remains intact, (b) B cells are absent from the epithelial layer single cell suspension and (c) the CD3+ T cells are predominantly CD8+, consistent with an IEL phenotype.
Preparation of peripheral blood mononuclear cells (PBMC)
Venous blood was collected into sterile heparinized tubes, placed on ice and PBMC were separated immediately using Lymphoprep (Nycomed, Oslo, Norway). Cell number and viability were determined using ethidium bromide/acridine orange staining. PBMC were resuspended at a final concentration of 1 × 10⁶ cells/ml in RPMI containing antibiotic/antimycotic solution (Gibco) and 10% heat-inactivated autologous serum.
Detection of intracellular MIF and TNF-α using flow cytometry
Monoclonal antibodies (MoAbs) for MIF (clone 12302·2: R&D Systems, Minneapolis, USA) and TNF-α (clone 28401·11: R&D Systems) were screened for their usefulness in flow cytometry. In preliminary experiments, the specificity of each antibody was verified in absorption experiments using recombinant cytokines (Table 1). Cells were first fixed with 2% paraformaldehyde (PFA) followed by permeabilization with 0·1% saponin (Sigma) in phosphate buffered saline. Non-specific binding sites were blocked by incubating the permeabilized cells with 10% heat inactivated normal human serum (NHS)/saponin. Monoclonal antibodies at 1·25 µg/test (MIF) and 0·2 µg/test (TNF-α) were added to 5 × 10⁴ cells in 100 μl 10% NHS/saponin. Control isotype matched IgG antibodies (R&D Systems) were used in parallel experiments at similar concentrations. FITC or PE-conjugated F′ab goat antimouse polyclonal antibodies (2·0 µg/test: Dako, Glostrup, Denmark) was used to label the MIF, TNF-α and control antibodies. Cells were surface labelled with monoclonal antibodies to CD3 (T cells: Becton Dickinson, Oxford, UK) and Ber-EP4 (epithelial cells: Dako) and were finally fixed in 0·5% paraformaldehyde. Intracellular fluorescence was measured using a Becton Dickinson flow cytometer with CellQuest lysis software.
Table 1.
Specificity of the anti-MIF antibody
| % CD3+ peripheral blood T cells | MIF | |
|---|---|---|
| Anti-MIF | 90 | 63 |
| Anti-MIF + rMIF | 0 | 0 |
| Anti-MIF + rTNF-α | 89 | 67 |
| Anti-MIF + rIFN-γ | 90 | 68 |
| Anti-MIF + rIL-6 | 88 | 59 |
| Anti-MIF + albumin | 88 | 62 |
The monoclonal anti-MIF antibody was incubated (at preoptimized concentrations) with equimolar concentrations of rMIF, rTNF-α, rIFN-γ, rIL-6 (all from R&D systems) or albumin for 30 min. After incubation, intracellular levels of MIF were measured in CD3+ peripheral blood T cells. Only rMIF blocked the binding of the anti-MIF antibody, confirming the specifity. MFI (median fluorescence intensity).
Ten thousand cells were acquired initially and cells visualized on the basis of size (forward scatter) and granularity (side scatter). The control antibody was used to determine the optimum settings for the fluorescence quadrants (FL1/FL2) and to exclude background fluorescence. Results are expressed as the percentage of cytokine-positive cells and differences of < 2% compared with the control antibody were considered not significant. Histograms were generated using the T cell or epithelial cell regions which allowed measurement of intracellular cytokine levels using median fluorescence intensity (MFI). Increases of < 5 MFI values beyond that detected with the control antibody were considered not significant.
Statistical analysis
Analysis of results between patient groups was compared using Mann–Whitney U-test for non-parametric data. P-values < 0·05 were considered not significant. All statistics were performed using Instat software.
RESULTS
Intracellular MIF expression in peripheral blood T cells
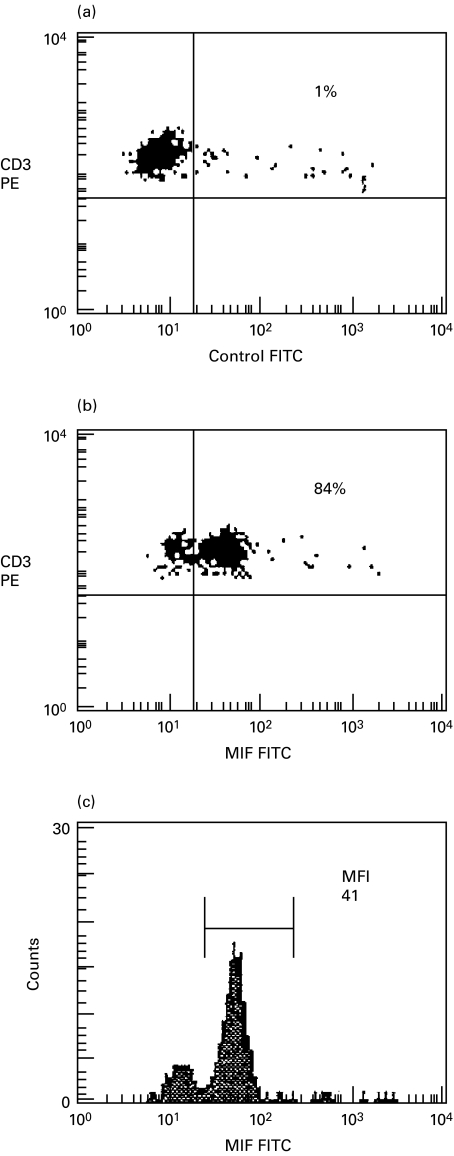
In initial studies, prior to analysis of intestinal cells, intracellular expression of MIF was studied in freshly isolated peripheral blood T cells after fixation/permeabilization using FITC-conjugated anti-MIF or FITC-conjugated control antibodies. The flow cytometric analysis from one representative experiment (a normal control) is illustrated in Fig. 1. In the example shown, 84% of T cells expressed intracellular MIF with a median fluorescence intensity (MFI) value of 41. MIF was detected only in saponin permeabilized and not unpermeabilized T cells, confirming that the signal detected was due to intracellular and not extracellular cytokine. In further experiments, the specificity of the monoclonal anti-MIF antibody was verified since detection was blocked by prior incubation with rMIF (R&D Systems)(> 90% inhibition) but not by rIFN-γ, rIL-6, rTNF-α or albumin (used as a non-specific control protein)(Table 1).
Fig. 1.
Intracellular MIF expression in freshly isolated CD3+ peripheral blood T cells. Peripheral blood T cells were gated on the basis of cell size and granularity (forward scatter and side scatter) after surface labelling with anti-CD3 (PE-conjugated). Fluorescence quadrants were set using an FITC-conjugated control antibody in the dot plot in (a). (b) The percentage of T cells expressing MIF is shown in the upper right quadrant. A histogram illustrating the median fluorescence intensity (MFI) of MIF in the CD3+ T cell population is shown in (c).
Detection of intracellular MIF in different T cell populations
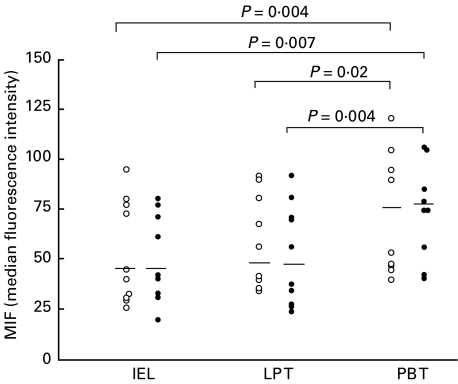
MIF was found to be constitutively expressed in freshly isolated T cell populations from different anatomic sites, namely peripheral blood T cells, IELs and lamina propria T cells. The MFI values reflecting the density of MIF expressed in the gated CD3+ cells are presented in Fig. 2. As illustrated, there was no difference in T cell expression of MIF in coeliac patients compared with control donors, and this was true of peripheral blood T cells (median MFI 75 in coeliac patients versus 72 in controls; P = 0·38), IELs (median MFI 42 in coeliac patients versus 42 in controls; P = 0·57) and lamina propria T cells (median MFI 47 in coeliac patients versus 49 in controls; P = 0·93). In control subjects, MIF levels in peripheral blood T cells were significantly higher than either IELs (P = 0·004) or lamina propria T cells (P = 0·02). Similarly, in coeliac patients peripheral blood T cells levels of MIF were significantly higher than either IELs (P = 0·007) or lamina propria T cells (P = 0·004). In each of the different T cell populations studied, the percentage of T cells positive for MIF ranged from 60 to 85% in both the coeliac patients and the control subjects.
Fig. 2.
Intracellular MIF levels in CD3+ intraepithelial lymphocytes (IELs), lamina propria T cells (LP T) and peripheral blood T cells (PB T) from coeliac patients (•) and control subjects (○). Results are shown as MFI values of MIF and horizontal bars indicate the median levels. P-values illustrate significant differences of PB T cells versus IELs or LP T cells.
Detection of intracellular TNF-α in IELs and LP T cells
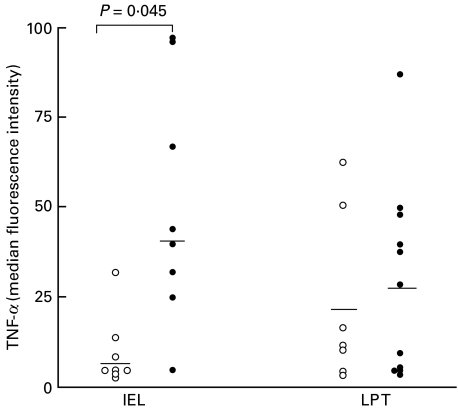
Intracellular expression of TNF-α in the different T cell populations was then investigated in coeliac patients and control donors. In preliminary experiments, the specificity of the monoclonal anti-TNF-α antibody was verified in blocking experiments with rTNF-α (> 85% inhibition) [24] TNF-α was detected only in saponin permeabilized cells, confirming that the signal was due to intracellular and not extracellular cytokine. As can be seen in Fig. 3, TNF-α was detected at only low levels in IELs from control subjects (median MFI 7), whereas in patients with coeliac disease, intracellular TNF-α levels in IELs were significantly higher (median MFI 40; P = 0·045). The percentage of TNF-α positive IELs ranged from 0 to 21% (median 2%) in controls and from 0 to 95% (median 25%) in coeliac patients. In the case of lamina propria T cells, TNF-α levels in coeliac subjects (median MFI 27) were not significantly different from controls (median MFI 21; P = 0·91). The percentage of TNF-α positive LP T cells ranged from 0 to 41% (median 6%) in controls and from 0 to 85% (median 11%) in coeliac patients.
Fig. 3.
Intracellular TNF-α levels in CD3+ intraepithelial lymphocytes (IELs) and lamina propria T cells (LP T) from coeliac patients (•) and control subjects (○). Results are shown as MFI values of TNF-α and horizontal bars indicate the median levels. P-values illustrate significant differences between coeliac patients and controls.
Measurement of intracellular MIF and TNF-α in small intestinal epithelial cells
MIF
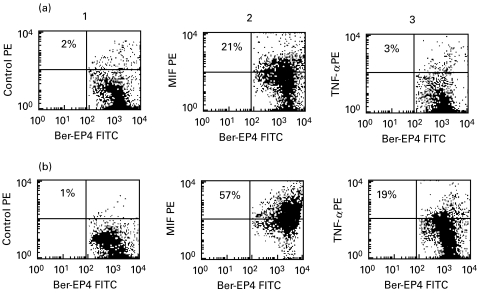
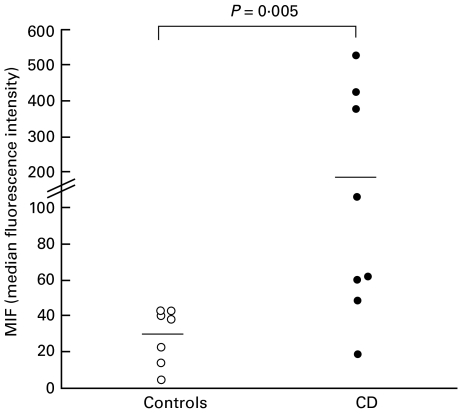
Intracellular cytokine expression was studied in small intestinal epithelial cells using anti-Ber-EP4+ antibody to surface label the cells after fixation and permeabilization. The flow cytometric analysis of intracellular MIF expression from representative coeliac and control individuals are shown in Fig. 4 and MFI values represented in Fig. 5. MIF was constitutively expressed in freshly isolated epithelial cells from normal intestine: the percentage of MIF positive epithelial cells ranged from 12 to 48% (median 28%). In patients with coeliac disease, a higher percentage of epithelial cells expressed MIF (median 46%: range 11–93%) although this did not reach statistical significance (P = 0·38). However, as illustrated in Fig. 5, it was found that the density of MIF expression was significantly increased in coeliac patients (median MFI 177) compared with control subjects (median MFI 31; P = 0·005).
Fig. 4.
Intracellular MIF and TNF-α expression in small intestinal epithelial cells from a control donor (row a) and a coeliac patient (row b). Epithelial cells were surface labelled with FITC-conjugated anti-Ber-EP4 and quadrants set on the basis of an FITC/PE conjugated control antibody. In column 1, the percentage of epithelial cells staining positive for the control antibody (PE-conjugated) is shown in the upper right quadrant. The percentage of MIF or TNF-α positive epithelial cells is shown in the upper right quadrants of the dot plots in columns 2 and 3, respectively.
Fig. 5.
MIF levels in Ber-EP4+ small intestinal epithelial cells in coeliac patients (•) and control subjects (○). Results are shown as MFI values of intracellular MIF and horizontal bars indicate the median levels. P-values illustrate significant differences between coeliac patients and controls.
TNF-α
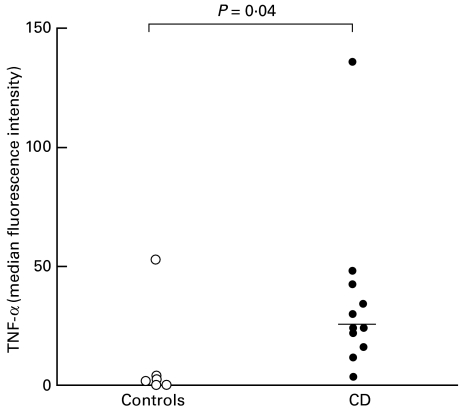
Flow cytometric plots illustrating representative examples of TNF-α expression in Ber-EP4+ epithelial cells from coeliac and control subjects are also shown in Fig. 4. The results for all subjects studied are summarized in Fig. 6. As can be seen, TNF-α was not detected in Ber-EP4+ epithelial cells from normal intestinal mucosa with the exception of one individual. In contrast, analysis of epithelial cells from coeliac intestine revealed intracellular TNF-α expression. In the coeliac subjects studied, the percentage of TNF-α positive cells ranged from 2 to 61% (median 21%; P = 0·02) and MFI values from 2 to 135 (median 23; P = 0·04).
Fig. 6.
TNF-α levels in Ber-EP4+ small intestinal epithelial cells in coeliac patients (•) and control subjects (○). Results are shown as MFI values for intracellular TNF-α expression and horizontal bars indicate the median levels. P-values illustrate significant differences between coeliac patients and controls.
MIF and TNF-α levels were compared in IELs, LP T cells and epithelial cells: no difference was found in intracellular levels in patients with treated coeliac disease (normal or near normal mucosal morphology) compared with partially treated coeliac disease (clear evidence of continued mucosal inflammation) (data not shown).
Measurement of MIF and TNF-α in colonic epithelial cell lines
Intracellular MIF and TNF-α protein levels were then measured in a number of different colonic epithelial cell lines (SW480, HCT, HT-29, LOVO, T84). As illustrated in Table 2, constitutive expression of MIF was found in each of the cell lines studied. The highest levels of MIF were found in LOVO (median MFI 1963) compared with SW 480 (median MFI 417), HCT (median MFI 209), HT-29 (median MFI 1309) or T84 (median MFI 392). TNF-α was not detected in SW 480 or T84, was present in HT-29 (median MFI 46) and not studied in either HCT or LOVO.
Table 2.
Intracellular expression of MIF and TNF-α in colonic epithelial cell lines
| MIF | TNF-α | |||
|---|---|---|---|---|
| % Ber-EP4+ cells | MFI | % Ber-EP4+ cells | MFI | |
| SW 480 | 70 | 417 | 0 | 0 |
| HCT | 43 | 209 | not done | |
| HT-29 | 93 | 1309 | 36 | 46 |
| LOVO | 98 | 1963 | not done | |
| T84 | 79 | 392 | 0 | 0 |
Data show the intracellular expression of MIF and TNF-α protein expression in a number of different colonic epithelial cell lines. The cell lines were grown to confluence, harvested by standard trypsinization and stained for intracellular cytokine expression as described in the Patients and methods. Epithelial cells were surface labelled with anti-Ber-EP4 and the results are shown as the percentage of cytokine positive cells and median fluorescence intensity (MFI). Data is representative of three experiments performed.
DISCUSSION
In this study a flow cytometric method was used to analyse intracellular protein levels of MIF and TNF-α in freshly isolated cells from duodenal biopsies taken from healthy control subjects and patients with treated coeliac disease. In normal subjects, MIF protein was constitutively expressed in all three cell populations studied: intraepithelial lymphocytes (IELs), lamina propria (LP) T cells and small intestinal epithelial cells. In contrast, although TNF-α was detected in normal LP T cells, this cytokine was virtually undetectable in IELs and epithelial cells. In patients with coeliac disease, levels of MIF and TNF-α were raised in the epithelial cells and furthermore, TNF-α expression in IELs was also increased.
This study provides the first description of MIF as a constitutive component in human gastrointestinal mucosa, including local T cell populations. The finding of MIF in human intestine is significant since it is now recognized that MIF acts as a critical regulatory mediator with the capacity to inhibit glucocorticoid anti-inflammatory activity as well as having direct proinflammatory properties [12–19]. The methodology used in this study also identified the presence of TNF-α protein in small intestinal LP T cells in some 50% of normal controls and treated coeliac subjects. Interestingly, in the coeliac patients studied, increased expression of TNF-α was observed in both the IEL and the epithelial cell populations, in marked contrast to the very low levels in normal controls. These are novel findings, since in many earlier studies the precise source of TNF-α in the epithelial layer was not identified and increased expression of this cytokine by specific epithelial cell populations has not been reported. Employing immunohistochemistry, Przemioslo et al. (1994) found low levels of TNF-α in cells of the epithelial layer in both normal and treated coeliac patients and similar TNF-α levels were also found in the lamina propria of both study populations [3].
Several studies now suggest that epithelial cells lining the gastrointestinal tract play a pivotal role in directing immune responses to intestinal luminal antigens [25–29]. We report here the novel observation of increased expression of two important proinflammatory cytokines, MIF and TNF-α in epithelial cells from coeliac mucosa. Furthermore, preliminary results also demonstrated the constitutive expression of MIF but not TNF-α in a number of colonic epithelial cell lines. Previously, authors reported that intestinal epithelial cells are important sources of IL-8 [25], IL-1 [26], IL-6 [27] and IL-15 [28] using freshly isolated cells and intestinal epithelial cell lines. Of interest, epithelial cells are the first host cells to come into contact with gliadin peptides and through the secretion of proinflammatory cytokines may function as an early signalling system to cells of the underlying lamina propria. Notwithstanding these findings, there is considerable evidence which now suggests that deamidation of gliadin peptides and activation of HLA-DQ2 restricted T cells is central to the development of the intestinal lesion [30,31]. Therefore, increased expression of proinflammatory cytokines by intestinal epithelial cells may be a secondary event or possibly a parallel event occurring within the coeliac mucosa.
Lymphocytes which occupy the intestinal epithelial layer, the so-called IELs, form one of the largest T cell populations of the body and despite increasing phenotypic data the precise functional role remains speculative. Increased numbers of IELs, especially cells expressing the γδ T cell receptor are a characteristic finding in gluten sensitive disorders [32]. The cytokine products of IELs give some clue as to their function and other investigators have shown that freshly isolated human IELs constitutively express mRNA for IL-2, IL-8, IFN-γ and TNF-α [33]. The results from this study showing markedly elevated levels of expression of TNF-α in the IELs of coeliac patients suggest that this cytokine may play a role in the pathogenesis of this condition.
Cells located in the lamina propria play a major role in immune protection of the intestine and also in maintaining a controlled (tolerant) response to the multiple antigens to which the gut is exposed. In the study reported here, TNF-α and MIF were detected in T cells freshly isolated from the lamina propria in normal subjects and these findings did not differ from those in the treated coeliac subjects. An interesting finding of this study was that circulating peripheral blood T cells had higher intracellular levels of MIF protein compared with either IELs or LP T cells, and this was true of both coeliac patients and control donors. Differences in cytokine production by T cells from different anatomic sites have previously been described and it is suggested that the local tissue environment may influence the cytokine phenotype of resident T cells [34].
While isolated changes in individual cytokines are unlikely to explain the entire pathological features of the coeliac lesion, an increase in the cellular concentration of MIF and TNF-α in cells of the epithelial layer may be highly relevant, considering the biological function of these cytokines. Recently, several proinflammatory properties for MIF have been verified. MIF promotes TNF-α and IL-8 secretion by human monocytes [16] and can interact with cytokines such as IFN-γ and TNF-α to augment proinflammatory responses [16,17]. The role of TNF-α as a mediator of inflammation is well established [6]. The rapid release of preformed cytokines from intracellular stores may contribute to some of the early features of the coeliac lesion, including expression of HLA-DR on epithelial cells, activation of T cells and monocytes and the increased secretion of prostaglandins within hours of gluten exposure [1]. The results of this study provide new evidence showing that cells occupying the epithelial layer of the treated coeliac mucosa have high levels of proinflammatory cytokines despite normal villous architecture. The data here is consistent with other information concerning the apparent normality of the intestinal mucosa in patients with treated coeliac disease. There is evidence that low grade inflammation persists in these patients following treatment with a gluten-free diet [32].
In conclusion, the findings from the present study document specific cellular locations of the proinflammatory cytokines MIF and TNF-α in duodenal biopsy specimens and demonstrate raised levels of these cytokines in patients with coeliac disease. The results from this study support existing evidence of immune pathological mechanisms in coeliac disease.
REFERENCES
- 1.Marsh MN. The morphology and immunopathology of the jejunal lesion in gluten sensitivity. Eur J Gastro Hepatol. 1991;3:163–8. [Google Scholar]
- 2.Lundin KEA, Scott H, Hansen T, et al. Gliadin-specific, HLA-DQ (α1*0501,β1*0201) restricted T cell isolated from the small intestinal mucosa of celiac disease patients. J Exp Med. 1993;178:187–96. doi: 10.1084/jem.178.1.187. [DOI] [PMC free article] [PubMed] [Google Scholar]
- 3.Przemioslo RT, Kontakou M, Nobili M, et al. Raised pro-inflammatory cytokines interleukin 6 and tumour necrosis factor α in coeliac disease detected by immunohistochemistry. Gut. 1994;35:1398–403. doi: 10.1136/gut.35.10.1398. [DOI] [PMC free article] [PubMed] [Google Scholar]
- 4.Kontakou M, Przemioslo RT, Sturgess RP, et al. Expression of tumour necrosis factor-α, interleukin-6, and interleukin-2 mRNA in the jejunum of patients with coeliac disease. Scand J Gastroenterol. 1995;30:456–63. doi: 10.3109/00365529509093307. [DOI] [PubMed] [Google Scholar]
- 5.Kontakou M, Sturgess RP, Przemioslo RT, et al. Detection of interferon gamma mRNA in the mucosa of patients with coeliac disease by in situ hybridisation. Gut. 1994;35:1037–41. doi: 10.1136/gut.35.8.1037. [DOI] [PMC free article] [PubMed] [Google Scholar]
- 6.Vassalli P. The pathophysiology of tumor necrosis factors. Annu Rev Immunol. 1992;10:411–52. doi: 10.1146/annurev.iy.10.040192.002211. [DOI] [PubMed] [Google Scholar]
- 7.Mowat AM, Garside P. Experimental T lymphocyte mediated enteropathy. In: Feighery C, O'Farrelly C, editors. Gastrointestinal immunology and gluten sensitive disease. Dublin: Oak Tree Press; 1992. pp. 90–8. [Google Scholar]
- 8.Weiser WY, Temple PA, Remold HG, Clark SC, David JR. Molecular cloning of a cDNA encoding a human macrophage migration inhibitory factor. Proc Natl Acad Sci USA. 1989;86:7522–6. doi: 10.1073/pnas.86.19.7522. [DOI] [PMC free article] [PubMed] [Google Scholar]
- 9.Calandra T, Bernhagen J, Mitchell RA, et al. The macrophage is an important and previously unrecognized source of macrophage migration inhibitory factor. J Exp Med. 1994;179:1895–902. doi: 10.1084/jem.179.6.1895. [DOI] [PMC free article] [PubMed] [Google Scholar]
- 10.Bacher M, Metz CN, Calandra T, et al. An essential regulatory role for MIF in T-cell activation. Proc Natl Acad Sci USA. 1996;56:7849–54. doi: 10.1073/pnas.93.15.7849. [DOI] [PMC free article] [PubMed] [Google Scholar]
- 11.Bloom BR, Bennett B. Mechanisms of a reaction in vitro associated with delayed type hypersensitivity. Science. 1966;153:160–5. doi: 10.1126/science.153.3731.80. [DOI] [PubMed] [Google Scholar]
- 12.Bernhagen J, Calandra T, Mitchell RA, et al. MIF is a pitutary-derived cytokine that potentiates lethal endotoxaemia. Nature. 1993;365:756–9. doi: 10.1038/365756a0. [DOI] [PubMed] [Google Scholar]
- 13.Bernhagen J, Bacher M, Calandra T, et al. An essential role for macrophage migration inhibitory factor in the tuberculin delayed-type hypersensitivity reaction. J Exp Med. 1996;183:277–82. doi: 10.1084/jem.183.1.277. [DOI] [PMC free article] [PubMed] [Google Scholar]
- 14.Rossi AG, Haslett C, Hirani N, et al. Human circulating eosinophils secrete macrophage migration inhibitory factor (MIF) J Clin Invest. 1998;101(12):2869–74. doi: 10.1172/JCI1524. [DOI] [PMC free article] [PubMed] [Google Scholar]
- 15.Lan HY, Mu W, Yang N, Meinhardt A, et al. De novo renal expression of macrophages migration inhibition factor during the development of rat crescentic glomerulonephritis. Am J Path. 1996;149:1119–27. [PMC free article] [PubMed] [Google Scholar]
- 16.Donnelly SC, Haslett C, Reid PT, et al. Regulatory role for macrophage migration inhibitory factor in acute respiratory distress syndrome. Nature Med. 1997;3:320–3. doi: 10.1038/nm0397-320. [DOI] [PubMed] [Google Scholar]
- 17.Cunha FQ, Weiser WY, David JR, et al. Recombinant migration inhibition factor induces nitric oxide synthase in murine macrophages. J Immunol. 1993;150:1908–12. [PubMed] [Google Scholar]
- 18.Bacher M, Meinhardt A, Chesney JA, et al. Migration inhibitory factor expresson in experimentally induced endotoxemia. Am J Pathol. 1997;150:235–46. [PMC free article] [PubMed] [Google Scholar]
- 19.Mikulowska A, Metz CN, Bucala R, et al. Macrophage migration inhibitory factor is involved in the pathogenesis of collagen type II-induced arthritis in mice. J Immunol. 1997;158:5514–7. [PubMed] [Google Scholar]
- 20.Breese EJ, Kumar P, Farthing MJ, et al. Interleukin-2 and interferon-γ producing cells in the lamina propria in coeliac disease. Dig Dis Sci. 1994;39:2243. doi: 10.1007/BF02090378. [DOI] [PubMed] [Google Scholar]
- 21.Winkler S, Willheim M, Baiek T, et al. Frequency of cytokine-producing T cells in patients of different age groups with Plasmodium falciparum malaria. J Infect Dis January. 1999;179(1):209–16. doi: 10.1086/314571. [DOI] [PubMed] [Google Scholar]
- 22.Meenan J, Spaans J, Grool TA, et al. Variation in gut-homing CD27-negative lymphocytes in inflammatory colon disease. Scand J Immunol. 1998;48:318–23. doi: 10.1046/j.1365-3083.1998.00387.x. [DOI] [PubMed] [Google Scholar]
- 23.Nakagawa S, Aiba S, Tagami H, et al. Decreased frequency of interferon-gamma-producing CD4+ cells in the peripheral blood of patients with atopic dermatitis. Exp Dermatol. 1998;7:112–8. doi: 10.1111/j.1600-0625.1998.tb00310.x. [DOI] [PubMed] [Google Scholar]
- 24.O'Mahony L, Holland J, Jackson J, et al. Quantitative intracellular cytokine measurment: age related changes in proinflammatory cytokine production. Clin Exp Immunol. 1998;113:213–9. doi: 10.1046/j.1365-2249.1998.00641.x. [DOI] [PMC free article] [PubMed] [Google Scholar]
- 25.Eckmann L, Kagnoff MF, Fierer J. Epithelial cells secrete the chemokine interleukin 8 in response to bacterial entry. Infect Immun. 1993;61:4569–74. doi: 10.1128/iai.61.11.4569-4574.1993. [DOI] [PMC free article] [PubMed] [Google Scholar]
- 26.Jung HC, Eckmann L, Yang SK, et al. A distinct array of proinflammatory cytokines is expressed in human colon epithelial cells in response to bacterial invasion. J Clin Invest. 1995;95:55–65. doi: 10.1172/JCI117676. [DOI] [PMC free article] [PubMed] [Google Scholar]
- 27.Shirota K, LeDuy L, Yuan S, et al. Interleukin-6 and its receptor are expressed in human intestinal epithelial cells. Virchows Arch B. 1990;58:303–8. doi: 10.1007/BF02890085. [DOI] [PubMed] [Google Scholar]
- 28.Reinecker HC, MacDermott RP, Mirau S, et al. Intestinal epithelial cells both express and respond to interleukin 15. Gastroenterology. 1996;111:1706–13. doi: 10.1016/s0016-5085(96)70036-7. [DOI] [PubMed] [Google Scholar]
- 29.Guy-Grand D, DiSanto JP, Henchoz P, et al. Small bowel enteropathy: role of intraepithelial lymphocytes and of cytokines (IL-12, IFN-γ, TNF) in the induction of epithelial cell death and renewal. Eur J Immunol. 1998;28:730–44. doi: 10.1002/(SICI)1521-4141(199802)28:02<730::AID-IMMU730>3.0.CO;2-U. [DOI] [PubMed] [Google Scholar]
- 30.Anderson RP, Degano P, Godkin AJ, et al. In vivo antigen challenge in celiac disease identifies a single transglutaminase-modified peptide as the dominant A-gliadin T cell epitope. Nature Med. 2000;6:337–42. doi: 10.1038/73200. [DOI] [PubMed] [Google Scholar]
- 31.Arentz-Hansen H, Korner R, Molberg O, et al. The intestinal T cell response to alpha-gliadin in adult celiac disease is focused on a single deamidated glutamine targeted by tissue transglutaminase. J Exp Med February. 2000;21(191(4)):603–12. doi: 10.1084/jem.191.4.603. [DOI] [PMC free article] [PubMed] [Google Scholar]
- 32.Kutlu T, Brousse N, Rambaud C, Le Deist F, et al. Numbers of T cell receptor (TCR) αβ+ but not of TcR γδ+ intraepithelial lymphocytes correlate with the grade of villous atrophy in coeliac patients on a long term normal diet. Gut. 1993;34:208–14. doi: 10.1136/gut.34.2.208. [DOI] [PMC free article] [PubMed] [Google Scholar]
- 33.Lundqvist C, Melgar S, Yeung MMW, Hammarström S, Hammarström ML. Intraepithelial lymphocytes in human gut have lytic potential and a cytokine profile that suggest T helper 1 and cytotoxic functions. J Immunol. 1996;157:1926–34. [PubMed] [Google Scholar]
- 34.Daynes RA, Araneo BA, Dowell TA, et al. Regulation of murine lymphokine production in vivo. J Exp Med. 1990;171:979–96. doi: 10.1084/jem.171.4.979. [DOI] [PMC free article] [PubMed] [Google Scholar]


