Abstract
Active Heymann nephritis (HN) is a rat model of human membranous nephropathy. The appearance of T cells within the glomeruli of HN rats suggests a role for these cells in the pathogenesis of the disease. The aims of this study were to investigate T cells infiltrating the glomerulus in HN in Lewis rats by polymerase chain reaction (PCR) of their Vβ chains, CDR3 spectratyping and sequencing. HN was induced in Lewis rats by immunization with renal tubular antigen (Fx1A) in CFA. Kidneys were collected between 4 and 10 weeks. The glomeruli were separated, homogenized and RNA extracted. RT-PCR, CDR3 spectratyping and sequencing were used to further characterize the infiltrating T cells. Multiple Vβ families showed restriction of their CDR3 spectratypes in each animal. Several TCR Vβ families had identical-sized restricted spectratypes across several different animals. Four Vβ families were sequenced. In three of those four families, the dominant clones showed identical sized CDR3 regions and a striking over-expression of Jβ2.6. Further analysis of the CDR3 regions of the Jβ2.6 clones showed a significant restriction of the amino acids at four of the six CDR3 positions. Glomerular T cells bearing similar CDR3 sequences, using Jβ2.6 and expressing at least two, and possibly more, Vβ genes are involved in the pathogenesis of HN.
Keywords: T-cell receptor, T cell, Heymann nephritis, CDR3 spectratyping
Introduction
Active Heymann nephritis (HN) is a rat model of human membranous nephropathy associated with immune deposits in glomeruli, and infiltration of the glomeruli and interstitium by mononuclear cells [1]. The autoantigens thought to be involved in HN are expressed in the glomeruli and have been extensively characterized [2,3]. The appearance of T cells in the glomeruli at 8 weeks, coincident with the development of proteinuria, implies a role for glomerular T cells in the pathogenesis of this disease model [4].
Further evidence for the part played by T cells in HN derives from blocking experiments. Treatment with monoclonal antibodies to CD4 prior to immunization has been shown to completely prevent proteinuria in this model [5], whereas the use of anti-CD8 antibodies abrogates proteinuria. However, the monoclonal antibodies will interfere with T-cell function in the glomeruli, the interstitium and the periphery, so the observation does not provide unequivocal evidence that glomerular T cells in HN recognize and proliferate in response to specific autoantigens.
We have previously described the T-cell receptor (TCR) repertoire in the renal interstitium of HN rats [6]. The aims of this study were to characterize T cells infiltrating the glomeruli in HN in Lewis rats by polymerase chain reaction (PCR) of their Vβ chains, CDR3 spectratyping and sequencing.
Materials and methods
Induction of Heymann nephritis
Extract of renal tubular antigen (Fx1A) was prepared as described previously [7].
Seven-week-old inbred male Lewis rats were obtained from the Animal Resources Centre in Perth, Western Australia. One week after arrival, they were immunized subcutaneously into each of their hind footpads with 15 mg Fx1A emulsified with complete Freund's adjuvant (CFA) containing 1 mg Mycobacterium tuberculosis HRa37 (Difco, Detroit, MI, USA), 100 ml incomplete Freund's adjuvant (IFA) and 100 ml phosphate-buffered saline (PBS). Booster injections of 7·5 mg Fx1A in IFA were given subcutaneously at 2 weeks. Control animals were immunized with the appropriate emulsion prepared without Fx1A.
Animals were killed at 4, 6, 8 and 10 weeks under halothane anaesthesia. Both kidneys were perfused with saline and removed. Samples were placed in OCT, liquid nitrogen and PBS.
Isolation of glomeruli
Glomeruli were isolated as previously described [4,8]. Cortical slices were pressed through a 250 µm stainless steel sieve. The filtrate was then washed through a 150 µm sieve and the glomeruli collected on a 75 µm sieve. They were then rinsed in PBS and purified further by gravity sedimentation. Microscopic examination confirmed purity of over 90% compared with non-glomerular fragments. Glomeruli were processed for RNA extraction and immunoperoxidase staining.
Immunoperoxidase staining
Isolated glomeruli were enzymatically permeabilized for immunoperoxidase staining by incubation at 37°C with a solution of 0·1 mg/ml Collagenase D and 10 mg/ml Soybean Trypsin inhibitor in PBS. The slides were then washed in PBS for 15 min and stained with monoclonal antibodies, followed by HRP-labelled goat anti-mouse IgG (Pharmingen, San Diego, CA, USA). The monoclonal antibodies used were R73 for the αβ TCR, W3/25 for CD4+, OX-8 for CD8+ (Serotec, Oxford, UK) and OX-12 for IgG (Zymed Laboratories, CA, USA).
Extraction of RNA and reverse transcription
Total RNA was extracted from isolated glomeruli using a modification of the method of Chomczynski and Saachi [9]. Samples of glomeruli were dissociated in RNAzol B (Cinna/Biotec, Houston, TX, USA). RNA was then extracted following the standard protocol. The final product was then air dried, dissolved in DEPC-treated water and stored at − 80°C. First strand complementary DNA was synthesized using the M-MLV Reverse Transcription kit (Gibco BRL, Invitrogen Corporation, Carlsbad, CA, USA). A 1µg aliquot of RNA and random hexamer primer was used to prime the reaction.
Primers for rat TCR Vβ genes were published previously [10]. Amplification of the house-keeping gene GAPDH was used as a positive control for intact RNA and efficiency of RT. PCR amplification was performed using a thermal cycler (Perkin Elmer 9600, Applied Biosystems, Foster City, CA, USA). Products were then analysed on a 2% agarose gel. Standard curves of product signal were generated at different PCR cycle numbers in triplicate, and subsequent Vβ repertoires were run at appropriate cycles to ensure no over-amplification of product. The specificity of PCR products was confirmed using QPCR, and individual Vβ gene expression was expressed as a percentage of total TCR signal.
Detection of PCR products by QPCR System 5000
The specificity of each PCR product was verified by separate hybridization with a tris (2,2-bipyridine) ruthenium (II) chelate (TBR)-labelled, sequence-specific, oligonucleotide probe directed at a segment internal to the amplified PCR segment as previously described [; 11,12,13. The electrochemiluminescent signal of the hybridized probe was detected with a QPCR 5000 system (Perkin Elmer) according to manufacturer's recommendations. The relative luminosity of each Vβ family member was expressed as a percentage of the total luminosity in all of the Vβ regions for a given sample.
CDR3 spectratyping of PCR products
A 2 µl volume of PCR product from each Vβ family was then used as cDNA for a second round of PCR. Primers were as before with the addition a Fam-labelled Cβ reverse primer internal to the initial Cβ biotin primer. This proceeded for six to 10 cycles. PCR product (1 µl) from this reaction was sent to the University of New South Wales sequencing facility and run on a Perkin Elmer ABI Prism 373 Sequencer. The results were analysed using Genescan and Genotyper software (Applied Biosystems).
CDR3 spectratyping is a well described method used as a measure of oligoclonality of T cells. PCR products are run on a high resolution sequencing gel along with size standards. The length of a particular product can be determined to one or two mucleotides. A normal splenic sample of a single Vβ family gives a Gaussian distribution of 6–11 peaks each separated by three nucleotides. Oligoclonal T cells give fewer peaks in a restricted distribution. Single clones give a single peak. This method can be used to screen PCR products efficiently for the possible presence of T-cell clones of similar CDR3 size across different animals, without the need to sequence all the different products. Sequencing is used later to confirm spectratyping results.
Cloning and sequencing of PCR products
PCR products of interest were purified using a Lifetech Concert PCR purification kit (Life Technologies, Invitrogen Corporation) and cloned into the p-Bluescript SK-T vector. Plasmid DNA was recovered using the Lifetech Concert Miniprep kit (Life Technologie, Invitrogen Corporation). Sequencing was performed by the Sydney University Prince Alfred Macromolecular Analysis Centre using the dye-labelled dideoxy chain determination method with the PE Biosystems ABI Prism 377 Sequencer (Applied Biosystems).
Results
Development of Heymann nephritis
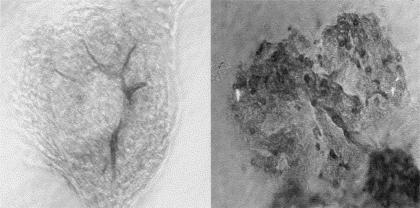
All of the rats immunized with Fx1A developed active HN. Proteinuria developed at 8 weeks and increased to 10 weeks in test animals. Control animals did not develop proteinuria. Test animals developed typical changes of active HN, with deposition of IgG along glomerular capillary loops and mononuclear cell infiltration of the renal interstitium. Approximately 30 000 glomeruli were obtained from each animal with a purity of over 90%. Staining with anti-CD4 and anti-CD8 antibodies revealed the presence of T cells within the glomeruli as shown in Fig. 1.
Fig. 1.
Immunoperoxidase staining using monoclonal anti CD4 antibody followed by an HRP-labelled goat anti-mouse IgG antibody. HN glomerulus (right) shows a heavy infiltrate of cells. Control glomerulus shown on the left. Magnification × 400.
No Vβ TCR family was significantly over-expressed
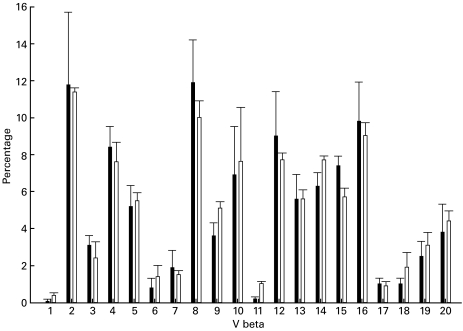
Various individual animals displayed over-representation of single Vβ families, but no single TCR family was over-expressed in multiple animals at any stage of the disease. In Fig. 2, the relative expression of TCR Vβ families at 4 weeks reveals an apparently polyclonal T-cell infiltrate.
Fig. 2.
Expression of Vβ TCR genes at 4 weeks after induction of HN shows no significant difference with expression in Lewis rat spleen. (▪), HN glomeruli; (□), spleen.
Multiple restricted CDR3 spectratypes present in each animal
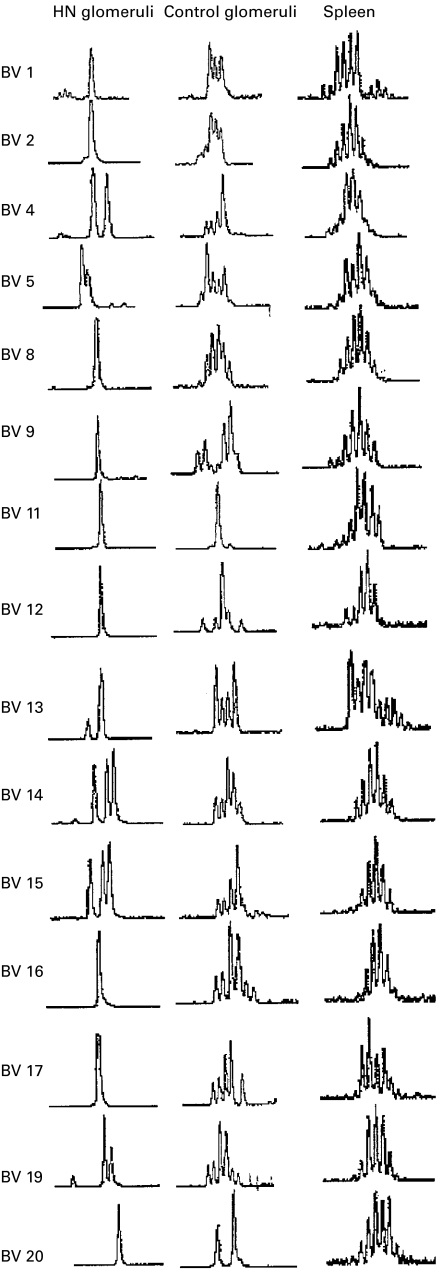
Spectratyping of glomerular PCR products showed widespread restriction of the normal Gaussian distribution of CDR3 sizes. Across the 20 different Vβ families of the rat, there was an average of 11 abnormal peaks, each within a restricted spectratype. An example of the spectratype results from a single animal are shown in Fig. 3.
Fig. 3.
CDR3 spectratypes from a single animal with HN compared with those of a single control animal and spleen. The HN glomeruli showed marked restriction of multiple Vβ families. Control glomeruli also showed some restriction in their spectratypes but to a lesser degree than found in HN.
Several Vβ TCR families have identical spectratypes in different animals
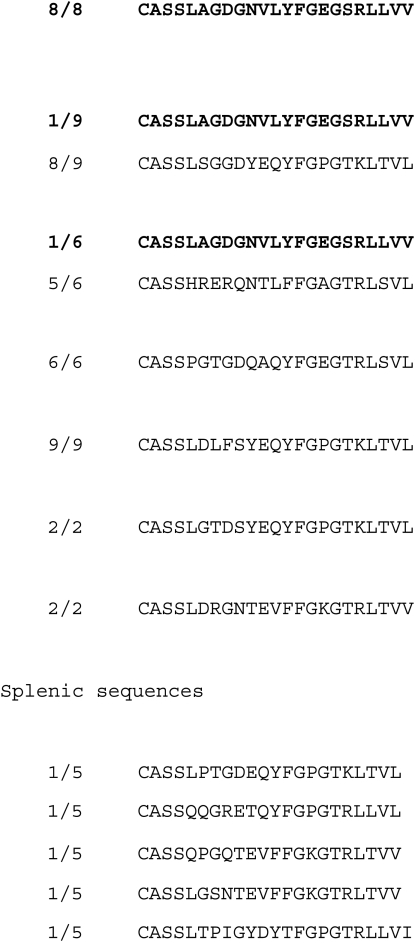
Identical sized CDR3 spectratypes were found in several different animals for eight Vβ families. In Vβ5, eight animals showed an abnormal peak in their CDR3 spectratype measuring 382/3 base pairs. Other common spectratypes were present in fewer animals (seven animals for Vβ7, six for Vβ8, 13, 14, 19 and 20, five for Vβ6). The spectratypes of interest from Vβ5, 7, 8 and 13, as the most commonly occurring families, were then sequenced. The spectratypes for Vβ5 are shown in Fig. 4 and the corresponding sequences of the correct length in Fig. 5.
Fig. 4.
Vβ5 CDR3 spectratypes from six different HN rats show a common restricted size peak at 382/3 with little or no other signal present.
Fig. 5.
Vβ5 sequences from seven individual HN animals compared with splenic sequences. The public response is in bold.
Small public response
A small public response was demonstrated in that sequences from three animals were identical. The sequence Vβ5-LAGDG-Jβ1.3 was present as a strong clone (8 of 14) in animal 91. In two other animals, the identical sequence was present but in lower numbers (1 of 9). These sequences are shown in bold in Fig. 5.
Clones of interest in Vβ5, 7 and 13 had identical CDR3 size
Sequencing the PCR products of interest demonstrated oligoclonal expansion of T cells, which reflected the restriction in CDR3 length suggested by the spectratyping results; the more peaks present in the spectratype, the broader the distribution of CDR3 lengths found on sequencing.
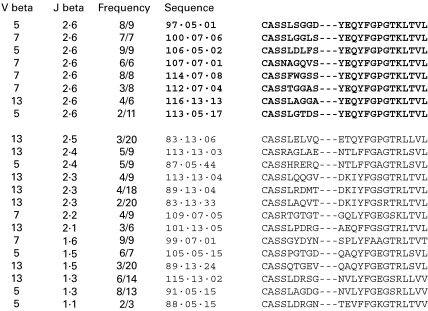
In TCR families Vβ5, 7 and 13, the sequences with CDR3 lengths in common across multiple animals were nine amino acids in length. CDR3 lengths are expressed as the number of amino acids from the final serine of the Vβ to the first phenylalanine of the Jβ (exclusive). These sequences, their clonality and Jβ are shown in Fig. 6.
Fig. 6.
Sequences from T-cell clones isolated from HN glomeruli. Clones bearing Jβ2.6 are in bold.
Over-expression of Jβ2.6 in glomerular clones
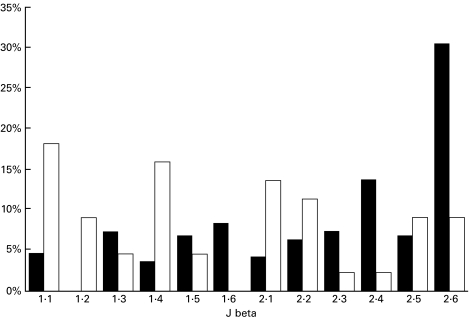
Figure 6 shows that many of the HN clones expressed Jβ2.6. A comparison with normal Jβ2.6 expression in Lewis rat spleen is shown in Fig. 7. There was a striking over-expression of Jβ2.6 in HN glomerular T-cell clones.
Fig. 7.
Jβ repertoire of HN clones (▪) show a striking over-expression of Jβ2.6 when compared with splenic sequences (□).
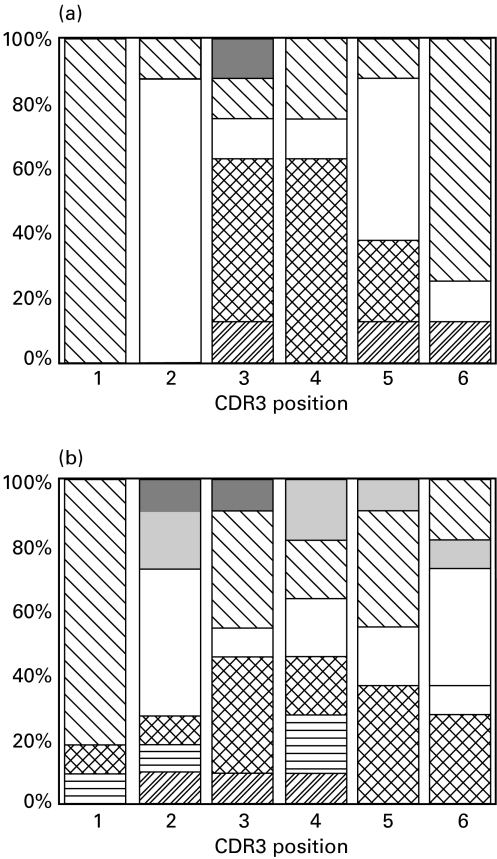
Reasoning that these clones may all be responding to the same antigen, we examined their CDR3 sequences in more detail using a profile technique first used by Candeias et al. [14]. Amino acid residues are grouped together according to their properties as A, acidic (aspartate, glutamate), B, Basic (lysine, arginine, histidine), H, Hydrophobic (leucine, isoleucine phenylalanine, methionine, valine, alanine), L, Polar (glutamine, asparagine, threonine, serine), G glycine, P proline, W tryptophan, and Y tyrosine. Each position in the CDR3 sequences from the Jβ2.6 clones was classified and a profile generated. This profile was compared with that generated by analysis of splenic sequences of the same size. The result is shown in Fig. 8. The profile of the Jβ2.6 clones is markedly altered when compared with spleen. Positions 1, 2, 4 and 6 are more restricted in the HN clones, and this difference was significant on χ2 analysis (P < 0·05).
Fig. 8.
Profiles of six CDR3 positions in HN clones (a) compared with the same positions in splenic sequences (b) of the same length. Amino acids are grouped according to their properties as A acidic ( ), B basic (
 ), H hydrophobic (□), L polar (▪), G glycine
  , P proline
  , W tryptophan
 and Y tyrosine
  . Positions 1, 2, 4 and 6 of the CDR3 profile of the HN clones shows clear restriction when compared with splenic sequences of the same length (P < 0·05).
Discussion
Glomerular T cells are shown here to be present during the development of HN as reported previously [4]. PCR shows a broad representation of Vβ TCR families with no specific family over-represented. Subsequent CDR3 spectratyping demonstrated the presence of multiple oligoclones, many of which shared identical CDR3 sizes across different animals. Sequencing of a subset of these clones found multiple clones with the same sized CDR3 in several Vβ families expressing Jβ2.6. HN clones strikingly over-expressed Jβ2.6 when compared with spleen. A small public response was demonstrated in three animals.
Further examination of the sequences of the Jβ2.6 HN clones showed a restricted CDR3 profile compared with splenic sequences of the same size, suggesting that this population of T cells may be stimulated by a small set of peptide:MHC complexes.
These data suggest that T cells responding to antigens in the glomerulus are involved in the pathogenesis of HN. The autoantigens described for HN include the large cell surface glycoprotein receptor, megalin, and a smaller receptor-associated protein (RAP). Megalin is a multiligand-binding endocytic receptor expressed in clathrin-coated pits at the surface of several epithelia, including the proximal tubule and the glomerulus. This antigen contains multiple epitopes linked to the development of HN [2]. We have demonstrated that T cells in HN rats recognize specific peptidic antigens in the RAP [9].
Our data demonstrate that multiple Vβ genes are involved in the pathogenesis of HN. There could be a number of reasons for this. First, the induction of HN involves reaction to a number of proteins, each of which may contain several T-cell epitopes. Each epitope may also stimulate more than one Vβ gene. Previous studies of HN have measured involvement of a particular Vβ gene by its over-expression in semi-quantitative PCR [6,11]. CDR3 spectratyping was a method reserved for only those genes found to be significantly stronger on PCR than others. This study takes a different approach, looking at all Vβ genes regardless of level of PCR signal, and finds good evidence of oligoclonality in T cells that would previously have been passed over. This suggests that the immune reaction in HN is more complex than previously thought, with multiple Vβ genes involved in clonal expansion. The presence of multiple epitopes means that the situation is difficult to interpret, and the likelihood of epitope spreading during the course of the disease further compounds the analysis. However, the breadth of the T-cell repertoire at 4 weeks suggests that this picture is due less to epitope spreading than to the extensive network of T-cell responses to the main Heymann antigens.
Studies of other diseases, such as experimental autoimmune encephalomyelitis (the mouse model of multiple sclerosis), have shown over-expression of a particular Vβ gene, which has subsequently been shown to contain pathogenic T-cell clones [15]. However, this has been difficult to demonstrate in human diseases. More often than not, several Vβ genes are found to be over-expressed in a disease within a single individual, and different genes are expressed in different patients. This has been shown to be the case for rheumatoid arthritis [16], psoriasis [17], Crohn's disease [18], pulmonary sarcoidosis [19], giant cell arteritis [20] and others. A study on giant cell arteritis even found differing Vβ expression in discrete inflammatory lesions in a single patient. If the Vβgene is not always a critical point of contact with the peptide MHC complex, then the same immune reaction could be generated with different Vβ genes on the same genetic background or even within the same individual. Thus, in our model, identical animals have the potential to produce diverse Vβ repertoires from a single antigen.
The nature of the peptide autoantigen being presented may dictate whether single or multiple Vβ genes are expressed in clonally-expanded T cells. Recent work on crystal structures of MHC peptide TCR complexes [21] shows Vα to be an anchor to the MHC helices, Jβ to occupy the Vα/Vβ interface and Vβ to bind both to the MHC and to the peptide via its CDR3 region. Studies of the human TCR/Tax/HLA A2 complex, however, showed that the CDR3β pushes the TCR away from the MHC, resulting in fewer TCR Vβchain contacts with the MHC helices. This suggests that the important parts of the βchain are the Jβ, at the Vα/Vβ interface, and the CDR3 region, since the rest of the molecule appears to have little contact with the stimulating complex. It is therefore entirely possible to generate the same immune response using different Vβ genes but the same Jβ and similar CDR3 regions. In our model, we have demonstrated a subset of glomerular T cells which shares similar CDR3 properties, uses Jβ2.6 and expresses different Vβ genes. We speculate that they are all responding to the same antigen.
Conclusion
These data show that glomerular T cells using Jβ2.6 and a restricted set of CDR3 sequences in the context of at least two (but probably more) Vβ genes are involved in the pathogenesis of HN in the Lewis rat. We intend to use these observations to create new TCR-specific interventions to modify the course of this disease.
Acknowledgments
This work was supported by the New Children's Hospital Fund. We would like to thank Dr Luana Ferrara and the staff of the animal house at the Children's Medical Research Institute for their assistance in caring for the animals.
References
- 1.Heymann W, Hackel DB, Harwood S, Wilson SGF, Hunter JLP. Production of nephrotic syndrome in rats by Freund's adjuvants and rat kidney suspensions. Proc Exp Biol Med. 1959;100:660–4. doi: 10.3181/00379727-100-24736. [DOI] [PubMed] [Google Scholar]
- 2.Yamazaki H, Ullrich R, Exner M, et al. All four putative ligand-binding domains in megalin contain pathogenic epitopes capable of inducing passive Heymann nephritis. J Am Soc Nephrol. 1998;9:1638–44. doi: 10.1681/ASN.V991638. [DOI] [PubMed] [Google Scholar]
- 3.Ellgaard L, Holtet TL, Moestrup SK, Etzerodt M, Thogersen HC. Nested sets of protein fragments and their use in epitope mapping: Characterization of the epitope for the S4D5 monoclonal antibody binding to receptor associated protein. J Immunol Methods. 1995;180:53–61. doi: 10.1016/0022-1759(94)00298-b. 10.1016/0022-1759(94)00298-b. [DOI] [PubMed] [Google Scholar]
- 4.Penny MJ, Boyd RA, Hall BM. Role of T cells in the mediation of Heymann nephritis. II Identification of Th1 and cytotoxic cells in glomeruli. Kidney Int. 1997;51:1059–68. doi: 10.1038/ki.1997.148. [DOI] [PubMed] [Google Scholar]
- 5.Quiza CG, Leenaerts PL, Hall BM. The role of T cells in the mediation of glomerular injury in Heymann nephritis in the rat. Int Immunol. 1992;4:423–32. doi: 10.1093/intimm/4.4.423. [DOI] [PubMed] [Google Scholar]
- 6.Wu H, Zhang GY, Knight JF. T cell receptor BV gene usage in interstitial cellular infiltrated in active Heymann nephritis. Nephrol Dial Transplant. 16:1374–81. doi: 10.1093/ndt/16.7.1374. [DOI] [PubMed] [Google Scholar]
- 7.Edington TS, Glassock RJ, Dixon FJ. Autologous immune complex nephritis induced with renal tubular antigen. I. Identification and isolation of the pathogenetic antigen. J Exp Med. 1968;127:555–71. doi: 10.1084/jem.127.3.555. [DOI] [PMC free article] [PubMed] [Google Scholar]
- 8.Striker GE, Striker LJ. Glomerular cell culture. Lab Invest. 1985;53:122–31. [PubMed] [Google Scholar]
- 9.Chomcynski P, Sacchi N. Single step method of RNA isolation by acid guanidinium thiocyanate-phenol-chloroform extraction. Analyt Biochem. 1987;162:152–9. doi: 10.1006/abio.1987.9999. [DOI] [PubMed] [Google Scholar]
- 10.Gold DP, Vainiene M, Celnik B, et al. Characterization of the immune response to a secondary encephalitogenic epitope of basic protein in Lewis rats. II. Biased T cell receptor Vβ expression predominates in spinal cord infiltrating T cells. J Immunol. 1992;148:1712–7. [PubMed] [Google Scholar]
- 11.Wu H, Zhang G, Knight JF. T cell lines specific for a synthetic Heymann nephritis peptide derived from receptor-associated protein. Clin Exp Immunol. 2000;121:157–64. doi: 10.1046/j.1365-2249.2000.01262.x. 10.1046/j.1365-2249.2000.01262.x. [DOI] [PMC free article] [PubMed] [Google Scholar]
- 12.DiCesare J, Grossman B, Katz E, et al. A high sensitivity electrochemiluminescence based detection system for automated PCR product quantitation. Biotechniques. 1993;15:152–7. [PubMed] [Google Scholar]
- 13.Wu H, Zhang GY, Clarkson AR, et al. Conserved T cell receptor β chain CDR3 sequences in IgA nephropathy biopsies. Kidney Int. 1999;55:109–19. doi: 10.1046/j.1523-1755.1999.00243.x. 10.1046/j.1523-1755.1999.00243.x. [DOI] [PubMed] [Google Scholar]
- 14.Candeias S, Waltzinger C, Benoist C, Mathis D. The Vβ 17 T cell repertoire: skewed Jβ usage after thymic selection; dissimilar CDR3s in CD4+ versus CD8+ cells. J Exp Med. 1991;174:989–1000. doi: 10.1084/jem.174.5.989. [DOI] [PMC free article] [PubMed] [Google Scholar]
- 15.Tsuchida M, Matsumoto Y, Hirahara H, Hanawa H, Tomiyama K, Abo T. Preferential distribution of Vβ 8.2-positive cells in the central nervous system of rats with myelin basic protein induced autoimmune encephalomyelitis. Eur J Immunol. 1993;23:2399. doi: 10.1002/eji.1830231004. [DOI] [PubMed] [Google Scholar]
- 16.Sottini A, Imberti L, Gorla R, Cattaneo R, Primi D. Restricted expression of TCR Vβ but not Vα genes in rheumatoid arthritis. Eur J Immunol. 1991;21:461–6. doi: 10.1002/eji.1830210231. [DOI] [PubMed] [Google Scholar]
- 17.Prina JC, Vollmer S, Boehncke WH, Menssen A, Laisney I, Trommler P. Selection of conserved TCR VDJ rearrangements in chronic psoriatic plaques indicates a common antigen in psoriasis vulgaris. Eur J Immunol. 1999;29:3360–8. doi: 10.1002/(SICI)1521-4141(199910)29:10<3360::AID-IMMU3360>3.0.CO;2-G. 10.1002/(sici)1521-4141(199910)29:10`3360::aid-immu3360b3.3.co;2-7. [DOI] [PubMed] [Google Scholar]
- 18.Gulwani-Akolkar B, Akolkar PN, Minassian A, McKinley M, Fisher S, Silver J. CD4+ cell oligoclonality in Crohn's disease: Evidence for an antigen-specific response. Hum Immunol. 1996;48:114–24. doi: 10.1016/0198-8859(96)00079-1. [DOI] [PubMed] [Google Scholar]
- 19.Vissinga C, Springmeyer S, Concannon P. TCR expression and clonality analysis in pulmonary sarcoidosis. Hum Immunol. 1996;48:98–106. doi: 10.1016/0198-8859(96)00078-x. 10.1016/0198-8859(96)00078-x. [DOI] [PubMed] [Google Scholar]
- 20.Weyand CM, Schonberger J, Oppitz U, Hunder N, Hicok K, Goronzy J. Distinct vascular lesions in Giant Cell Arteritis share identical T cell clonotypes. J Exp Med. 1994;179:951–60. doi: 10.1084/jem.179.3.951. [DOI] [PMC free article] [PubMed] [Google Scholar]
- 21.Garboczi D, Ghosh P, Utz U, Fan Q, Biddison W, Wiley D. Structure of the complex between human T cell receptor, viral peptide and HLA-A2. Nature. 1996;384:134–41. doi: 10.1038/384134a0. [DOI] [PubMed] [Google Scholar]


