

Abstract
We have reported that tyrosine phosphorylation and expression of the T cell receptor zeta chain (TCR ζ) was decreased in two systemic lupus erythematosus (SLE) patients with an abnormal TCR ζ lacking exon-7. To examine further the TCR ζ defect and any possible relationship with specific clinical features, we studied the expression of TCR ζ in peripheral blood T cells from 44 patients with SLE, 53 with other rheumatic diseases (30 rheumatoid arthritis (RA), 11 systemic sclerosis (SSc) and 12 primary Sjögren's syndrome(SjS)) and 39 healthy individuals. Flow cytometric analysis demonstrated a significant decrease in the expression of TCR ζ in SLE (P < 0·001), but not in the other rheumatic diseases. Immunoprecipitation experiments confirmed that the expression of TCR ζ in SLE T cells was decreased dramatically (normal: 111·4 ± 22·6%, SLE: 51·6 ± 37·4%, P < 0·0001). The decrease in TCR ζ did not correlate with disease activity, or with the dose of prednisolone (PSL). There were, however, three SLE patients in whom the level of TCR ζ expression normalized after treatment, suggesting that mechanisms responsible for the TCR ζ defect appear to be heterogeneous. These results confirm the defective expression and altered tyrosine phosphorylation of TCR ζ in a large proportion of SLE patients, suggesting that it may play an important role in T cell dysfunction in SLE.
Keywords: autoimmunity, signal transduction, TCR-zeta chain, tyrosine phosphorylation
INTRODUCTION
Systemic lupus erythematosus (SLE) is an autoimmune disease of unknown aetiology [1–3]. The disease is characterized by a large number of immunological abnormalities, which appear to result from defects in T cells, B cells and monocytes [4,5]. T cells are considered to be central in the pathogenesis of SLE because dysfunction of regulatory T cells may be responsible for altered immune responses and overproduction of pathogenic autoantibodies [6]. Abnormalities of peripheral blood T cells from SLE patients include T lymphocytopenia, low proliferative responses to lectin, anti-CD3 and anti-CD2 stimulation [7,8] and decreased production of Th-1 type cytokine such as IL-2 [9–11]. Although the co-stimulatory pathway is up-regulated, the TCR-CD3 pathway appears to be down-regulated [12,13]. The precise molecular mechanisms underlying these defects of the TCR-CD3 pathway in SLE T cells have now been unveiled. SLE T cells can regain a normal level of proliferation when stimulated with phorbol ester [14], a direct activator of PKC (protein kinase C), suggesting that defects may reside in the proximal signal transduction molecules located upstream from PKC [15,16]. Deficient type I kinase A isozyme activity [17], defective cAMP-dependent phosphorylation [18] and decreased CD45 protein tyrosine phosphatase (PTPase) activity have been reported in SLE T cells [19]. However, it remains to be determined whether the TCR/CD3 complex itself could be responsible for the altered function of SLE T cells. Stimulation of T cells via TCR leads to a cascade of well-regulated intracellular events [20,21]. In particular, tyrosine phosphorylation is the earliest signalling event preceding phosphatidylinositide turnover, increases in cytoplasmic free calcium and late activation events [20,22,23]. It was shown that ligation of the TCR/CD3 complex results in aberrant tyrosine phosphorylation of mutiple substrates in SLE T cells [24–26]. Recently, we found defective tyrosine phosphorylation and expression of the TCR ζ chain in two SLE patients, both of whom had an aberrant form, lacking exon 7 [25]. The TCR ζ chain has a crucial role in signal transduction through the TCR/CD3 complex [27–29], and in efficient transport of the assembled TCR complexes to the cell surface [30]. Herein, we studied extensively the expression of the TCR ζ chain in a variety of rheumatic diseases, and characterized the features associated with defective expression of the TCR ζ chain.
MATERIALS AND METHODS
Patients and blood donors
Forty-four unrelated Japanese patients (mean age ± s.d.: 34 ± 11 years, range 19–59 years, all female) who met the revised ACR classification criteria for SLE [31] were included. Disease activity was evaluated at blood sampling according to SLE disease activity index (SLEDAI) [32]. The SLEDAI of patients included in this study ranged from 0 to 18 with a mean of 53. The disease in patients with a SLEDAI score of 10 or more was defined to be active, and inactive in patients with a score of less than 10 [19]. An additional sample of 53 patients (44 females, nine males) with other rheumatic diseases and 39 healthy volunteers (29 females, 10 males) was also studied as controls. Of the 53 patients, 30 had rheumatoid arthritis (RA), 11 systemic sclerosis (SSc) and 12 primary Sjögren's syndrome (SjS). The age ranges were similar to those of the SLE group. Informed consent was obtained from all patients. The presence or absence of clinical characteristics throughout the disease course of the patients was judged by three expert physicians at Saitama Medical School through review of the clinical charts. The laboratory tests, the dose of prednisolone and the SLEDAI were those at the time of the blood sampling.
Five of the SLE patients were being treated with non-steroidal anti-inflammatory drugs. All others, except for four active SLE patients with no prednisolone (PSL) treatment, were receiving low to intermediate doses of PSL (5–15 mg/day). Twelve of 53 patients with other rheumatic diseases were taking low doses of PSL (5–12·5 mg/day). In those SLE patients from whom blood samples were taken more than once, data from the first successful experiment were used for statistical analysis.
Cells and antibodies
Peripheral blood lymphocytes (PBL) were isolated by the Ficoll-Hypaque gradient centrifugation method and enriched in T cells as described previously [33]. Murine monoclonal antibodies (MoAb) to CD3 (UCTH-1: IgG1), CD4 (T4: IgG1), CD8α (T8: IgG1), TCR ζ (TIA-2: IgG1) [25], CD45RA (2H4: IgG1) and CD45RO (UCHL1: IgG2a) (from Coulter Immunology, Hialeah, FL, USA), TCR α/β (WT31: IgG1), TCR γ/δ (Anti-TCR-γ/δ: IgG1) and CD45 (Anti-Hle-1: IgG1) (from Becton Dickinson, San Jose, CA, USA) were used. The F(ab′)2 fragment of goat antimouse antibody for cross-linking of CD3 and CD4 was obtained from Biosource Internationals Inc. (Camarilo, CA, USA). Antiphosphotyrosine MoAb labelled with horseradish peroxidase (RC20H) was purchased from Transduction Laboratories (Lexington, KY, USA).
Cell activation and tyrosine phosphorylation experiments
Freshly isolated T cells were incubated with anti-CD3 and anti-CD4 MoAb at 15 μg/ml for 30 min on ice, followed by cross-linking with goat antimouse antibody at a 1:100 dilution at 37°C for 1 min [33]. The cells were treated with a lysis buffer composed of 1% NP-40, 0·15m NaCl, 10 mm EDTA, 1 mm PMSF, 10 mm Tris-HCl and 1 mm Na3Vo4[33]. The lysate was subjected to SDS-polyacrylamine gel electrophoresis (PAGE), transferred to a PVDF membrane and immunoblotted using antiphosphotyrosine MoAb (RC20H) or anti-TCR ζ MoAb as described below.
Flow cytometric analysis
PBL were stained with FITC- or PE-labelled MoAbs for 30 min on ice, followed by extensive washing. Immunofluorescent analysis was performed on a FACScan flow cytometer (Becton Dickinson Immunocytometry System, San Jose, CA, USA) [34]. For staining of TCR ζ, PBL were permeabilized by digitonin to detect the intracellular epitope by MoAb [35]. After fixing in 0·5% formaldehyde overnight on ice, the cells were incubated with 10 μg/ml digitonin (Sigma Chemical Co.) for 5 min on ice. Efficiency of permeabilization was confirmed by trypan blue exclusion (consistently >95%). Cells were stained with 3 μl of FITC-labelled anti-TCR ζ antibody (TIA-2) with or without anti-CD4-PE, or anti-CD8-PE for 30 min, followed by FACScan analysis using consort-30 software. Individual histograms were derived from the analyses of 5000 cells.
Immunoprecipitation and immunoblotting
Immunoprecipitation was performed with the indicated MoAb (TIA-2, 5 μl) adsorbed to 20 μl of protein G-sepharose (Pharmacia Biotech, Sweden) overnight at 4°C [25]. Immunoprecipitated proteins were separated by 15% SDS-PAGE and transferred to a PVDF membrane (Millipore, Bedford, MA, USA). To verify the equal protein levels in each lane, the PVDF membranes were stained with Ponceau S (Sigma Chemical Co.) before blocking. After destaining, the membranes were soaked with blocking agents (Blockace, Dainippon Pharmaceuticals, Tokyo, Japan) for 1h at room temperature, following which the membranes were immunoblotted using mouse anti-ζ MoAb (TIA-2) at 1:1500, washed and incubated with antimouse Ig conjugated with HRP (Amersham, Buckinghamshire, UK) at 1:1000 for 60 min at 37°C. Finally, proteins were detected using chemiluminescence enhancing reagents (Amersham, Buckinghamshire, UK) and visualized on ECL X-ray films. Quantities of TCR ζ protein were determined by measuring the density of the ζ bands on X-ray films with a Scan jet II scanner (Hewlett Packard) and NIH image software (version 1·56). The density of bands was expressed as a percentage of the standard normal control, TT. All the blotting experiments were performed in duplicate and the results were expressed as mean percentages of the normal control, TT. The two methods for detecting the TCR ζ expression such as FACS analysis and immunoblotting were compared in the same blood samples, showing that the correlation coefficient for these two methods was 0·884 (P < 0·0001).
Statistical analysis
Statistical significance was analysed using Statview software (version 4·5; Abacus, CA, USA). The two-sample t-test (two-tailed), or non-parametric analysis with Fisher's method as a post-hoc test, was used for the equality of means of the flow cytometry, immunoblotting analysis and relationship between the TCR ζ defect and individual clinical features. Logistic-regression analysis was used to assess the relation of the SLEDAI score or the PSL dose to the amount of TCR ζ expressed. A level of P < 0·05 was considered to be statistically significant.
RESULTS
Decreased TCR-initiated tyrosine phosphorylation in peripheral blood T cells from SLE patients
As shown in the typical experiment (Fig. 1a), tyrosine phosphorylation of multiple substrates migrating at 18–23 kDa, 35 kDa, 60 kDa, 70 kDa and 115 kDa was observed in a healthy control following anti-CD3+ anti-CD4 stimulation, consistent with our previous reports [24]. In contrast, stimulation of SLE T cells resulted in dramatically reduced tyrosine phosphorylation in the representative SLE patient (lane 4). Among the major tyrosine phosphorylated substrates, an 18–23 kDa band decreased consistently in SLE and it was proved to be a tyrosine-phosphorylated TCR ζ chain (tyr-P*-TCR ζ) by immunoprecipitation with anti-TCR ζ MoAb (Fig. 1b). The protein level of the TCR ζ chain was decreased to 12·6% of the normal control (Fig. 1c). This observation was confirmed by more than 10 successful experiments using SLE T cells. On the other hand, the tyrosine phosphorylation of TCR ζ in patients with other rheumatic diseases was comparable to that in healthy individuals (data not shown).
Fig. 1.

Tyrosine phosphorylation of TCR ζ on peripheral blood T cells from a SLE patient. T cells from a healthy individual and a SLE patient were stimulated by anti-CD3 and anti-CD4 MoAbs (lane 2, 4) or not (lane 1, 3) for 30 min before cross-linking. Total lysates (a) or anti-TCR ζ immunoprecipitates (b and c) equivalent to 5 × 10⁶ cells per lane were separated by 15% SDS-PAGE, transferred to membrane, and blotted by antiphosphotyrosine antibody labelled with HRP (a and b) or anti-TCR ζ (c). tyr-P* TCR ζ: phosphotyrosinated TCR ζ chain, LC: light chain of immunoglobulin.
Diminished expression of T cell receptor and its component on peripheral blood lymphocytes
The TCR ζ chain is an important subunit of signalling molecules in the TCR-CD3 complex [36]. To elucidate the mechanism of defects in tyrosinephosphoration of the TCR ζ chain, we attempted to analyse the expression of TCR α/β, CD3ɛ, CD4, CD8 and TCR ζ on PBL using flow cytometry. As shown in Table 1, the mean fluorescence intensity (MFI) of TCR α/β, and TCR ζ was decreased significantly in SLE PBL compared with that of healthy individuals and patients with other rheumatic diseases (TCRα/β: SLE versus normal; P < 0·0001, SLE versus RA; P < 0·0004 and TCR ζ: SLE versus normal; P < 0·0001, SLE versus RA; P < 0·0001, SLE versus SSc; P < 0·0276, SLE versus SjS; P < 0·0084). However, it should be noted that the trend toward a decrease was similarly observed, but not statistically significant, in the other rheumatic diseases, raising the possibility that the decrease of expression in SLE is a relative, but not an absolute difference among systemic rheumatic diseases. Double staining with anti-TCR ζ and various anti-T cell subset MoAbs was carried out to determine whether the decreased expression of TCR ζ is observed preferentially in a particular subset of T cells. As shown in a typical experiment (Fig. 2), the mean fluorescent intensity (MFI) of TCR ζ in both CD4+ and CD8+ subsets as well as CD45RA+ and CD45RO+ subsets demonstrated a remarkable decrease in SLE to a similar degree in all subsets. It should be noted that the TCR ζ MFI in CD45RO was consistently lower than that of CD45RA in the normal control. Repeated experiments confirmed this observation in all 14 healthy controls. Although a proportion of the CD4+ CD45RA+ subset was reduced, in association with an increase of CD4+ CD45RO+ in SLE T cells [13], the above results indicate that the TCR ζ defect was not merely secondary to a shift in the T cell subsets.
Table 1.
Surface expression of TCR–CD3 complex and co-receptors on peripheral blood T cells
| % expression/Mean fluorescence intensity (log scale) | ||||||
|---|---|---|---|---|---|---|
| Subjects | No. of patients | TCRζ | TCRα/β | CD3 | CD4 | CD8 |
| Normal | 39 | 81 ± 8 | 71 ± 7 | 74 ± 6 | 44 ± 7 | 30 ± 8 |
| (161 ± 42) | (104 ± 26) | (376 ± 61) | (345 ± 321) | (1565 ± 401) | ||
| SLE | 44 | 81 ± 12 | 75 ± 12 | 78 ± 12 | 40 ± 11 | 38 ± 14** |
| (107 ± 41)* | (87 ± 22)*** | (355 ± 60)* | (367 ± 306) | (1716 ± 533) | ||
| RA | 30 | 74 ± 9 | 67 ± 13* | 69 ± 14** | 48 ± 12 | 23 ± 7* |
| (147 ± 28) | (107 ± 32) | (377 ± 68) | (237 ± 59)* | (1435 ± 478) | ||
| SSc | 11 | 71 ± 10 | 70 ± 12 | 74 ± 10 | 43 ± 11 | 29 ± 7 |
| (133 ± 19) | (102 ± 21) | (368 ± 50) | (213 ± 26) | (1642 ± 503) | ||
| SjS | 12 | 73 ± 10 | 70 ± 11 | 73 ± 11 | 44 ± 9 | 29 ± 9 |
| (137 ± 16) | (107 ± 23) | (374 ± 77) | (419 ± 121) | (1966 ± 493) | ||
Results were expressed as mean ± s.d. Paracenthesis indicates mean fluorescence intensity on log scale.
P < 0·001
P < 0·01
P < 0·05.
Fig. 2.
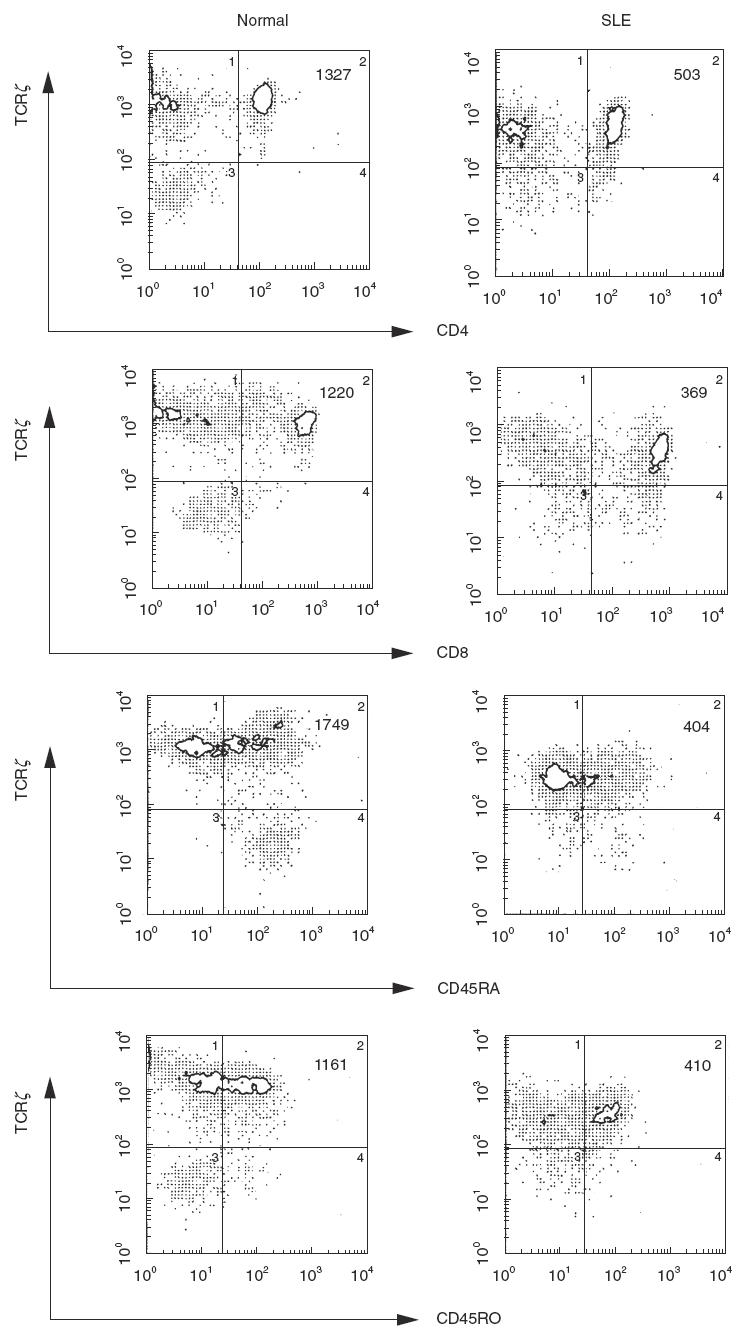
Expression of TCR ζ on the subsets of T cells from a healthy individual and a patient with SLE. Double staining with TIA-2-PE and T4-FITC or T8-FITC (upper pannels), and CD45RA-FITC or CD45RO-FITC (lower pannels) was carried out, and analysed on a flow cytometer. Mean fluorescence intensity of TCR ζ in the indicated double positive subsets was shown at the right upper corner of each histogram.
Diminished expression of the TCR ζ chain by immunoblotting
In addition to flow cytometric anaysis, we determined the expression of the TCR ζ chain by immunoprecipitation analysis. For this purpose, we used immunoprecipitates with anti-TCR ζ MoAb, from whole cell lysates, prepared with 1% NP-40, which disrupts plasma membranes, followed by immunoblotting with the same MoAb. The amounts of the TCR ζ chain were quantified by densitometric analysis. The results were expressed as a mean of the duplicate samples. When the density of the TCR ζ chain from a healthy control TT was set as 100% in all experiments, the mean of the range of TCR ζ expressions in 39 healthy individuals was 111·4 ± 22·6%. As shown in Fig. 3a, the expression level was reduced to various degrees in SLE. In particular, TCR ζ was extremely down-regulated in two SLE patients (SLE 1 and SLE 8). The experiment shown is representative of 17 successful experiments, involving 44 SLE patients. Overall, there were heterogeneous decreases in the amount of TCR ζ expression in SLE T cells, ranging from 1·5 to 132·0% (mean ± s.d.: 51·6 ± 37·4%, n = 44), i.e. expression was significantly lower than in healthy controls (P < 0·0001), RA (P < 0·0001), SSc (P < 0·0001) and SjS (P < 0·0001). On the other hand, no significant difference in TCR ζ expression was found between the healthy controls and the patients with RA (106·3 ± 30·2%, n = 30), SSc (99·6.6 ± 23·0, n = 11) or SjS (108·7 ± 21·3%, n = 12), suggesting that the defective ζ chain expression on peripheral blood T cells is quantitatively marked in SLE (Fig. 3b).
Fig. 3.

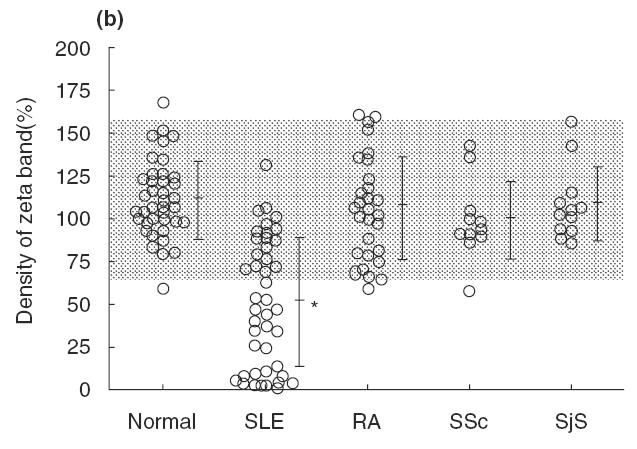
(a) Immunoprecipitation analysis for TCR ζ chain from healthy individuals and the SLE patients. Cell lysates were immunoprecipated by anti-TCR ζ chain MoAb (TIA-2), separated by 15% SDS-PAGE and transferred to PVDF membrane. Immunoblotting was performed with TIA-2 followed by antimouse IgG labelled with HRP and then subjected to chemiluminescence imaging. (b) Expression of the TCR ζ chain from patients with SLE and other rheumatic diseases. Density of the band of TCR ζ is quantified by the densitometric scanning, and analysed by NIH image software. Dotted area indicated the mean ± s.d. of normal controls. It was significantly lower in SLE than in normal controls (P < 0·001), while no significant differences were found among the other rheumatic diseases.
Association of TCR ζ defects with specific clinical manifestations of SLE
To explore the possible relationships between defective TCR ζ expression and clinical manifestations or laboratory findings in SLE, statistical analyses were performed. First, we compared the amounts of TCR ζ chains in T cells from SLE patients with or without various parameters. As shown in Table 2, in those patients whose medical records indicated butterfly rash, a past history of vasculitis and positive antiphospholipid antibodies, the amount of TCR ζ was significantly lower than in patients without these findings (P < 0·05). On the other hand, the expression of TCR ζ in patients with primary antiphospholipid syndrome was comparable to that in normal controls (data not shown). Next, we performed a logistic regression analysis to ascertain the possible relationships between TCR ζ expression and the SLEDAI score or the PSL dose. Neither the SLEDAI nor the PSL dose was correlated with the level of TCR ζ expression (Fig. 4a,b). It should be noted that the higher the SLEDAI, the lower the TCR ζ density tended to be. In addition, nine of 13 active patients demonstrated relatively low TCR ζ expression. Nevertheless, no significant difference was found in the total amount of TCR ζ between the active (SLEDAI ≥ 10) and inactive patients (SLEDAI < 10) (33·9 ± 35·1 versus 56·1 ± 37·1, P > 0·05).
Table 2.
Expression of TCR zeta and clinical features in SLE
| % expression of TCR ζ | |||
|---|---|---|---|
| Clinical features | (+) | (−) | P-value |
| Butterfly rash | 32·7 ± 28·7 | 71·4 ± 14·9 | 0·005* |
| Discoid rash | 25·1 ± 1·7 | 46·1 ± 32·2 | 0·550 |
| Photosensitivity | 49·0 ± 25·8 | 39·3 ± 34·4 | 0·283 |
| Oral ulcers | 33·1 ± 35·6 | 47·1 ± 29·3 | 0·485 |
| Polyarthritis | 46·1 ± 31·4 | 25·0 ± 22·6 | 0·356 |
| Serositis | 29·6 ± 25·6 | 48·5 ± 31·8 | 0·280 |
| CNS | 36·7 | 43·6 ± 31·6 | 0·203 |
| Renal | 37·9 ± 32·2 | 46·3 ± 30·9 | 0·833 |
| Vasculitis | 27·4 ± 26·0 | 50·7 ± 30·9 | 0·553 |
| Anti-dsDNA | 36·2 ± 32·5 | 51·7 ± 28·1 | 0·100 |
| Anti-RNP | 41·7 ± 30·4 | 44·3 ± 32·4 | 0·100 |
| Anti-Sm | 34·7 ± 39·4 | 45·2 ± 29·7 | 0·853 |
| Anti-SS-A | 45·7 ± 31·6 | 41·3 ± 31·5 | 0·747 |
| Antiphospholipid | 16·5 ± 17·8 | 53·3 ± 28·9 | 0·009* |
Results were expressed as mean ± s.d. Expression of TCRζ was determined by densitometric analysis on the TCR ζ bands, and compared between those with or without the clinical feature.
P < 0·05.
Fig. 4.
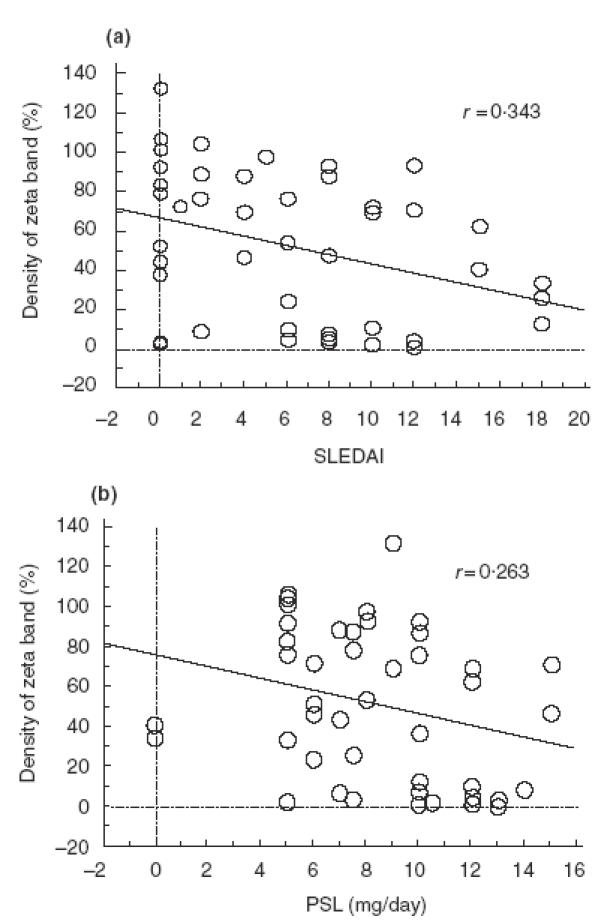
Correlation of TCR ζ expression and SLEDAI (a) or dose of PSL (mg/day) (b). Logistic regression analysis was performed, showing no significant correlation between the amount of TCR ζ expression and either SLEDAI or the dose of prednisolone.
Longitudinal analysis for TCR ζ expression
To examine possible changes in TCR ζ expression during the disease course in individual patient, the expression was determined by immunoprecipitaion at two time points with active and inactive disease within a 6–12-month period for each of the 13 SLE patients (Fig. 5). Five SLE patients showed a consistent decrease in TCR ζ expression, although their active disease was controlled to be inactive. On the other hand, the decreased level of TCR ζ expression at an active stage recovered completely to the normal level when inactive in three SLE patients, and it was increased greatly to within the normal range in one patient who went from active to inactive. There were no significant changes in the levels of expression in the rest of the patients. In summary, one-third of the patients exhibited a significant change in TCR ζ expression at different levels of disease activity, while two-thirds of the patients showed a relatively stable expression.
Fig. 5.
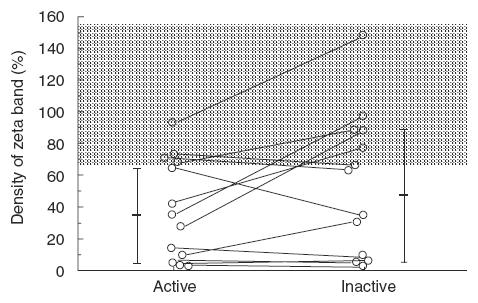
Longitudinal analysis for TCR ζ expression in 13 SLE patients. TCR ζ expression was determined by immunoprecipitaion from each patient at active or inactive stage during a 6-months–1 year period. Density of the band of TCR ζ is quantified by the densitometric scanning, and analysed by NIH image software. Dotted area indicated the mean ± s.d. of normal controls.
DISCUSSION
In this study, we demonstrated a remarkable decrease in the expression of the TCR ζ chain on peripheral blood T cells from SLE patients. T cells recognize foreign antigens via TCR α/β and transduce signals through the non-convalently associated CD3 γ, δ, ɛ and ζ chains [37–40]. The level of surface expression of the TCR-CD3 complex presumably determines the initial step in T cell activation. We confirmed significantly decreased expression of TCR α/β, CD3ɛ or TCR ζ in SLE T cells, which may contribute to a decrease in tyrosine phosphorylation by CD3 and CD4 ligation in SLE. It has been demonstrated that TCR ζ has pivotal roles in assembly [30], processing [30,41] and degradation [42,43] of other components of the TCR-CD3 complex. In the presence of the TCR ζ chain, pentameric TCR α/β-CD3ɛ/δ/γ can form heptameric TCR α/β-CD3ɛ/δ, ɛ/γ and ζ/ζ, and export them from the endoplasmic reticulum (ER) to the Golgi apparatus [30]. However, in the absence of TCR ζ, incomplete TCRs are degraded in lysosomes [42], and other partial receptors and unassembled subunits other than ζ, are degraded by ubiquitination and proteasome-dependent removal from ER membranes [44]. Thus, decreased expression of TCR α/β and CD3ɛ may be secondary to the defective protein expression of TCR ζ in SLE T cells. In addition, it is important to know the downstream signalling pathways in SLE T cells with defective TCR ζ expression. Tyrosine phosphorylation of multiple substrates including TCR ζ appeared to be down-regulated. These results may imply that the ZAP-70 tyrosine kinase, linkers for activation of T cells, and a number of adaptors may be affected, although ZAP-70 exhibited normal level of tyrosine-phosphorylation in RA synovial T cells with decreased TCR ζ expression [45]. Further experiments, for example showing the normalization of TCR-CD3 expression with genetic manipulation of TCR ζ to normal level, and concerning the detailed charcterization of the downstream signalling molecules are required to draw a definitive conclusion in the future.
TCR ζ defects were detected in more than half of our SLE patients, who had a range of different disease activities and various clinical manifestations. Notably, TCR ζ defects were related to the presence of butterfly rash, vasculitis and antiphospholipid antibodies since disease onset (P < 0·01). The butterfly rash is a clinical hallmark sign of SLE, but vasculitis is a rare and sometimes fatal manifestation. Since defective expression was not observed in patients with primary antiphospholipid syndrome, the presence of antiphospholipid alone could not lead directly to the defective expression of TCR ζ. In five SLE patients the profound ζ defects were observed at the active and inactive stages, suggesting that the defective expression was not greatly affected by the disease activity in these patients. On the other hand, decreased TCR ζ expression during the active stage was restored to normal in the inactive stage after treatment in three SLE patients. This observation suggested that the TCR ζ defect could be reversed in vivo in some SLE patients, as in tumour-infiltrating lymphocytes (TIL) [46,47]. These results imply that defective expression of TCR ζ may result from a heterogeneous mechanism in SLE. One form is relatively stable during the disease course, while the other is changed by the disease process or its treatment.
It is noteworthy that TCR ζ-mediated signalling was defective in synovial, but not peripheral blood T cells from RA patients [48]. TCR ζ defects were much more prominent in areas of marked inflammation, suggesting that the expression is affected by factors associated with inflammation such as the redox status [49] and direct contact with activated macrophages [50]. Recent studies have clearly demonstrated that prolonged exposure to TNF-α down-regulates TCR ζ and the subsequent TCR-CD3 complex at the cell surface in mouse T cell hybridoma [51]. Thus, when mediators of inflammation such as TNF-α or cells involved in inflammation are corrected by treatment, TCR ζ defects may be normalized.
On the other hand, the stable defects observed in some patients may reflect abnormalities within T cells, independent of the disease activity. Among five SLE patients with a consistent decrease in TCR ζ expression, TCR ζ mRNA lacking exon 7 was found in two patients. Previously, we identified abnormal TCR ζ mRNAs lacking exon 7 and several base substitutions in SLE patients [25,52]. To date, we have not been able to identify any genomic mutations/deletions in either the coding or the splicing donor and acceptor sites, which could account for the exon 7 skip in these two SLE patients. As it has been reported that the mRNA level was decreased in some patients [26], it is tempting to speculate that alteration of the ζ mRNA sequence would affect the stability of the transcripts, resulting in the down-regulated protein expression of the TCR ζ chain in SLE. It should be noted that TCR ζ mRNA was reduced by 30% with prolonged exposure to TNF-α in mouse T cell hybridoma [51], introducing a possibility that TCR ζ mRNA in SLE T cells is affected by TNF-α. In this respect, the effect of proinflammatory cytokines on the quality and quantity of TCR ζ mRNA in SLE T cells remains to be clarified in the future.
A question arises as to how TCR ζ defects lead to autoimmunity. In TCR ζ chain knock-out mice, a shift from conventional thymic differentiated T cells to intestinal intraepithelial lymphocytes (iIEL), which differentiate from the extrathymic environment, has been reported [41]. In this regard, we have demonstrated that a novel integrin, αEβ7 (CD103), expressed preferentially on iIEL is up-regulated in activated PBL in SLE [34]. As it has been suggested that autoreactive T cell clones are more numerous in iIEL [53], this could account for the autoimmune features of SLE with ζ defects, as in ζ knock-out mice. However, the fact that the CD8 molecule expressed on SLE αEβ7 + T cells is composed of α/β, but not α/α isoforms [34], a novel marker for extrathymically developed IEL [53,54], argues against this possibility.
The alternative hypothesis arises from recent demonstrations that autoreactive clones are not deleted by negative selection, but selected positively in thymic differentiation, and expanded in the periphery in TCR ζ chain knock-out mice [41,55–57], suggesting a role of the TCR ζ chain in negative selection in the thymus. In mice lacking all zeta family members, in spite of a low number of peripheral T cells and decreased surface expression of TCR-CD3 complexes, they exhibit a memory phenotype, produce little IL-2 and overproduce interferon γ with phorbol ester and ionomycin. All these features are characteristic of SLE T cells. Although these mice did not have a lupus phenotype, they appeared to develop inflammatory bowel disease [57], suggesting that the TCR ζ chain functions in preventing autoimmunity. In addition, it has been proposed that T cell anergy and altered receptor signalling in regulatory T cells may lead to autoimmunity by breaking the peripheral tolerance [58].
In conclusion, detailed characterization of the defective expression of the TCR ζ chain may provide a key to understanding the molecular basis of T cell dysfunction in SLE patients.
Acknowledgments
We would like to thank Ms Natsuko Onoda for expert technical assistance. This work was supported by grants from Grant-in Aid for Scientific Research (C) of the Japanese Ministry of Education, Science and Culture, Japanese Ministry of Health and Welfare, and Maruki Memorial Research Foundation (grant no. 98003).
REFERENCES
- 1.Boumpas DT, Austin HAR, Fessler BJ, et al. Systemic lupus erythematosus: emerging concepts. Part 1. Renal, neuropsychiatric, cardiovascular, pulmonary, and hematologic disease. Ann Intern Med. 1995;122:940–50. doi: 10.7326/0003-4819-122-12-199506150-00009. [DOI] [PubMed] [Google Scholar]
- 2.Boumpas DT, Fessler BJ, Austin HAR, et al. Systemic lupus erythematosus: emerging concepts. Part 2. Dermatologic and joint disease, the antiphospholipid antibody syndrome, pregnancy and hormonal therapy, morbidity and mortality, and pathogenesis. Ann Intern Med. 1995;123:42–53. doi: 10.7326/0003-4819-123-1-199507010-00007. [DOI] [PubMed] [Google Scholar]
- 3.Mills JA. Systemic lupus erythematosus. N Engl J Med. 1994;330:1871–9. doi: 10.1056/NEJM199406303302608. [DOI] [PubMed] [Google Scholar]
- 4.Cohen PL. T- and B-cell abnormalities in systemic lupus. J Invest Dermatol. 1993;100:69s–72s. doi: 10.1111/1523-1747.ep12355631. [DOI] [PubMed] [Google Scholar]
- 5.Tsokos GC. Lymphocyte abnormalities in human lupus. Clin Immunol Immunopathol. 1992;63:7–9. doi: 10.1016/0090-1229(92)90083-z. [DOI] [PubMed] [Google Scholar]
- 6.Kotzin BL. Systemic lupus erythematosus. Cell. 1996;85:303–6. doi: 10.1016/s0092-8674(00)81108-3. [DOI] [PubMed] [Google Scholar]
- 7.Gottlieb AB, Lahita RG, Chiorazzi N, Kunkel HG. Immune function in systemic lupus erythematosus. Impairment of in vitro T cell proliferation and in vivo antibody response to exogenous antigen. J Clin Invest. 1979;63:885–92. doi: 10.1172/JCI109388. [DOI] [PMC free article] [PubMed] [Google Scholar]
- 8.Fox DA, Millard JA, Treisman J, et al. Defective CD2 pathway T cell activation in systemic lupus erythematosus. Arthritis Rheum. 1991;34:561–71. doi: 10.1002/art.1780340508. [DOI] [PubMed] [Google Scholar]
- 9.Huang YP, Miescher PA, Zubler RH. The interleukin 2 secretion defect in vitro in systemic lupus erythematosus is reversible in rested cultured T cells. J Immunol. 1986;137:3515–20. [PubMed] [Google Scholar]
- 10.Linker-Israeli M. Cytokine abnormalities in human lupus. Clin Immunol Immunopathol. 1992;63:10–2. doi: 10.1016/0090-1229(92)90084-2. [DOI] [PubMed] [Google Scholar]
- 11.Horwitz DA, Gray JD, Behrendsen SC, et al. Decreased production of interleukin-12 and other Th1-type cytokines in patients with recent-onset systemic lupus erythematosus. Arthritis Rheum. 1998;41:838–44. doi: 10.1002/1529-0131(199805)41:5<838::AID-ART10>3.0.CO;2-S. [DOI] [PubMed] [Google Scholar]
- 12.Stohl W, Elliot JE, Li L, et al. Impaired nonrestricted cytolytic activity in systemic lupus erythematosus. Arthritis Rheum. 1997;40:1130–7. doi: 10.1002/1529-0131(199706)40:6<1130::AID-ART17>3.0.CO;2-O. [DOI] [PubMed] [Google Scholar]
- 13.Takeuchi T, Tanaka S, Steinberg AD, et al. Defective expression of the 2H4 molecule after autologous mixed lymphocyte activation in systemic lupus erythematosus patients. J Clin Invest. 1988;82:1288–94. doi: 10.1172/JCI113728. [DOI] [PMC free article] [PubMed] [Google Scholar]
- 14.Sierakowski S, Kucharz EJ, Lightfoot RW, Goodwin JS. Impaired T-cell activation in patients with systemic lupus erythematosus. J Clin Immunol. 1989;9:469–76. doi: 10.1007/BF00918016. [DOI] [PubMed] [Google Scholar]
- 15.Dayal AK, Kammer GM. The T cell enigma in lupus. Arthritis Rheum. 1996;39:23–33. doi: 10.1002/art.1780390104. [DOI] [PubMed] [Google Scholar]
- 16.Tada Y, Nagasawa K, Yamauchi Y, Tsukamoto H, Niho Y. A defect in the protein kinase C system in T cells from patients with systemic lupus erythematosus. Clin Immunol Immunopathol. 1991;60:220–31. doi: 10.1016/0090-1229(91)90065-i. [DOI] [PubMed] [Google Scholar]
- 17.Kammer GM, Khan I, Malemud C. Defective type I protein kinase A isozyme activity in systemic lupus erythematosus T lymphocytes. J Clin Invest. 1994;94:422–30. doi: 10.1172/JCI117340. [DOI] [PMC free article] [PubMed] [Google Scholar]
- 18.Kammer GM, Khan IU, Kammer JA, Olorenshaw I, Mathis D. Deficient type I protein kinase A isozyme activity in systemic lupus erythematosus T lymphocytes. II. Abnormal isozyme kinetics. J Immunol. 1996;157:2690–8. [PubMed] [Google Scholar]
- 19.Takeuchi T, Pang M, Amano K, Koide J, Abe T. Reduced protein tyrosine phosphatase (PTPase) activity of CD45 on peripheral blood lymphocytes in patients with systemic lupus erythematosus. Clinical & Experimental Immunology. 1997;109:20–6. doi: 10.1046/j.1365-2249.1997.4371334.x. [DOI] [PMC free article] [PubMed] [Google Scholar]
- 20.Ullman KS, Northrop JP, Verweij CL, Crabtree GR. Transmission of signals from the T lymphocyte antigen receptor to the genes responsible for cell proliferation and immune function: the missing link. Ann Rev Immunol. 1990;8:421–52. doi: 10.1146/annurev.iy.08.040190.002225. [DOI] [PubMed] [Google Scholar]
- 21.Weiss A, Littman DR. Signal transduction by lymphocyte antigen receptors. Cell. 1994;76:263–74. doi: 10.1016/0092-8674(94)90334-4. [DOI] [PubMed] [Google Scholar]
- 22.Weiss A. T cell antigen receptor signal transduction: a tale of tails and cytoplasmic protein-tyrosine kinases. Cell. 1993;73:209–12. doi: 10.1016/0092-8674(93)90221-b. [DOI] [PubMed] [Google Scholar]
- 23.Samelson LE, Klausner RD. Tyrosine kinases and tyrosine-based activation motifs. Current research on activation via the T cell antigen receptor. J Biol Chem. 1992;267:24913–6. [PubMed] [Google Scholar]
- 24.Amano K, Takeuchi T, Abe T. Imbalanced tyrosine phosphorylation in signal transduction molecules in SLE T cells. Arthritis Rheum. 1996;39:S118. [Google Scholar]
- 25.Takeuchi T, Tsuzaka K, Pang M, Amano K, Koide J, Abe T. TCR zeta chain lacking exon 7 in two patients with systemic lupus erythematosus. Int Immunol. 1998;10:911–21. doi: 10.1093/intimm/10.7.911. [DOI] [PubMed] [Google Scholar]
- 26.Liossis SN, Ding XZ, Dennis GJ, Tsokos GC. Altered pattern of TCR/CD3-mediated protein-tyrosyl phosphorylation in T cells from patients with systemic lupus erythematosus. Deficient expression of the T cell receptor zeta chain. J Clin Invest. 1998;101:1448–57. doi: 10.1172/JCI1457. [DOI] [PMC free article] [PubMed] [Google Scholar]
- 27.Weissman AM, Baniyash M, Hou D, Samelson LE, Burgess WH, Klausner RD. Molecular cloning of the ζ chain of the T cell antigen receptor. Science. 1988;239:1018–20. doi: 10.1126/science.3278377. [DOI] [PubMed] [Google Scholar]
- 28.Frank SJ, Niklinska BB, Orloff DG, Mercep M, Ashwell JD, Klausner RD. Structural mutations of the T cell receptor zeta chain and its role in T cell activation. Science. 1990;249:174–7. doi: 10.1126/science.2371564. [DOI] [PubMed] [Google Scholar]
- 29.Irving BA, Weiss A. The cytoplasmic domain of the T cell receptor zeta chain is sufficient to couple to receptor-associated signal transduction pathways. Cell. 1991;64:891–901. doi: 10.1016/0092-8674(91)90314-o. [DOI] [PubMed] [Google Scholar]
- 30.Geisler C, Kuhlmann J, Rubin B. Assembly, intracellular processing, and expression at the cell surface of the human alpha beta T cell receptor/CD3 complex. Function of the CD3-zeta chain. J Immunol. 1989;143:4069–77. [PubMed] [Google Scholar]
- 31.Tan EM, Cohen AS, Fries JF, Masi AT, MaShane DJ. Rothfield criteria for the classification of system lupus erythematosus. Arthritis Rheum. 1982;25:1271–7. doi: 10.1002/art.1780251101. [DOI] [PubMed] [Google Scholar]
- 32.Bombardier C, Gladman DD, Urowitz MB, Caron D, Chang CH. Derivation of the SLEDAI. A disease activity index for lupus patients. The Committee on Prognosis Studies in SLE. Arthritis Rheum. 1992;35:630–40. doi: 10.1002/art.1780350606. [DOI] [PubMed] [Google Scholar]
- 33.Takeuchi T, Amano K, Sekine H, Koide J, Abe T. Upregulated expression and function of integrin adhesive receptors in systemic lupus erythematosus patients with vasculitis. J Clin Invest. 1993;92:3008–16. doi: 10.1172/JCI116924. [DOI] [PMC free article] [PubMed] [Google Scholar]
- 34.Pang M, Abe T, Fujihara T, et al. αEβ7, a novel integrin adhesion molecule is upregulated on T cells from SLE patients with specific epithelial involvement. Arthritis Rheum. 1998;41:1456–63. doi: 10.1002/1529-0131(199808)41:8<1456::AID-ART16>3.0.CO;2-0. [DOI] [PubMed] [Google Scholar]
- 35.Anderson P, Blue ML, O'Brien C, Schlossman SF. Monoclonal antibodies reactive with the T cell receptor zeta chain. production and characterization using a new method. J Immunol. 1899;143:1899–904. [PubMed] [Google Scholar]
- 36.Koyasu S, McConkey DJ, Clayton LK, et al. Phosphorylation of multiple CD3 zeta tyrosine residues leads to formation of pp21 in vitro and in vivo. Structural changes upon T cell receptor stimulation. J Biol Chem. 1992;267:3375–81. [PubMed] [Google Scholar]
- 37.Wegener AM, Letourneur F, Hoeveler A, Brocker T, Luton F, Malissen B. The T cell receptor/CD3 complex is composed of at least two autonomous transduction modules. Cell. 1992;68:83–95. doi: 10.1016/0092-8674(92)90208-t. [DOI] [PubMed] [Google Scholar]
- 38.Koning F, Maloy WL, Coligan JE. The implications of subunit interactions for the structure of the T cell receptor-CD3 complex. Eur J Immunol. 1990;20:299–305. doi: 10.1002/eji.1830200211. [DOI] [PubMed] [Google Scholar]
- 39.Blumberg RS, Ley S, Sancho J, et al. Structure of the T-cell antigen receptor: evidence for two CD3 epsilon subunits in the T-cell receptor-CD3 complex. Proc Natl Acad Sci USA. 1990;87:7220–4. doi: 10.1073/pnas.87.18.7220. [DOI] [PMC free article] [PubMed] [Google Scholar]
- 40.de la Hera A, Muller U, Olsson C, Isaaz S, Tunnacliffe A. Structure of the T cell antigen receptor (TCR): two CD3 epsilon subunits in a functional TCR/CD3 complex. J Exp Med. 1991;173:7–17. doi: 10.1084/jem.173.1.7. [DOI] [PMC free article] [PubMed] [Google Scholar]
- 41.Yamazaki T, Arase H, Ono S, Ohno H, Watanabe H, Saito T. A shift from negative to positive selection of autoreactive T cells by the reduced level of TCR signal in TCR-transgenic CD3 zeta-deficient mice. J Immunol. 1997;158:1634–40. [PubMed] [Google Scholar]
- 42.Sussman JJ, Bonifacino JS, Lippincott-Schwartz J, et al. Failure to synthesize the T cell CD3-zeta chain. structure and function of a partial T cell receptor complex. Cell. 1988;52:85–95. doi: 10.1016/0092-8674(88)90533-8. [DOI] [PubMed] [Google Scholar]
- 43.Love PE, Shores EW, Johnson MD, et al. T cell development in mice that lack the zeta chain of the T cell antigen receptor complex. Science. 1993;261:918–21. doi: 10.1126/science.7688481. [DOI] [PubMed] [Google Scholar]
- 44.Yang M, Omura S, Bonifacino JS, Weissman AM. Novel aspects of degradation of T cell receptor subunits from the endoplasmic reticulum (ER) in T cells: importnace of oligosaccharide processing, ubiquitination, and proteasome-dependent removal from ER membranes. J Exp Med. 1998;187:835–46. doi: 10.1084/jem.187.6.835. [DOI] [PMC free article] [PubMed] [Google Scholar]
- 45.Gringhuis SI, Leow A, Papendrecht-van der Voort EAM, Remans PHJ, Breedveld FC, Verweij CL. Displacement of linkers for activation of T cells from the plasma membrane due to redox balance alterations results in hyporesponsiveness of synovial fluid T lymphocytes in rheumatoid arthritis. J Immunol. 2000;164:2170–9. doi: 10.4049/jimmunol.164.4.2170. [DOI] [PubMed] [Google Scholar]
- 46.Tartour E, Latour S, Mathiot C, et al. Variable expression of CD3-zeta chain in tumor-infiltrating lymphocytes (TIL) derived from renal-cell carcinoma: relationship with TIL phenotype and function. Int J Cancer. 1995;63:205–12. doi: 10.1002/ijc.2910630210. [DOI] [PubMed] [Google Scholar]
- 47.Salvadori S, Gansbacher B, Pizzimenti AM, Zier KS. Abnormal signal transduction by T cells of mice with parental tumors is not seen in mice bearing IL-2-secreting tumors. J Immunol. 1994;153:5176–82. [PubMed] [Google Scholar]
- 48.Maurice MM, Lankester AC, Bezemer AC, et al. Defective TCR-mediated signaling in synovial T cells in rheumatoid arthritis. J Immunol. 1997;159:2973–8. [PubMed] [Google Scholar]
- 49.Maurice MM, Nakamura H, van der Voort EA, et al. Evidence for the role of an altered redox state in hyporesponsiveness of synovial T cells in rheumatoid arthritis. J Immunol. 1997;158:1458–65. [PubMed] [Google Scholar]
- 50.Aoe T, Okamoto Y, Saito T. Activated macrophages induce structural abnormalities of the T cell receptor-CD3 complex. J Exp Med. 1995;181:1881–6. doi: 10.1084/jem.181.5.1881. [DOI] [PMC free article] [PubMed] [Google Scholar]
- 51.Isomaki P, Panesar M, Annenkov A, et al. Prolonged exposure of T cells to TNF down-regulates TCRζ and expression of the TCR/CD3 complex at the cell surface. J Immunol. 2001;166:5495–507. doi: 10.4049/jimmunol.166.9.5495. [DOI] [PubMed] [Google Scholar]
- 52.Tsuzaka K, Takeuchi T, Onoda N, Abe T. Mutations in T cell receptor zeta chain mRNA of peripheral T cells from systemic lupus erythematosus patients. J Autoimmunol. 1997;11:381–5. doi: 10.1006/jaut.1998.0223. [DOI] [PubMed] [Google Scholar]
- 53.Poussier P, Edouard P, Lee C, Binnie M, Julius M. Thymus-independent development and negative selection of T cells expressing T cell receptor alpha/beta in the intestinal epithelium: evidence for distinct circulation patterns of gut- and thymus-derived T lymphocytes. J Exp Med. 1992;176:187–99. doi: 10.1084/jem.176.1.187. [DOI] [PMC free article] [PubMed] [Google Scholar]
- 54.Rocha B, Vassalli P, Guy-Grand D. The V beta repertoire of mouse gut homodimeric alpha CD8+ intraepithelial T cell receptor alpha/beta+ lymphocytes reveals a major extrathymic pathway of T cell differentiation. J Exp Med. 1991;173:483–6. doi: 10.1084/jem.173.2.483. [DOI] [PMC free article] [PubMed] [Google Scholar]
- 55.Shores EW, Tran T, Grinberg A, Sommers CL, Shen H, Love PE. Role of the multiple T cell receptor (TCR)-zeta chain signaling motifs in selection of the T cell repertoire. J Exp Med. 1997;185:893–900. doi: 10.1084/jem.185.5.893. [DOI] [PMC free article] [PubMed] [Google Scholar]
- 56.Lin S-Y, Ardouin L, Gillet A, Malissen M, Malissen B. The single positive T cells found in CD3-ζ/η−/− mice overtly react with self-major histocompatibility complex molecules upon restoration of normal surface density of T cell receptor-CD3 complex. J Exp Med. 1997;185:707–15. doi: 10.1084/jem.185.4.707. [DOI] [PMC free article] [PubMed] [Google Scholar]
- 57.Shores EW, Ono M, Kawabe T, et al. T cell development in mice lacking all T cell receptor zeta family members (zeta, eta, and FcepsilonRIgamma) J Exp Med. 1998;187:1093–101. doi: 10.1084/jem.187.7.1093. [DOI] [PMC free article] [PubMed] [Google Scholar]
- 58.Saloijin KV, Zhang J, Madrenas J, Delovitch TL. T-cell anergy and altered T-cell receptor signaling: effects on autoimmune disease. Immunol Today. 1998;19:468–73. doi: 10.1016/s0167-5699(98)01326-7. [DOI] [PubMed] [Google Scholar]