

Abstract
Common variable immunodeficiency (CVID) is a heterogeneous syndrome characterized by repeated infections and hypogammaglobulinaemia. Additionally, T-cell abnormalities including lymphopenia, decreased proliferation to mitogens and antigens, and the reduced production and expression of cytokines, have also been observed. In this study we have investigated the expression of naive, memory and activation markers in T-cell subpopulations in 17 CVID patients in comparison to age-matched normal controls. The numbers of CD4+ T cells, including CD45RA+CD62L+ and, to a lesser extent, CD45RA−CD62L+/RA+CD62L− were significantly reduced in patients, whereas CD8+ T cells were within normal range. In contrast, HLA-DR+ cells were increased both in CD4+ and CD8+ T cells. To assess the thymic output, we analysed the presence of T-cell receptor excision circles (TRECs) in CD4+ and CD8+ T cells by quantitative PCR. TRECs were decreased significantly in patients and the rate of TREC loss was higher with increasing age. TRECs correlated with naive CD4+ T cells, whereas there was an inverse relationship between TRECs and CD8+HLA−DR+ and CD8+CD45RA−CD62L+/RA+CD62L− T cells. Our results suggest the presence of a defect in the naive T cell compartment with origin at the thymic level in CVID, and indicate that TREC may be a useful marker to monitor thymic function in this primary immunodeficiency.
Keywords: gene, rearrangement, immunodeficiency, diseases, thymus, T, lymphocytes
INTRODUCTION
Common variable immunodeficiency (CVID) is a disease characterized by decreased serum level of immunoglobulins and recurrent bacterial infections, especially of the respiratory and gastrointestinal tracts [1]. Prevalence of autoimmune disorders, granulomatous diseases, neoplasias and malnutrition increase in CVID patients [2,3]. Most patients with CVID described to date have been sporadic, but several cases observed were associated to selective IgA deficiency in the same family [4]. Although susceptibility to infections and impaired antibody production are common in the majority of patients, they nevertheless show heterogeneous clinical and laboratory findings. The primary phenotypic defect is a failure in B cell differentiation leading to impaired secretion of immunoglobulins [1]. In fact, based on the responses of purified B cells to sepharose-bound antibodies against surface IgM and IL-2, patients were classified into three distinct stages of B cell defect [5]. In addition to B cell defect, variable degrees of T cell dysfunctions have been noted frequently in CVID patients. These abnormalities include: cutaneous anergy to recall antigens, impaired lymphocyte proliferation after mitogen stimulation [6], defective antigen-driven responses due to a reduction in antigen-specific CD4+ T cell precursors with abnormal antigen handling [7–9] and deficient secretion and lymphokine gene expression [10,11]. Several CVID patients have a defect in CD4+ T cell priming to antigen, as measured by the numbers of circulating responsive cells following immunization [12]. Antibody responses to proteins, polysaccharides and neoantigens are abnormal to varying degrees [13,14]. In approximately one-third of the patients, T cells are decreased as absolute numbers, with an inversion of CD4/CD8 ratio due to reduced CD4+ T cell numbers, especially of the CD4+CD45RA+ (naive) phenotype, while B cell numbers are often normal [15–18]. To explain the low T cells numbers, some researchers have proposed several hypotheses including deficient IL-2 production [19] and/or increased apoptosis, due to the persistent antigen activation following infections [6]. However, the production of naive T cells in these patients has not been investigated in detail. Thymic activity may be insufficient in replenishing the pool of peripheral blood lymphocytes in CVID. Although after birth the thymus undergoes a process of involution, recent data suggest that the normal adult thymus may continue to contribute, even in older individuals, with de novo T cell generation [20,21]. Phenotypic markers that distinguish between recent thymic emigrants (new T cells) and the rest of the peripheral T cell pool are still lacking. Despite the number of phenotypically naive T cells that seem to be related to antigen-specific function, there are some limitations in estimating thymic function on the basis of naive T cell numbers alone. In fact, following thymic emigration, the naive T cells can have a long quiescent life span [22,23], may proliferate in an antigen-independent manner, and may also convert rapidly to memory/effector phenotype T cells, especially among those expressing T CD8+ phenotype [22–25]. Recently, an alternative biomarker known as T cell receptor excision circles (TRECs) has been proposed as being the indicator of recent thymic emigrants in human peripheral blood [26]. TRECs are generated during the V (D) J gene recombination, a process responsible for the diversity of the αβ and γδ T cell antigen receptor (TCR) repertoire. TRECs are extra-chromosomal, they are not replicated during mitosis and are thus diluted with each round of cell division [27]. TRECs were detected in T cells of the thymus, cord blood and adult peripheral blood. In peripheral blood, TRECs frequency is higher in the CD4+CD45RA+CD62L+ T cell subpopulation and decreases with increasing age [27]. In patients with acquired immunodeficiency syndrome (AIDS) [28] or after thymectomy, and with primary thymic hypoplasia such as DiGeorge syndrome [29], TREC levels decrease. In DiGeorge syndrome after thymic transplantation and in severe combined immunodeficiency (SCID) after bone marrow transplantation, the rise of T cells and naive CD4+ T lymphocytes is associated with an increase in TRECs [29,30].
Since patients with CVID show T cells deficiency, we have analysed T lymphocyte subpopulations in the peripheral blood of 17 CVID patients to evaluate if, in the presence of the functional damage described previously, the thymic output was also altered. To measure thymic output at peripheral blood level, TRECs were evaluated in CD4+ and CD8+ T cells in CVID patients and in normal subjects. Their levels were also correlated with immunological and clinical parameters.
MATERIALS AND METHODS
Patients
Seventeen patients affected by CVID and followed at the Division of Allergy and Clinical Immunology, University of Rome ‘La Sapienza’, were included in the study. The CVID diagnosis was made according to the criteria of a WHO expert group for primary immunodeficiency diseases [1]. Patients were nine females and eight males ranging in age from 24 to 61 years (mean 47 years). Main clinical and immunological characteristics of the patients are reported in Table 1. All subjects were under regular substitution therapy with intravenous (i.v.) immunoglobulin at the standard dose of 400 mg/kg body weight at 3–4 week intervals for several years. Pretherapy IgG values and preinfusion serum IgG levels measured the day before i.v. immunoglobulin administration were reported in Table 1. Only one patient (no. 8) was studied before starting i.v. immunoglobulin therapy. In all subjects, biochemical and haematological tests were collected every 3 months. HBV surface antigen and HCV-RNA were also screened every 6 months. To assess patients' clinical conditions, a scoring system has been elaborated and the following parameters collected retrospectively during the previous 3 years: presence (= 1) or absence (= 0) of three or more of severe bacterial infections and/or recurrent less severe infectious episodes [31]. The presence of impaired bowel absorption and the decreased body weight were also evaluated [3]. CVID subjects were also stratified according to their circulating CD4+ T cell numbers ( >or <500/μl) during the previous 3 years and at the beginning of this study. As normal controls, 15 healthy donors (students and staff at our institution) were matched by sex and age with the patients that were studied. At the time in which the blood was collected neither the CVID subjects or the healthy individuals had any acute infections. All subjects gave their written informed consent to the study, according to Ethical Committee procedures at our Institution.
Table 1.
Clinical and immunological characteristics of CVID patients
| P | Sex | Age | Scorea | IgGb | IgGc | IgAc | IgMc | CD19d | CD4d | CD8d | CD4/CD8e |
|---|---|---|---|---|---|---|---|---|---|---|---|
| 1 | F | 45 | 0 | 50 | 594 | <4·3 | <5·8 | 163 | 618 | 1053 | 0·6 |
| 2 | M | 33 | 0 | 70 | 779 | 49 | <5·8 | 241 | 602 | 443 | 1·3 |
| 3 | M | 33 | 0 | 36 | 623 | 12 | <5·8 | 286 | 936 | 565 | 1·7 |
| 4 | F | 61 | 1 | 75 | 515 | 6 | <5·8 | 252 | 1414 | 655 | 2·1 |
| 5 | M | 54 | 1 | 23 | 515 | 9 | <5·8 | 1987 | 550 | 1041 | 0·5 |
| 6 | M | 49 | 0 | 112 | 567 | 13 | 8 | 96 | 675 | 375 | 1·8 |
| 7 | F | 59 | 0 | 85 | 466 | 56 | <6·4 | 393 | 564 | 1054 | 0·5 |
| 8 | F | 40 | 1 | 200 | 500 | 33 | 72 | 490 | 1592 | 464 | 3·4 |
| 9 | F | 61 | 1 | 120 | 534 | 9 | <5·8 | 100 | 337 | 590 | 0·6 |
| 10 | M | 42 | 0 | 270 | 887 | 20 | 8 | 106 | 406 | 253 | 1·6 |
| 11 | F | 57 | 1 | 45 | 596 | 30 | <5·8 | 145 | 306 | 382 | 0·8 |
| 12 | M | 34 | 1 | 56 | 429 | <4·3 | <5·8 | 13 | 254 | 267 | 1·0 |
| 13 | F | 50 | 0 | 215 | 668 | <17 | <5·8 | 126 | 429 | 1218 | 0·4 |
| 14 | F | 24 | 0 | 297 | 530 | 18 | 14 | 73 | 489 | 301 | 1·6 |
| 15 | M | 52 | 1 | 90 | 365 | <4·3 | 6 | 183 | 382 | 258 | 1·5 |
| 16 | F | 58 | 0 | 118 | 594 | 23 | 9 | 57 | 286 | 410 | 0·7 |
| 17 | M | 49 | 1 | 170 | 558 | <4·3 | 6 | 0 | 411 | 1267 | 0·3 |
To assess patient's clinical conditions a scoring system has been elaborated and the following parameters collected retrospectively during a 3-year follow-up: presence (= 1) or absence (= 0) of three or more of severe bacterial infections and/or recurrent less severe infectious episodes.
IgG values (mg/dL) before starting IVIG treatment.
IgG, IgA and IgM values are expressed as mg/dL.
CD19+, CD4+ and CD8+ absolute numbers are expressed as cells/μl.
Ratio.
Serum immunoglobulin analysis
Serum concentrations of IgG, IgM and IgA were measured by immunonephelometry (Behring 100, Stuttgart, Germany), using N antisera to human immunoglobulins (IgG, IgM and IgA) (Dade Behring Marburg GmbH). Normal laboratory ranges for serum immunoglobulins were: IgG 690–1400 mg/dL, IgM 40–240 mg/dL and IgA 70–370 mg/dL.
Flow-cytometric analysis of CD4+ and CD8+ T cell subsets
Whole blood, 500 μl, was lysed using 10 ml of Ortho-mune Lysing Reagent (Ortho Diagnostic Systems Inc., Raritan, NJ, USA), washed and labelled with a cocktail of four monoclonal antibodies (MoAbs) for 30 min at 4°C. The peripheral redistribution of naive, memory and activated T cells was investigated by evaluating the differential expression of CD45RA, CD62L and HLA-DR molecules on both CD4+ and CD8+ T cells. Anti-CD4-allophycocyanin (APC), anti-CD8 peridinin chlorophyll protein (PerCP), anti-CD45RA-fluorescein isothiocyanate (FITC), anti-CD62L phycoerytrin (PE) and anti-HLA-DR (FITC) were purchased from Becton Dickinson PharMingen (San Diego, CA, USA). After staining, cells were washed once in phosphate-buffered saline (PBS) containing 2% fetal bovine serum (FBS) and analysed on a FACSCalibur cytofluorometer (Becton Dickinson, Mountain View, CA, USA) using the Cell Quest software. To determine marker expression on CD4+ and CD8+ T cells, total lymphocytes were first identified and gated by forward and side scatter. The cells were then additionally gated for CD4 or CD8 expression. Ten thousand gated events were collected for each sample. Appropriate isotypic negative controls were run in parallel.
Magnetic cell sorting
Peripheral blood mononuclear cells (PBMC) were isolated from heparinized venous blood of CVID patients and normal donors by Ficoll-Isopaque (Lymphoprep-Nycomed, Oslo, Norway) gradient centrifugation. CD4+ and CD8+ T cells were separated using magnetic beads coated with anti-CD4 and anti-CD8 MoAbs according to the manufacturer's protocols (Dynabeads, Dynal, Oslo, Norway). Purity of separated cells was >90%, as determined by flow-cytometry.
Quantitative PCR analysis of TRECs
Real time PCR analysis was performed on CD4+ and CD8+ T cells with TREC specific primers to detect recent thymic emigrants, and on the glyceraldehyde-3-phosphate dehydrogenase (GAPDH) to standardize for DNA content. For TREC PCR, the following primers and probe were used: forward 5′-TGGTTTTTGTAAAGGTGCCCAC-3′ (50nm), reverse 5′-GTGCCAGCTGCAGGGTTT-3′ (50nm) and the oligo 5′(FAM)CATAGGCACCTGCACCCCGTGC(TAMRA)p-3′ (250 nm) as a detection probe. The GAPDH gene was amplified with the primers GAPDH-D1 forward 5′-ACCACAGTCCATGCCATCACT-3′ (300 nm) and GAPDH-D2 reverse 5′-GGCCATCACGCCACAGITT-3′ (900 nm) using as a probe the oligo GAPDH-DP 5′(TET)CCACCCAGAAGACTGTGGATGGCC(TAMRA)p-3′ (175 nm). A standard curve was prepared by serial dilutions of a plasmid encoding the sequence of α1 circles [28], obtained after amplification of human cord blood genomic DNA using the primers forward 5′-AAAGAGGGCAGCCCTCTCCAAGGCAAAA-3′ and reverse 5′-ACTTCCATCGCAATTCAGGACTCACTT-3′. To ensure homogeneous amplification conditions, the standard plasmid was diluted into human DNA from a cell line devoid of TREC. Amplification reactions (25 μl) contained 100 ng of genomic DNA extracted from PBLs or standards, TaqMan universal PCR master mix (Perkin Elmer Applied Biosystem, Foster City, CA, USA), and the appropriate primers and probes. All reactions were performed in the Model 7700 Sequence Detector using standard parameters and analysed using the GeneAmp software developed by Perkin Elmer Applied Biosystems. The amount of TREC per 100 ng of DNA was determined on the basis of the standard curve, with a lower limit of detection of 3 copies/100 ng of genomic DNA.
Statistical analyses
The Mann–Whitney U-test (P-values) was used for unpaired comparisons of TREC levels and T cell subset phenotype markers between CVID patients and healthy individuals. A simple regression test Spearman's rank correlation coefficient (r-values)] was used to correlate the group characteristics. Values were transformed to log10 in all analyses. A P-value less than 0·05 and a r-value greater than 0·5 or less than −0·5 were considered significant. Statistical analyses were performed by using Statview 5·0 software (SAS Institute, Cary, NC, USA).
RESULTS
Patient's features
Patients under i.v. immunoglobulin treatment showed a mean value of serum IgG level of 571 mg/dL associated generally with low or undetectable IgA and IgM serum levels (Table 1). Despite this, all but one patient had a normal (or moderately low) number of circulating B cells. All males underwent the B tyrosine kinase (BTK) test and resulted negative (data not shown). According to the scoring system, 8/17 subjects suffered from three or more infectious episodes/year despite i.v. immunoglobulin treatment (see Table 1) and 4/17 showed impaired bowel absorption with a moderate body weight loss. There was no evidence of autoimmune disorders, granulomatous diseases or neoplasias in any of the patients. No one showed altered results of liver and kidney functions or a positivity for hepatitis B virus (HBV) surface antigen, whereas three subjects (nos 6, 13 and 15) resulted positive for hepatitis C virus (HCV) infection. Following the results of liver biopies and the normality of the enzyme values, none of the patients was receiving treatment.
Analysis of CD4+ and CD8+ T cell subsets
Results of T cell phenotypes on CD4+ and CD8+ T cell subsets in CVID and in healthy individuals are detailed in Table 2. CVID subjects presented significantly lower CD4+ T cells (P <0·001) in comparison to the controls and this reduced number was observed both in CD45RA+CD62L+ (naive phenotype) and in CD45RA+CD62L−/CD45RA+CD62L+ (memory phenotype) subsets. This situation remained unchanged, as expressed by the data in percentages, with the exception of the memory CD4+ T cells, which increased significantly in patients. The percentage of CD4+HLA-DR+ T cells were significantly higher in comparison to healthy individuals (P <0·01). CD8+ T cell numbers did not differ significantly between patients and controls; despite this, the percentage of CD8+ naive T cells was significantly lower in CVID individuals. Both CD8+ T cells expressing the memory phenotype and CD8+HLA-DR+ T cells were increased in CVID patients (P <0·01 versus healthy individuals). When patients were stratified according to either their baseline CD4+ T cell numbers (>500 or <500/μl) or to the clinical scores (more or less than three infective episodes/year), no significant changes in the distribution of the CD4+ and CD8+ T cell subsets were observed.
Table 2.
Analysis of T cell subsetsa in CVID patients and healthy individuals
| CVID individualsb | Healthy individualsb | P | |
|---|---|---|---|
| CD4+T (cells/μl) | 541 ± 290 | 954 ± 241 | <0·01 |
| (254–1592) | (603–1523) | ||
| CD4+HLA-DR+(%) | 17 ± 11 | 6 ± 1 | <0·01 |
| (5–42) | (4–10) | ||
| CD4+HLA-DR+(cells/μl) | 83 ± 67 | 57 ± 25 | n.s.c |
| (22–296) | (0–95) | ||
| CD4+CD45RA+CD62L+(%) | 22 ± 14 | 45 ± 9 | <0·0001 |
| (4–51) | (32–65) | ||
| CD4+CD45RA+CD62L+(cells/μl) | 127 ± 117 | 433 ± 153 | <0·0001 |
| (15–477) | (267–813) | ||
| CD4+CD45RA−CD62L+ + CD4+CD45RA+CD62L−(%) | 54 ± 9 | 41 ± 7 | <0·001 |
| (42–81) | (29–53) | ||
| CD4+CD45RA−CD62L+ + CD4+CD45RA+CD62L−(cells/μl) | 285 ± 134 | 386 ± 93 | <0·05 |
| (158–721) | (248–580) | ||
| CD8+T (cells/μl) | 633 ± 366 | 429 ± 180 | n.s.c |
| (253–1267) | (222–790) | ||
| CD8+HLA-DR+(%) | 39 ± 19 | 20 ± 10 | <0·01 |
| (11–74) | (8–39) | ||
| CD8+HLA-DR+(cells/μl) | 275 ± 250 | 87 ± 79 | <0·01 |
| (46–770) | (0–292) | ||
| CD8+CD45RA+CD62L+(%) | 38 ± 15 | 54 ± 14 | <0·01 |
| (16–66) | (28–79) | ||
| CD8+CD45RA+CD62L+(cells/μl) | 227 ± 145 | 222 ± 279 | n.s.c |
| (66–499) | (98–345) | ||
| CD8+CD45RA−CD62L+ + CD8+CD45RA+CD62L−(%) | 43 ± 10 | 30 ± 13 | <0·01 |
| (28–63) | (9–63) | ||
| CD8+CD45RA−CD62L+ + CD8+CD45RA+CD62L−(cells/μl) | 273 ± 174 | 142 ± 127 | <0·01 |
| (73–658) | (39–457) |
T cell subsets were investigated by flow cytometry (see Materials and methods).
Each value represents the mean ± s.d. and ranges are depicted in parenthesis. Statistical significance was calculated with Mann–Whitney test; P <0·05 was considered significant.
n.s.: not significant.
Analysis of TREC levels
As depicted in Fig. 1, TREC levels in CD4+ and CD8+ T cells were reduced significantly in CVID patients when compared with age-matched healthy individuals. In CVID individuals there was an inverse correlation between age and TREC levels, both in CD4+ and in CD8+ T cells (Fig. 2a), as observed in healthy subjects (Fig. 2b). However, the slopes of the regression curves (x) for CVID subjects were higher than those observed in control individuals (x = 0·027 versus 0·011 in CD4+ T cells, and x = 0·036 versus 0·016 in CD8+ T cells), suggesting that the rate of TREC loss is higher with increasing age. Indeed, when patients were subdivided into two groups according to their age (<45 or >45 years), the difference in TREC levels in CD4+ and CD8+ T cells was less pronounced in the lower age (59 ± 54 versus 121 ± 93 in CD4+ T cells and 60 ± 44 versus 155 ± 106 in CD8+ T cells; P = n.s.) than in the higher age group (20 ± 30 versus 67 ± 57 in CD4+ T cells and 12 ± 16 versus 93 ± 103 in CD8+ T cells; P <0·05, data not shown). Patients with high naive CD4+ T cells had a higher TREC content (Fig. 3), whereas this correlation did not exist for the CD8+ T cell compartment. TREC levels in CD8+ T cells correlated inversely with both the numbers of CD8+HLA-DR+ T cells and the CD8+RA−62 l+/RA+62 l− (memory) T cells as shown in Fig. 4, whereas this trend was not correlated significantly between the CD4+HLA-DR+ T cells and the TREC values in the CD4+ T cell compartment (data not shown).
Fig. 1.
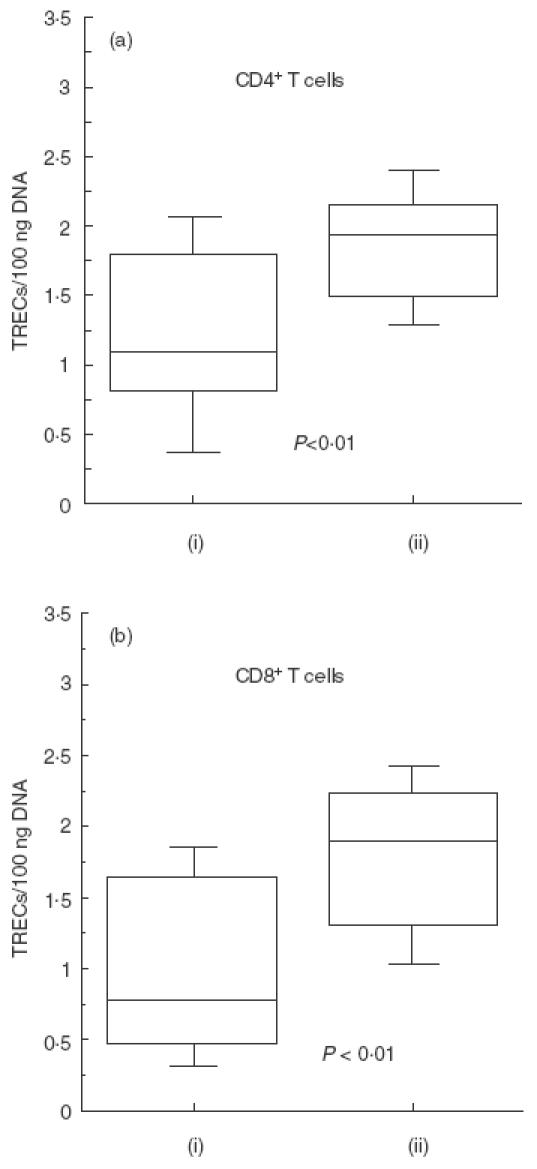
Analysis of TRECs (log10) in CD4+ and CD8+ T cells in CVID (i) and in healthy individuals (ii). PBMC were isolated from heparinized venus blood of CVID patients and normal donors by Ficoll-Isopaque (Lymphoprep-Nycomed, Oslo, Norway) gradient centrifugation. CD4+ and CD8+ T cells were separated using magnetic beads coated with anti-CD4 and anti-CD8 MoAbs. Real time PCR analysis was performed on CD4+ and CD8+ T cells with TREC specific primers to detect recent thymic emigrants, and on the GAPDH to standardize for DNA content. TREC levels in CD4+ (a) and in CD8+ (b) T cells were significantly reduced in CVID patients when compared with age-matched healthy individuals.
Fig. 2.
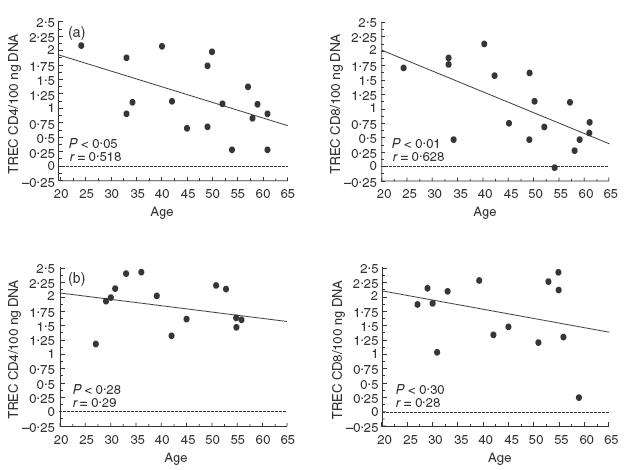
Distribution of TRECs in CD4+ and CD8+ T cells according to age in CVID patients (a) and in healthy subjects (b). CD4+ and CD8+ T cells were isolated in 17 CVID patients and 15 normal subjects ranging in age from 24 to 61 years, as described in Materials and methods. TREC levels were quantified using RT-PCR and values (copies/100 ngDNA) were transformed to log10. The Pearson's correlation coefficient (r) and the regression line are indicated in the figures.
Fig. 3.
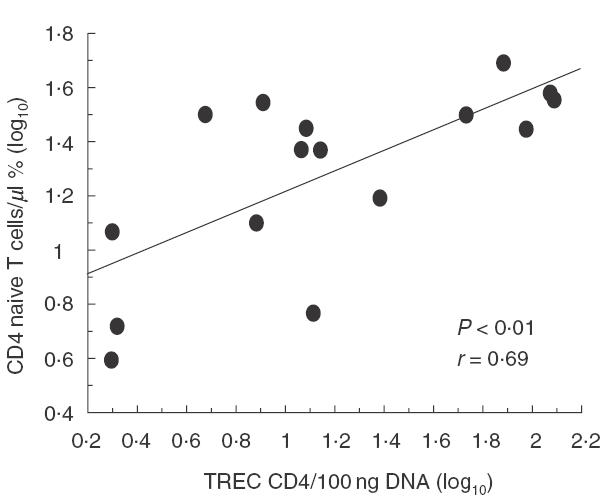
Correlation between percentage of naive (CD45RA+CD62L+) CD4+ T cells and TREC levels in CD4+ T cells (log10). The data indicate that there is a direct correlation between naive CD4+ phenotype and TREC levels in our cohort. Pearson's correlation coefficient (r) and P-value are indicated within the figure.
Fig. 4.
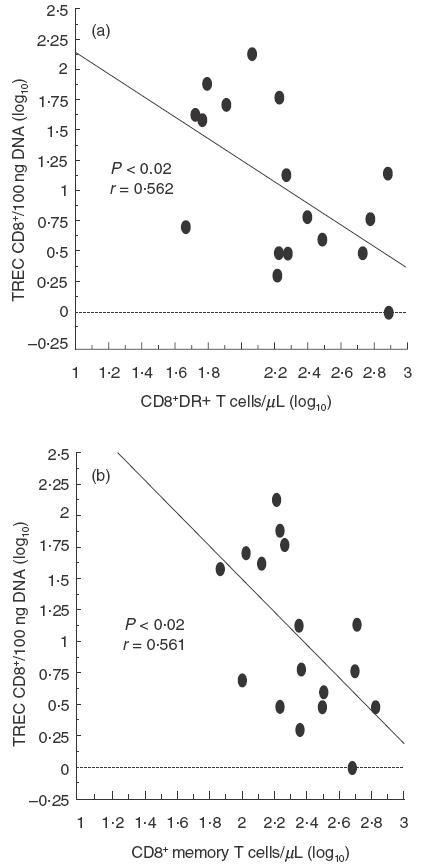
Correlation between TREC levels (log10) in activated (HLA-DR+) and memory (CD45RA+CD62L− + CD45RA−CD62L+) CD8+ T cells (log10). Activated CD8+ T cells (a) are correlated inversely with TRECs as well as memory (b) CD8+ T cells. Pearson's correlation coefficients (r) and P-values are indicated within the figure.
DISCUSSION
CVID is a multi-factorial and still poorly understood syndrome. In fact, there is evidence that the susceptibility gene is linked to the class III MHC region [4,32]. There is no convincing evidence for any intrinsic B cell defect of immunoglobulin genes, synthesis or secretion, while B cells with appropriate stimulation can produce and secrete immunoglobulins. B cell activation and differentiation into plasma cells depend on cognate T–B cell interactions and stimulation through the receptor/ligand pairs CD40/CD40 ligand and CD28/CTLA-4-CD80/CD86 [33]. The integration of activating signals derived from TCR and co-stimulatory molecules is defective in CVID patients; the defect is not confined to co-stimulation via a single molecule or restricted to cells producing Th1 type cytokines such as IL-2, and is expressed in both CD4+ and CD8+ T cells [18,19]. Approximately 60% of CVID patients have diminished proliferative responses to TCR stimulation, and decreased induction of gene expression for IL-2, IL-4, IL-5 and IFNγ. Moreover, CD4+ and CD45R0+ T cells from some patients secrete abnormal amounts of interleukins upon stimulation with consequently B cell defective differentiation. Recent data suggest up-regulation of the Th1 cytokine IFNγ T cells, especially in subsets of CD8+ cells defined by their expression of the co-stimulatory molecule CD28 [24]. A qualitative defect of the antibody affinity maturation process associated to an abnormal Ig V gene mutation has been observed in patients who began CVID late in life [34]. Accurate genetic, immunological and clinical case definition may allow a more precise evaluation of the aetiological factors and the immunological abnormalities.
The thymus is the primary site of T lymphopoiesis during fetal and early postnatal life. Due to thymic involution, it has been suggested that the adult thymus does not contribute to the new T cell replacement. However, recent data have indicated that the thymus remains functional in adults as well [28]. Thymopoietic defect results in a decreased ability to generate new T cells. There are no phenotypic markers that distinguish between recent thymic emigrants and the rest of peripheral naive T cell pool. The evaluation of TREC frequencies in pheripheral T cells can be a useful indicator of the de novo production of T lymphocytes. Analysis of TREC levels in CVID subjects revealed a significantly diminished content both in CD4+ and in CD8+ T compartments, compared to the levels observed in age-matched healthy controls. A different trend of age-related decline of TREC levels was observed in patients in comparison to controls because the reduced TREC content was more severe in older individuals. These results suggest a more rapid reduction of thymic output in CVID individuals. Decreased values of CD4+ T cells are seen often in CVID patients and they are described predominantly in the CD45RA+CD62L+ population [32,35]. Our findings are in agreement with these results. In fact, a significant decrease in total lymphocyte counts and specifically in CD4+ T cells was observed. Also the CD4+CD45RA+CD62L+ T cell subset was significantly reduced in our cohort and correlated with the diminished content of TRECs observed in the CD4+ T cells, suggesting a reduced de novo production of T cells by the thymus in CVID patients. The finding of low levels of TREC associated with increased CD8+ memory T cells was not unexpected, as these cells are derived from naive cells after antigen-induced proliferation, during which TRECs are diluted. The circulating CD8+CD45RA+ T cell subpopulation is less clearly associated with human thymic tissue [33] and the use of such a phenotypic marker as a direct indicator of thymic output should be considered with caution. In fact, evaluation of CD45RA expression is not capable of fully discriminating naive from memory T cells. In particular, it has been shown that memory T cells expressing CD45R0 that fail to re-encounter the specific antigen may revert to a CD45RA+ phenotype [24]. However, the expression of CD62L remains down-regulated in such ‘revertants’, thus allowing a more detailed determination of naive T cells [25]. The decline in TREC levels observed with age in CVID patients may also be due to enhanced cellular activation and proliferation in the CD4+or the CD8+ compartments. In our patients there was an increased percentage of activated T cells. This finding may be related to the more frequent infectious episodes observed in CVID subjects and the increased rate of activated T cells may also contribute to the dilution of TRECs observed. In fact, there was an inverse relation between TREC levels and percentage of CD4+ and CD8+HLA-DR+ T cells. Moreover, the low levels of TREC observed in CVID patients was not linked to the frequencies of infectious episodes. The TREC content of a naive T cell population may depend to various extents on thymic production, cell death and cell division, priming of naive T cells to become memory lymphocytes and intracellular degradation of TRECs [26]. A recent report in a cohort of infants with SCID demonstrated that although TRECs appeared in the first years after haplo-identical bone marrow transplation (BMT), TREC levels declined after the second year and became undetectable in patients receiving a transplant more than 10 years earlier [30]. An explanation for the apparently poorer thymic function observed in SCID may reside in a severe irreversible thymic damage, a phenomenon that has been observed in murine models [36]. A similar thymic defect may exist in some CVID patients at the thymic level or in the bone marrow microenvironment (our own unpublished data), where the stromal cells have an important role in sustaining haemato-lymphopoiesis. Recently, IL-2 was administered for a long period to CVID patients with associated numerous T cell defects, demonstrating a partial correction of cell mediated immunity as well as of antibody production after immunization [37]. IL-7 is a stroma-derived cytokine that is the major growth factor for thymopoiesis and is produced normally by thymic epithelial cells. Systemic administration of recombinant IL-7 to murine BMT recipients normalizes thymopoiesis and improves post-BMT immune function [38,39]. The administration of cytokines may be able to increase thymic functions and could be considered as a future strategy for treatment of CVID patients with impaired thymic function. In conclusion, in CVID subjects the evaluation of TREC levels may be a useful marker to monitor reduced, recent thymic emigrant T cells in peripheral blood and should be considered an important immunological abnormality. It remains to be clarified if the damage of cell compartment is due to an altered generation of new T cells from haematopoietic stem progenitor cells or related to a defect in thymic epithelial cell compartment.
Acknowledgments
This paper was supported by a grant of the University of Rome ‘La Sapienza’, Progetti di Ateneo to F. A. and by a grant of the Faculty of Medicine (University of Rome ‘La Sapienza’) 1999–2001 to F. A. and partly by a grant of Fondazione Telethon to A. A.
REFERENCES
- 1.Report of a WHO Scientific Group. Primary immunodeficiency diseases. Clin Exp Immunol. 1999;118(Suppl. 1):1–28. doi: 10.1046/j.1365-2249.1999.00109.x. [DOI] [PMC free article] [PubMed] [Google Scholar]
- 2.Cunningham-Rundles C, Bodian C. Common variable immunodeficiency: clinical and immunologic features of 248 patients. Clin Immunol. 1999;92:34–48. doi: 10.1006/clim.1999.4725. 10.1006/clim.1999.4725. [DOI] [PubMed] [Google Scholar]
- 3.Muscaritoli M, Fanfarillo F, Luzi G, et al. Impaired nutritional status in CVID patients correlates with reduced levels of serum IgA and of circulating CD4 T lymphocytes. Eur J Clin Invest. 2001;31:544–9. doi: 10.1046/j.1365-2362.2001.00838.x. [DOI] [PubMed] [Google Scholar]
- 4.Hammarström L, Smith CIE. Genetic approach to common variable immunodeficiency and IgA deficiency. In: Ochs HD, Smith CIE, Puck JM, editors. Primary immunodeficiency diseases. New York: Oxford University Press; 1999. pp. 250–62. [Google Scholar]
- 5.Saiki O, Ralph P, Cunningham-Rundles C, Good RA. Three distinct stages of B-cell defect in common variable immunodeficiency. PNAS. 1982;79:6008–12. doi: 10.1073/pnas.79.19.6008. [DOI] [PMC free article] [PubMed] [Google Scholar]
- 6.Di Renzo M, Zhou Z, George I, Becker K, Cunningham-Rundles C. Enhanced apoptosis of T cells in CVID: role of defective CD28 co-stimulation. Clin Exp Immunol. 2000;120:503–12. doi: 10.1046/j.1365-2249.2000.01239.x. [DOI] [PMC free article] [PubMed] [Google Scholar]
- 7.Stagg AJ, Funauchi M, Knight SC, Webster ADB, Farrant J. Failure in antigen responses by T cells from patients with common variable immunodeficiency. Clin Exp Immunol. 1994;96:48–53. doi: 10.1111/j.1365-2249.1994.tb06228.x. [DOI] [PMC free article] [PubMed] [Google Scholar]
- 8.Thon V, Wolf HM, Sasgary M, et al. Defective integration of activating signals derived from the T cell receptor (TCR) and costimulatory molecules in both CD4+ and CD8+ T lymphocytes of common variable immunodeficiency patients. Clin Exp Immunol. 1997;110:174–81. doi: 10.1111/j.1365-2249.1997.tb08314.x. [DOI] [PMC free article] [PubMed] [Google Scholar]
- 9.Funauchi M, Farrant J, Moreno C, Webster ADB. Defects in antigen driven lymphocyte responses in common variable immunodeficiency (CVID) are due to a reduction in the number of antigen-specific CD4 T cells. Clin Exp Immunol. 1995;101:82–8. doi: 10.1111/j.1365-2249.1995.tb02281.x. [DOI] [PMC free article] [PubMed] [Google Scholar]
- 10.Zielen S, Bauscher P, Hofmann D, Meuer SC. Interleukin 10 and immune restoration in common variable immunodeficiency. Lancet. 1993;342:750–1. [PubMed] [Google Scholar]
- 11.Sneller MC, Strober W. Abnormalities of lymphokines gene expression in patients with common variable immunodeficiency. J Immunol. 1990;144:3762–9. [PubMed] [Google Scholar]
- 12.Stagg AJ, Funauchi M, Knight SC, Webster ADB, Farrant J. Failure in antigen responses by T cells from patients with common variable immunodeficiency (CVID) Clin Exp Immunol. 1994;96:48–53. doi: 10.1111/j.1365-2249.1994.tb06228.x. [DOI] [PMC free article] [PubMed] [Google Scholar]
- 13.Iglesias J, Matamoros N, Raga S, Ferrer JM, Mila J. CD95 expression and function on lymphocyte subpopulations in common variable immunodeficiency. Clin Exp Immunol. 1999;117:138–46. doi: 10.1046/j.1365-2249.1999.00946.x. [DOI] [PMC free article] [PubMed] [Google Scholar]
- 14.Ochs HD, Winkelstein J. Disorders of the B cell system. In: Sthiliem ER, editor. Immunologic disorders in infants and children. Philadelphia: WB Sanders; 1996. pp. 296–11. [Google Scholar]
- 15.Farrant J, Spickett GP, Matamoros N, et al. Study of B and T cell phenotypes in blood from patients with common variable immunodeficiency. Immunodeficiency. 1994;5:159–69. [PubMed] [Google Scholar]
- 16.Pandolfi F, Corte G, Quinti I, et al. Defect of T helper lymphocytes, as identified by the 5/9 monoclonal antibody, in patients with common variable hypogammaglobulinaemia. Clin Exp Immunol. 1983;51:470–4. [PMC free article] [PubMed] [Google Scholar]
- 17.Pandolfi F, Trentin L, San Martin JE, Wong JT, Kurnick JT, Moscicki RA. T cell heterogeneity in patients with common variable immunodeficiency as assessed by abnormalities of T cell subpopulations and T cell receptor gene analysis. Clin Exp Immunol. 1992;89:198–03. doi: 10.1111/j.1365-2249.1992.tb06932.x. [DOI] [PMC free article] [PubMed] [Google Scholar]
- 18.Spickett GP, Farrant J, North ME, Zhang JG, Morgan L, Webster ADB. CVID: how many diseases? Immunol Today. 1997;18:325–8. doi: 10.1016/s0167-5699(97)01086-4. [DOI] [PubMed] [Google Scholar]
- 19.North ME, Ivory K, Funauchi M, Webster ADB, Lane AC, Farrant J. Intracellular cytokine production by human CD4 and CD8 T cells from normal and immunodeficient donors using directly conjugated anti-cytokine antibodies and three-colour flow cytometry. Clin Exp Immunol. 1996;105:517–22. doi: 10.1046/j.1365-2249.1996.d01-795.x. [DOI] [PMC free article] [PubMed] [Google Scholar]
- 20.Tough DF, Sprent J. Turnover of naive- and memory-phenotype T-cells. J Exp Med. 1994;179:1127–35. doi: 10.1084/jem.179.4.1127. [DOI] [PMC free article] [PubMed] [Google Scholar]
- 21.McLean AR, Michie CA. In vivo estimates of division and death rates of human T lymphocytes. PNAS. 1995;92:3707–11. doi: 10.1073/pnas.92.9.3707. [DOI] [PMC free article] [PubMed] [Google Scholar]
- 22.Soares MV, Borthwick NJ, Maini MK, Janossy G, Salmon M, Akbar AN. IL-7 dependent extrathymic expansion of CD45RA+T-cells enables preservation of a naive repertoire. J Immunol. 1998;161:5909–17. [PubMed] [Google Scholar]
- 23.Picker LJ, Treer JR, Ferguson-Darnell B, Collins PA, Buck D, Terstappen LW. Control of lymphocyte recirculation in man. J Immunol. 1993;150:1105–21. [PubMed] [Google Scholar]
- 24.Bell EB, Sparshott SM, Bunce C. CD4+ T-cell memory, CD45R subsets and the persistence of antigen – a unifying concept. Immunol Today. 1998;19:60–4. doi: 10.1016/s0167-5699(97)01211-5. [DOI] [PubMed] [Google Scholar]
- 25.Picker LJ, Treer JR, Ferguson-Darnell B, Collins PA, Bergstresser PR, Terstappen LW. Control of lymphocyte recirculation in man. II. Differential regulation of the cutaneous lymphocyte-associated antigen, a tissue-selective homing receptor for skin-homing T cells. J Immunol. 1993;150:1122–36. [PubMed] [Google Scholar]
- 26.Kong FK, Chen CL, Six A, Hockett RD, Cooper MD. T cell receptor gene deletion circles identify recent emigrants in the peripheral T cell pool. PNAS. 1999;96:1536–40. doi: 10.1073/pnas.96.4.1536. [DOI] [PMC free article] [PubMed] [Google Scholar]
- 27.McFarland RD, Douek DC, Koup RA, Picker LJ. Identification of a human recent thymic emigrant phenotype. PNAS. 2000;97:4215–20. doi: 10.1073/pnas.070061597. [DOI] [PMC free article] [PubMed] [Google Scholar]
- 28.Zhang L, Lewin SR, Markowitz M, et al. Measuring recent thymic emigrants in blood of normal and HIV-1-infected individuals before and after effective therapy. J Exp Med. 1999;190:725–32. doi: 10.1084/jem.190.5.725. [DOI] [PMC free article] [PubMed] [Google Scholar]
- 29.Markert ML, Boec A, Hale LP, et al. Transplantation of thymus tissue in complete DiGeorge syndrome. N Engl J Med. 1999;341:1180–9. doi: 10.1056/NEJM199910143411603. [DOI] [PubMed] [Google Scholar]
- 30.Patel DD, Gooding ME, Parrott RE, Curtis KM, Haynes BF, Buckley RH. Thymic function after hematopoietic stem-cell transplantation for the treatment of severe combined immunodeficiency. N Engl J Med. 2000;342:1325–32. doi: 10.1056/NEJM200005043421804. [DOI] [PubMed] [Google Scholar]
- 31.Luzi G, Pesce AM, Rinaldi S. Primary immunodeficiencies in Italy. Data revised from the Italian Register of Immunodeficiencies – RID (1977–88) Allergol Immunopathol. 1991;19:53–7. [PubMed] [Google Scholar]
- 32.Spickett GP. Current perspectives on common variable immunodeficiency. Clin Exp Allergy. 2001;31:536–42. doi: 10.1046/j.1365-2222.2001.01117.x. [DOI] [PubMed] [Google Scholar]
- 33.Heitger A, Neu N, Keru H, et al. Essential role of the thymus to reconstitute naive (CD45RA+) T-helper cells after human allogenic bone marrow transplantion. Blood. 1997;90:850–7. [PubMed] [Google Scholar]
- 34.Bonhomme D, Hammarstrom L, Webster D, et al. Impaired antibody affinity maturation process characterizes a subset of patients with common variable immunodeficiency. J Immunol. 2000;165:4725–30. doi: 10.4049/jimmunol.165.8.4725. [DOI] [PubMed] [Google Scholar]
- 35.Zhang JG, Morgan L, Spickett GP. L- selectin in patients with common variable immunodeficiency (CVID): a comparative study with normal individuals. Clin Exp Immunol. 1996;104:275–9. doi: 10.1046/j.1365-2249.1996.37744.x. [DOI] [PMC free article] [PubMed] [Google Scholar]
- 36.Hollander GA, Wang B, Nichogiannopoulou A, et al. Developmental control point in induction of thymic cortex regulated by a subpopulation of prothymocytes. Nature. 1995;373:350–3. doi: 10.1038/373350a0. [DOI] [PubMed] [Google Scholar]
- 37.Cunningham-Rundles C, Bodian C, Ochs HD, Martin S, Reiter-Wong M, Zhuo Z. Long-term low dose IL-2 enhances immune function in common variable immunodeficency. Clin Immunol. 2001;100:181–90. doi: 10.1006/clim.2001.5052. 10.1006/clim.2001.5052. [DOI] [PubMed] [Google Scholar]
- 38.Bolotin E, Smogorzewska M, Smith S, Widmer M, Weimberg K. Enhancement of thymopoiesis after bone marrow transplation by in vivo interleukin-7. Blood. 1996;88:1887–94. [PubMed] [Google Scholar]
- 39.Weinberg K, Blazar BR, Wagner JE, et al. Factors affecting thymic function after allogeneic hematopoietic stem cell transplantation. Blood. 2001;97:1458–66. doi: 10.1182/blood.v97.5.1458. [DOI] [PubMed] [Google Scholar]