

Abstract
An important thymus role has been suggested in T-cell repopulation after HAART in adult HIV-1 infected patients. Thymus volume increase after treatment has been described in HIV-1 infected children but not in adult patients. The objective of this work was to evaluate the effect of HAART on the thymic volume of adult HIV-1 infected patients and its relation with the T-cell repopulation. Twenty-one adult patients following 24 weeks under HAART were included in the study. All patients underwent a thoracic computed tomography (CT) evaluation for the measurement of thymic volumes at weeks 0, 12 and 24.
Baseline thymus volume showed a significant correlation with the patient's age. Thymic volume significantly increased after 24 weeks of HAART. Besides, a significant correlation between changes in the thymus volume and changes in both total and naïve CD4+ cell counts was found. Only patients with increases ≥100 CD4+ cell counts after treatment significantly increased the thymic volume.
These data show the first evidence of an early change in thymic volume of adult HIV-1 infected patients under HAART. This increase was related to the rise of both total and naïve CD4+ cell counts suggesting a functional role of thymic volume increase.
Keywords: Thymus volume, CT scan, CD4+ T cells, repopulation, HAART, HIV
INTRODUCTION
The introduction of a highly active antiretroviral therapy (HAART) on HIV-1 infected patients can considerably diminish the plasma viraemia levels reaching undetectable levels reached in many cases. This decrease in viral load may partially allow restoring the severe immune deficiency of patients by an immune system deactivation and a progressive increase of CD4+ T-cells. Besides the redistribution of T-cells sequestered in the lymph-node [1] and the peripheral expansion of preexisting T-cells [2,3], a neolymphopoyesis by the thymus has been postulated as a mechanism for T-cells increase after HAART [4,5].
In children, a thymus role in the T-cell reconstitution after HAART has been quite accepted due to less involution of the gland [6,7]. Less is known about thymus function in adults. New tools have been recently developed to better assess thymus function. Using a molecular marker of recent thymic emigrants, a DNA circle from the T-cell rearrangement process named TREC [8], an increase in naïve T-cells carrying this circle after HAART has been described [9]. Another approximation to assess the thymus role in HIV-1 infected patients would be the evaluation of thymic volume by computed tomography (CT). Using this approach, McCunne et al. [10] found abundant thymic tissue measured by a CT slice in half of the untreated adult HIV-1 infected patients over 39 years old. This same group observed that the evolution of naïve T-cells during the follow up was associated with larger thymuses at the end of the treatment period [11].
In adult HIV-1 infected patients, increases in thymic volume during treatment might reflect a thymus role in restoring T-cell depletion. As far as we know, variations in thymic size after HAART have not been described in adult patients. Therefore, the objective of the present work was to evaluate the effect of HAART on the thymic volume of naïve adult HIV-1 infected patients and its relation with the T-cell repopulation.
METHODS AND MATERIALS
Patients
From September to October 1998, 46 consecutive antiretroviral naïve HIV-1 infected patients starting HAART were included in the study. After obtaining written informed consent, a CT scan evaluation was performed at baseline and after 12 and 24 weeks of treatment. The Ethical Committee of the Hospital approved the present study. Twenty-one patients agreed to undergo a thoracic CT evaluation at baseline and have a thymus measurement at week 12 and 24 of treatment. Any patient without 12- or 24-week determination was excluded from the study. At least two nucleoside analogues and either one protease inhibitor or one nonanalogue reverse transcriptase inhibitor was considered HAART. Patients were evaluated at baseline and every 12 weeks. Both peripheral blood mononuclear cells (PBMC) from heparinized blood and serum samples from patients were obtained for determination. The characteristics of patients at baseline are summarized in Table 1. Patients with AIDS before treatment, were clinically stable at entry. AIDS was considered when development of any opportunistic infection and/or patients shown less than 200 CD4 ± cell counts/µl.
Table 1.
Baseline characteristics of the patients (n = 21)
| Age median (range) | 34 (25–60) |
| Sex (% male) | 17 (81) |
| Risk group | |
| IDU* | 9 (43) |
| Homosexual | 5 (24) |
| Heterosexual | 7 (33) |
| AIDS† | 11 (52·4) |
| CD4+ count/µl median (range) | 206 (8–804) |
| CD8+ count/µl median (range) | 751 (305–2173) |
| HIV RNA copies/ml median (range), n = 19‡ | 4·89 (2·98–5·58) |
IDU, Injected drug users
AIDS, Development of any opportunistic infection and/or less than 200 CD4+ cell counts/µl
Two patients had undetectable levels of plasma viraemia before starting the therapy, one of them infected by an HIV-2 subtype, nondetectable by the PCR technique used.
Computed tomography
CT was performed modifying the first described by Choyke et al. [12]. CT scans were obtained on a G.E. Sytec 3000 type scanner, taking 5 mm thick sections at 5 mm intervals (instead of 10 mm to improve the measurement precision) in the thymus fossae, then calculating and adding the ‘slice volume’ of each section to obtain measurements in cubic centimeters. The first and last slices were halved to account for partial-volume averaging (CT Sytec software, 2·02 version). A wide density range was used, between −900 and +900 Hounsfield Units (HU), in order to avoid incorrect measurements due to hardening beam artifacts. After that, the margin of the gland was delimited by the cursor in each section. Finally, the computer integrated all sections analysed, supplying a volumetric measurement in cubic centimeters.
Measurements were always performed by the same operator, blinded to all patients’ clinical data or week under treatment. It is important to underline that thymic volume measured by CT was due to thymic tissue but not to mediastinal fat placed in the compartment anterior of mediastinum, based on the different density observed (higher density for soft tissue and lower density for surrounding fat).
In measuring thymic volume by CT, we observed that when a clear fat border between the thymus tissue and the great vessels is displayed, thymic tissue was easily defined. On occasions, this fat separation was not present. Therefore, and whenever the patient's consent was obtained, intravascular infusion of contrast material was added (100 cc at 2 ml/s and 50 s of delay) in order to distinguish thymus from thoracic great vessels.
T-cells subpopulations
Absolute numbers of CD4+, CD8+ and CD3+ cells were determined in fresh samples at each patient's visit. A frozen aliquot was used to determine percentages of T-cell subsets as previously described [6]. Briefly, naïve and memory T-cell subsets were defined as CD4+CD45RA+CD45RO− (naïve CD4+ T-cells), CD4+CD45RA−CD45RO+ (memory CD4+ T-cells), CD8+CD45RA+CD11alow (naïve CD8+ T-cells) and CD8+CD45RA−CD11ahigh (memory CD8+ T-cells). Absolute counts of naïve and memory subsets of CD4+ or CD8+ T-cells were calculated by multiplying their representation in frozen samples by the absolute CD4+ and CD8+ T-cell subset counts obtained from fresh blood samples.
Plasma viraemia levels
HIV-RNA in plasma was measured by quantitative PCR (HIV MonitorTM Test Kit, Roche). The analytical sensitivity of the assay is 50 copies per ml of plasma.
Statistical analysis
Results for all continuous variables are expressed as the median [range]. Bivariate correlation was analysed by the nonparametric Spearman test. Comparisons between independent continuous variables were analysed by the Mann–Whitney U-test, and between dependent continuous variables by the Friedman test and by the Willcoxon matched pair signed rank test. Pearson χ2 test was used for comparing proportions. To estimate the correlation of increases in thymus volume with the increase in T-cells, the log10 of each variable was used because this transformation resulted in a normal distribution. Statistical analyses were performed using the SPSS inc. software package (Statistical Package for the Social Sciences, Chicago, Illinois, USA).
RESULTS
Basal thymic volume
Thymic volume was quite variable among the 21 patients prior to initiation of antiretroviral therapy. The median thymic volume was 2·38 cm3, with a range from 0 to 11·75 cm3. Thymic volume at baseline showed a significantly inverse correlation with the patient's age (Fig. 1, Spearman test; R = −0·769; P < 0·0001). Table 1 shows baseline characteristics of the patients. We found 11 (52·4%) patients with AIDS from the total 21 patients included. As expected when grouping patients with AIDS or without AIDS at baseline, baseline HIV RNA levels were significantly higher and both CD4+ and CD8+ cell counts were lower in the AIDS group (data not shown). In spite of similarity in age between both groups of patients, thymic volume was smaller in the AIDS group, although differences did not reach statistical significance (Mann–Whitney U-test, median 1·77 versus 3·73 cm3; P = 0·072).
Fig. 1.
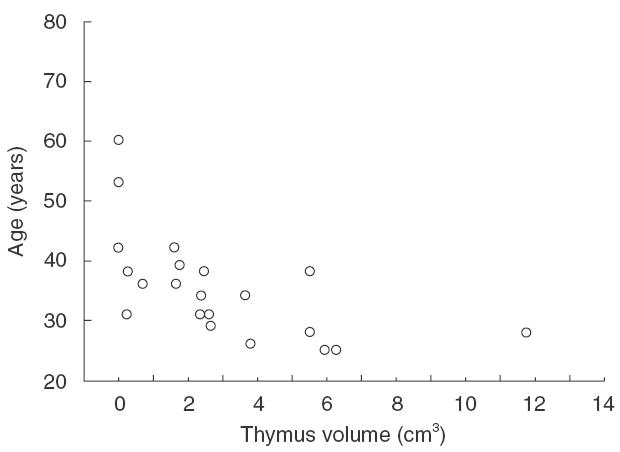
Baseline correlation of the thymic volume measured by CT and the age of the patients. r = −0.769, P < 0.0001, Spearman test.
Patient evolution during the follow up
Mean plasma viraemia of all patients decreased at least 3 log after therapy, being undetectable in half of the patients after 24 weeks of HAART. A significant increase in thymic volume was observed during the follow up (Friedman test; P = 0·003). Thus, as early as week 12, a 2-fold mean increase was observed (4·8 versus 2·91 cm3 at baseline, Wilcoxon matched pair signed rank test, P = 0·003) that was maintained until week 24 (P = 0·006). From the 21 patients evaluated, 10 (47·6%) patients increased their thymic volume more than 1 cm3 at week 12 and 11 (52·3%) ones at week 24. Increases in thymic volume were remarkable in some cases as illustrated in Fig. 2. The CT scan slices shown in the figure display two cases, a 38-year-old-patient and an older (60 years old) one, before and after 24 weeks under HAART. The arrowhead shape is visualized only in the younger patient (Fig. 2a,b). Almost no thymic tissue is shown at week 0 of treatment in the CT scan of the older patient (Fig. 2c), and an increase in thymic volume with a profound fat infiltration is found at week 24 (Fig. 2d). Figure 2e shows how a careful delineation of thymic tissue was performed in order to avoid all fat tissue. Thus, the wide density range used avoids errors due to hardening beam artifacts but may include some fat tissue. Delimiting the margin of the gland by the cursor in each thymus section, eliminate all fat tissue avoiding even fat infiltration within the parenchyma observed by computed tomography.
Fig. 2.
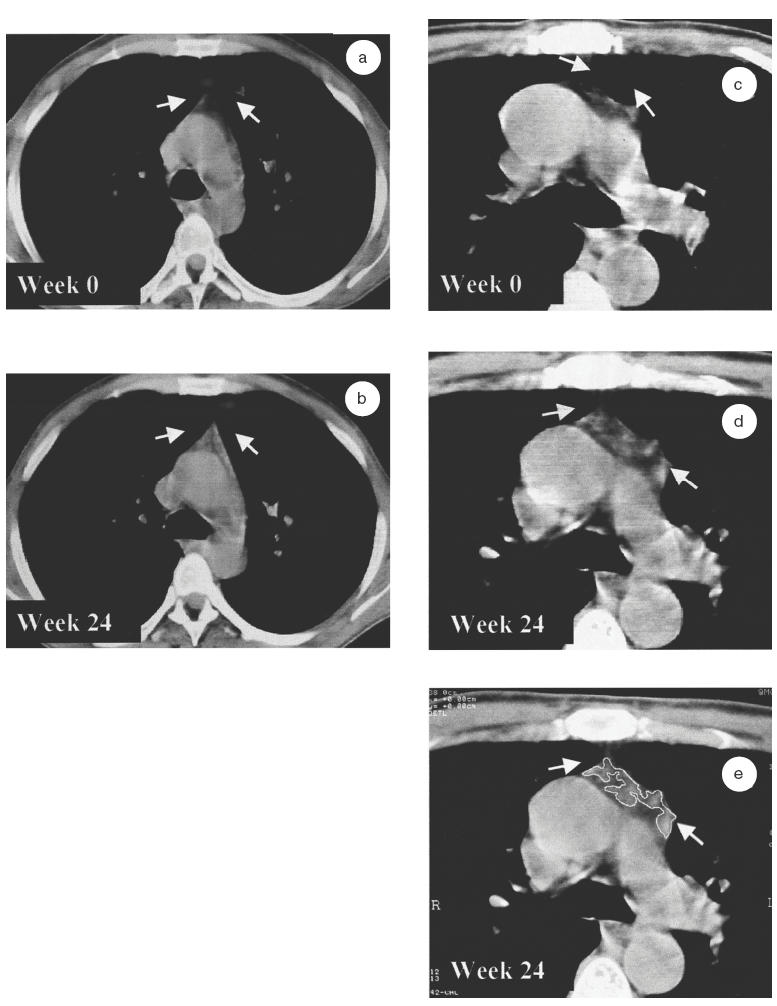
Visualization of a thymus slice of two adult HIV-1 infected patients by computed tomography (CT). One younger patient (aged 38) with a high score before and during the follow up (a, b), and an older one (aged 60) with a low score during the complete follow up (c, d). CT scans of theses two patients are represented at baseline (a, c) and at week 24 of HAART (b, d). A global thoracic area is shown for the young patient and an enhanced and amplified CT scan at the level of pulmonary artery is shown for the 60-year-old-man. The thymus is indicated by arrows at the top centre of each frame. (e) shows how to outline the thymus corresponding area (the functional thymus) using the cursor. Fat infiltration within thymic fossae is obviated. Afterwards the computer scans the highlighted area. CT slices corresponded to the aortic arch area in both patients at each time point.
A CD4+ cell counts increase was observed during the follow up (Friedman test; P = 0·002). Thus, median CD4+ cell counts increased from 206 at baseline to 294 at week 24 (Wilcoxon matched pair signed rank test, week 12 versus baseline, P = 0·002; week 24 versus baseline, P = 0·006). No changes were found for CD8+ cell numbers after 24 weeks of treatment (data not shown). One patient died during the follow up (week 24) due to a primary central nervous system B-lymphoma.
Relationship between changes in thymic volume and the T-cell repopulation under HAART
A significant direct correlation was found between changes in the thymus volume and changes in total CD4+ cell counts after 24 weeks of HAART (Fig. 3a, Spearman test; R = 0·571, P = 0·007). In the same way, a direct significant correlation between thymus changes and the CD4+ naïve cells subset (Fig. 3b, R = 0·599, P = 0·004) but not between the thymus and the memory one (R = 0·356, P = 0·114) was found. No modifications in thymus volume were associated with CD8 cell counts at week 12 or at week 24 (data not shown).
Fig. 3.
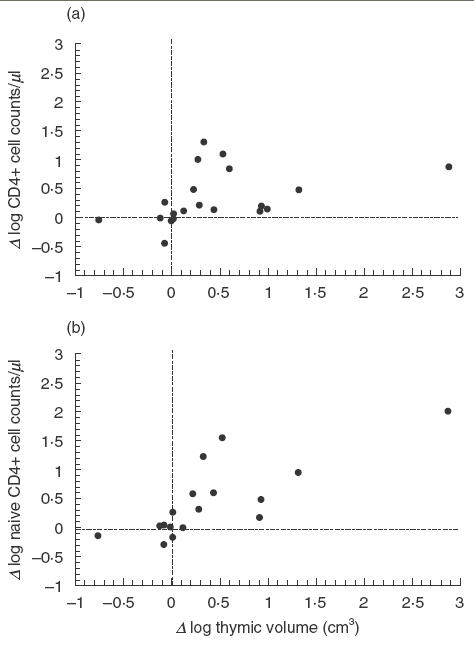
Correlation of basal increase of thymus volume versus baseline and the increase in CD4+ cell counts at week 24. Data has been expressed as log10 for calculations. Spearman test.
In order to better assess the association between thymus volume increase and T-cell repopulation after HAART, patients were classified according to their CD4+ cell counts increase at the end of the follow up. Group A were patients with increases equal or higher than 100 CD4+ cell counts and group B included individuals that did not reach this value at week 24. These two groups were not significantly different in age (P = 0·19), CD4+ cell numbers (P = 0·46), CD8+ cell numbers (P = 0·28), plasma viraemia levels (P = 0·91) or thymic volume (P = 0·15) at baseline. A significant increase in thymic volume during the follow up was observed in group A but not in group B (Fig. 4, Friedman test; P = 0·002). Increases in group A were found as early as week 12 (Wilcoxon matched pair signed rank test, P = 0·005) and were maintained at week 24 (P = 0·009). The patient who died during the follow up did not increase CD4 cell counts at week 24 and was therefore included in group B.
Fig. 4.
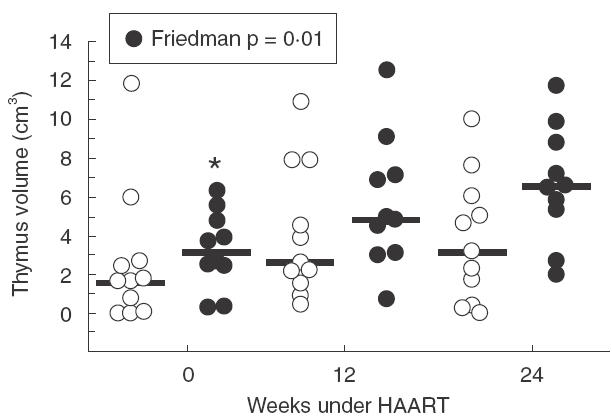
Evolution of thymus volume of the patients. Patients were classified for either having experienced an increase ≥100 CD4+ cells/µl at week 24 (d) or <100 CD4+ cells/µl (s). Circles represent thymus volume of each patient, and dark line the median of the patients at each time point. Friedman test; *P = 0·002; Wilcoxon matched pair signed rank test, P = 0·005 versus week 12 and P = 0·009 versus week 24.
Thymus volume and baseline clinical stage
Grouping patients with AIDS or without AIDS at baseline we did not detect statistical differences between thymic volumes in both groups of patients. However, we observed that only patients included in the AIDS group significantly increased their thymic volume during the follow up (Table 2, Friedman test; P = 0·002). Changes in CD4+ cell counts were also only significant in this same group (Table 2, Friedman test; P = 0·002).
Table 2.
Evolution of thymus volume and CD4+ cell numbers from patients with or without AIDS during the follow up
| Non-AIDS n = 10 | AIDS n = 11 | |
|---|---|---|
| Thymus volume cm3 median (range) | ||
| Week 0 | 3·73 (0·23–11·75) | 1·77 (0–5·5) * |
| Week 12 | 4·47 (0·65–10·85) | 3·84 (0·42–12·5) |
| Week 24 | 4·96 (0·29–9·93) | 6·02 (0–11·65) |
| CD4+ cell count/µl median (range) | ||
| Week 0 | 548 (206–804) | 24 (8–372) † |
| Week 12 | 674 (255–950) | 155 (34–541) |
| Week 24 | 604 (287–1027) | 112 (39–505) |
Friedman test P = 0·002; Wilcoxon matched pair signed rank test, week 12 versus week 0, P = 0·008; week 24 versus week 0, P = 0·005.
Friedman test P = 0·002; Wilcoxon matched pair signed rank test, week 12 versus week 0, P = 0·003; week 24 versus week 0, P = 0·008.
DISCUSION
Data from this longitudinal study show the first evidence of an early change in thymic volume of adult HIV-1 infected patients under HAART. Increases in thymic volume after 24 weeks of follow up were not only related to the rise of total CD4+ cell counts, but also with the CD4+ naïve subset, suggesting a functional role of thymic volume increase.
Thymus size evaluation proposed in this work is a precise method improved from others described in literature [12]. In an attempt to avoid radiological artifacts, a wide range of radiological density was supplied to the computer and the thymus structure in each slice was then defined drawing an accurate profile with the cursor. This method also avoids including fat infiltration within the parenchyma. Thus, a careful delineation of the thymic tissue was performed as shown in Fig. 2e. We may exclude a thymic volume increase caused by mediastinal fat due to the lipodystrophy syndrome usually induced by protease inhibitors. Besides, no patient showed clinical lipodystrophy. In fact, clinical lipodystrophy usually appear later than six months of treatment under a protease inhibitor regimen. As expected, a significant relation was found between basal thymus volume and patient's age. Considering the described loss of thymus function during adult life, this correlation supports the technique's reliability for measuring the gland.
A significant increase of the thymus volume was observed as early as week 12 and continued rising until week 24. As far as we know, thymus volume increase after treatment has only been described in HIV-1 infected children [7] but not in adult patients. We might expect an increase in thymus volume in very young patients. In the present study, this increase was also quite evident among older patients. Some cases were especially remarkable, such as a 60-year-old patient who showed a clear increase of thymus size during treatment (Fig. 2c–e). This increase was obvious in spite of the fat tissue infiltration. The relationship between thymic function and a high thymic mass is still not completely accepted by all authors. Some authors have suggested that high thymic size in untreated HIV-infected patients may be the reflection of tissue infiltration with mature cells or fat [3]. The significant relation with total and naïve CD4+ cell counts after 24 weeks of treatment suggested a functionality of thymus increase after therapy. This relation after HAART has only been described for children [7]. Supporting these data, we also observed that grouping patients by their CD4+ cell repopulation after treatment, only patients with an increase equal to or higher than 100 CD4+ cell/µl significantly increased their thymic volume.
One datum that caught our attention was the different mean volume between patients with or without AIDS at baseline. Higher thymic volume in patients without AIDS (with high CD4+ cell numbers) might suggest a residual thymic function that may maintain a sustained T-cells generation before treatment. These data are even more interesting, considering that no age differences were found at baseline between both groups of patients. Surprisingly, only the AIDS group significantly increases both the thymic volume and CD4+ cell counts after 24 weeks of HAART. One possible explanation for this finding might be that in patients with an elevated immunosuppression level the thymic dependent pathway may be urgently required for CD4+ cells regeneration. On the other hand, we might also speculate that the more marked thymic increase in subjects with AIDS is due to a recoverable bone marrow-thymus axis in spite of a possible exhausted peripheral T-cell regenerative capacity. Important to underline is that it may be possible to restore the thymus function after HAART even in highly immunosuppressed patients with scant thymic tissue before treatment. Concerning the other group without AIDS before treatment, longer periods under an effective treatment should be analysed to assess a possible late T-cell repopulation.
In spite of the described diminished functionality of the thymus during adulthood, results from this study support the theory that the thymus may play a role on the reconstitution of peripheral T-cells in adult HIV-1 infected patients after an effective treatment. In our opinion, thymic volume measured by CT may be a useful tool to evaluate the role of the thymus in T-cell repopulation after HAART. Thymus measurements seem to reflect a real function of the gland, shown by the relation with the CD4+ cell counts. Further studies should be performed to better assess the thymic role in T-cell reconstitution after HAART. In this way, it would be very interesting to relate thymic volume and the molecular marker of thymus function, TREC+ cell numbers, after HAART. This issue is currently under research.
Acknowledgments
This work was supported by a research grant from ‘Fondo de Investigaciones Sanitarias’ (FIS 00/0521), Fondo para la Investigación y Prevención del SIDA en España (FIPSE) integrated by Ministerio de Sanidad y Consumo, Abbott Laboratories, Boehringer Ingelgeim, Bristol Myers Squibb, GlaxoSmithKline, Merck Sharp and Dohme and Roche (Exp: 2132/00) and by a kindly support of Fundación Wellcome España.
REFERENCES
- 1.Bucy RP, Hockett RD, Derdeyn CA, et al. Initial increase in blood CD4+ lymphocytes after HIV antiretroviral therapy reflects redistribution from lymphoid tissues. J Clin Invest. 1999;103:1391–8. doi: 10.1172/JCI5863. [DOI] [PMC free article] [PubMed] [Google Scholar]
- 2.Walker RE, Carter C, Muul L, et al. Peripheral expansion of pre-existing mature T cells is an important means of CD4+ T-cell regeneration HIV-infected adults. Nature Med. 1998;4:852–6. doi: 10.1038/nm0798-852. [DOI] [PubMed] [Google Scholar]
- 3.Hayne BF, Hale LP, Weinhold KJ, et al. Analysis of the adult thymus in reconstitution of T lymphocytes in HIV-1 infection. J Clin Invest. 1999;103:453–60. doi: 10.1172/JCI5201. [DOI] [PMC free article] [PubMed] [Google Scholar]
- 4.Hazenberg MD, Clark DR, Miedema F. Tilted balance of T cell renewal in HIV-1 infection. AIDS Rev. 1999;1:67–73. [Google Scholar]
- 5.McCune. Thymic function in HIV-1 disease. Immunology. 1997;9:397–404. doi: 10.1006/smim.1997.0098. [DOI] [PubMed] [Google Scholar]
- 6.Franco JM, León-Leal JA, Leal M, et al. CD4+ and CD8+T lymphocyte regeneration after anti-retroviral therapy in HIV-infected children and adult patients. Clin Exp Immunol. 2000;119:493–8. doi: 10.1046/j.1365-2249.2000.01152.x. [DOI] [PMC free article] [PubMed] [Google Scholar]
- 7.Vigano A, Vella S, Sarasella M, et al. Early immune reconstitution after potent antiretroviral therapy in HIV infected children correlates with the increase in thymus. AIDS. 2000;14:251–61. doi: 10.1097/00002030-200002180-00007. [DOI] [PubMed] [Google Scholar]
- 8.Douek DR, McFarland P, Keiser E, et al. Changes in thymic function with age and during the treatment of HIV infection. Nature. 1998;396:690–5. doi: 10.1038/25374. [DOI] [PubMed] [Google Scholar]
- 9.Zhang L, Lewin SR, Markiwitz M, et al. Measuring recent thymic emigrants in blood of normal and HIV-1-infected individuals before and after effective therapy. J Exp Med. 1999;190:725–32. doi: 10.1084/jem.190.5.725. [DOI] [PMC free article] [PubMed] [Google Scholar]
- 10.McCune JM, Loftus R, Schmidt DK, et al. High Prevalence of thymic tissue in adults with human immunodeficiency virus-1 infection. J Clin Invest. 1998;11:2301–8. doi: 10.1172/JCI2834. [DOI] [PMC free article] [PubMed] [Google Scholar]
- 11.Smith KY, Valdez H, Landay A, et al. Thymic size and lymphocyte restoration in patients with human immunodeficiency virus infection after 48 weeks of zidovudine, lamivudine, and ritonavir therapy. J Infect Dis. 2000;181:141–7. doi: 10.1086/315169. [DOI] [PubMed] [Google Scholar]
- 12.Choyke PL, Zeman RK, Gootenberg JE, et al. Thymic atrophy and regrowth in response to chemotherapy: CT evaluation. AJR. 1987;149:269–72. doi: 10.2214/ajr.149.2.269. [DOI] [PubMed] [Google Scholar]