Qiu M.R., Campbell T.J. & Breit S.N. A potassium ion channel is involved in cytokine production by activated human macrophages. Clin Exp Immunol 2002; 130:67–74.
In Figs 1–5, the diagonal hatching in the columns was erroneously omitted during printing and these appeared as open columns. The corrected figures are shown below.
Fig. 1.
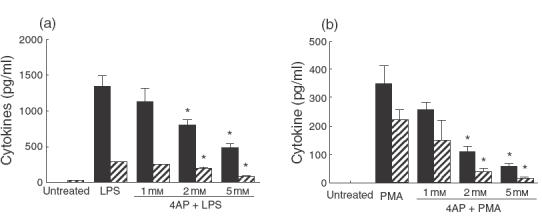
Effects of 4AP on TNF-α and IL-8 production by activated human MACs. Cells were incubated with (a) LPS (1 µg/ml) or (b) PMA (40 nm) in the presence or absence of 4AP (1, 2 and 5 mm) for 24 h. Supernatants were collected and assayed for TNF-α and IL-8 concentration by ELISA and the results plotted as the mean ± 1 standard deviation of triplicate data points. The results of one representative experiment are illustrated. The bar key, IL-8 (×100) indicates that the real concentrations of IL-8 are 100-fold of the bar indicated in the graph. Statistically significant differences (P-value < 0·01) are highlighted with an asterisk. ▪, TNF-α  , IL-8 (×100)
Fig. 5.
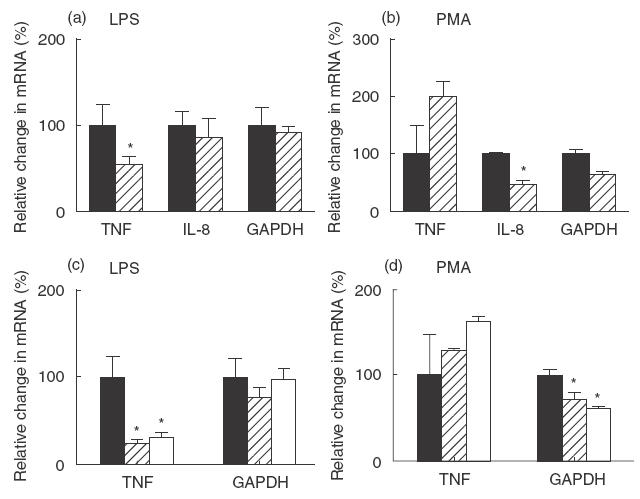
Effects of 4AP, K+ and sucrose on the expression of cytokines by MACs. MACs were incubated with LPS (a,c) or PMA (b,d) in the presence or absence of 4AP (5 mm)(a,b), K+ (90 mm) or sucrose (90 mm)(c,d) for 3 h. Then total RNA was extracted and mRNA of TNF-α, IL-8 and GAPDH was measured by real-time PCR. The data represent one of three individual experiments. Each data point represents the mean value of triplicate samples ± their standard deviation. Statistically significant differences (P-value < 0·05) are highlighted with an asterisk. (a,b): ▪, stimulator only;  , 4AP/stimulator. (c,d): ▪, stimulator only;
  ,K+/stimulator; □, sucrose/stimulator.
Fig. 2.
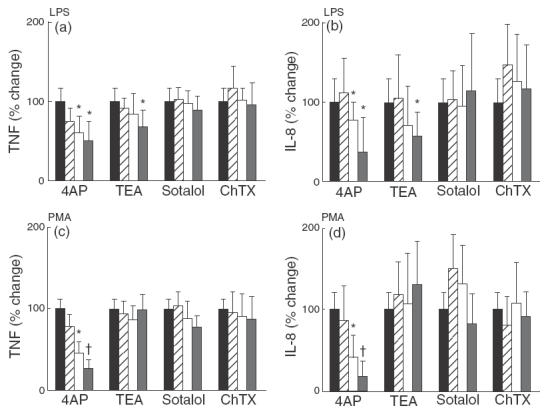
Effect of K+ channel blockers on TNF-α and IL-8 production by activated human MACs. Cells were cultured with LPS (1 µg/ml) (a) and (b)or PMA (40 nm)(c) and (d) in the presence or absence of 4AP, TEA, Sotalol and ChTX. The low, medium and high concentrations in the graph represent 1, 2 and 5 mm of 4AP; 1, 10 and 20 mm of TEA; 10, 50 and 100 µm of Sotalol; 10, 50 and 100 nm of ChTX. After 24 h, the conditioned medium from triplicate data points was collected and assayed for TNF-α (a) and (c) and IL-8 (b) and (d) concentration by ELISA. The mean data was then normalized so that the cytokine concentration in activated, but otherwise untreated samples was 100%. The results in these panels represent the mean value of 12–18 individual samples from four to six different experiments ± standard deviation. Statistically significance differences are marked highlighted with an asterisk (P < 0·05) and dagger (P < 0·01). (a,b): ▪, LPS only;  , low; □, medium;
  , high. (c,d): ▪, PMA only;
  , low; □, medium;
  , high.
Fig. 3.
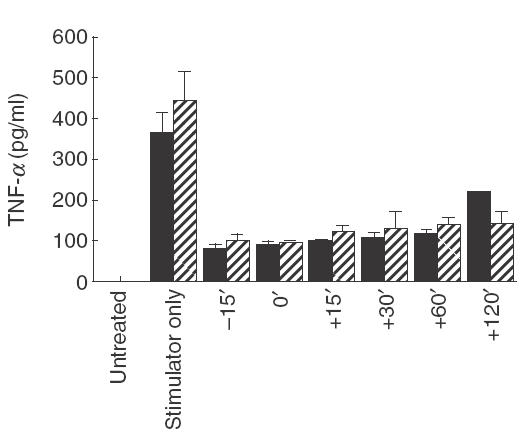
Time-course effect of 4AP on TNF-α production by human MACs. 4AP, at a final concentration of 5 mm, was added to the culture medium at the different time points (15 min before, same time or 15 min, 30 min, 60 min or 120 min after LPS or PMA activation). MACs were then cultured for the remaining time period to 24 h. The media were harvested for TNF-α measurement by ELISA. These data illustrate the results from one of three individual experiments and represent the mean value of triplicate samples ± 1 standard deviation. The bar key, LPS × 10 shows that the real concentrations of TNF-α by LPS-activated MACs are 10-fold of the bar indicated in the graph. ▪, LPS × 10 (1 µg/ml);  , PMA (40 nm).
Fig. 4.
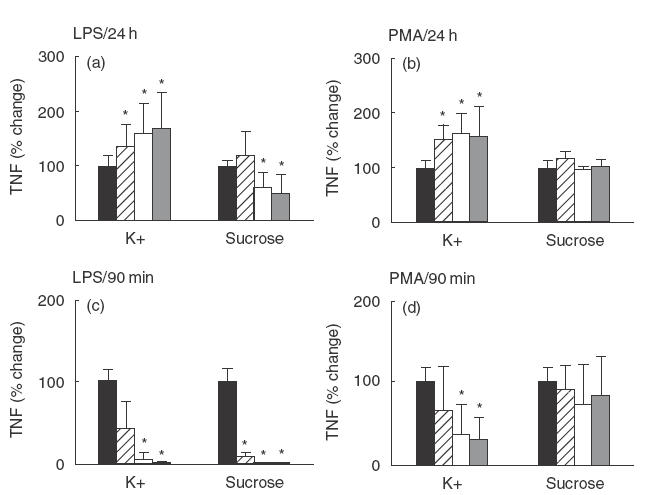
Effects of K+ and sucrose on TNF-α production by human MACs. MACs were cultured under different conditions:(a) LPS (1 µg/ml) ± K+ or sucrose for 24 h; (b) PMA (40 nm) ± K+ or sucrose for 24 h; (c) LPS (10 µg/ml) ± K+ or sucrose for 90 min only. At 90 min the culture medium was changed for normal culture media for the remaining time period up to 24 h; (d) PMA (40 nm) ± K+ or sucrose for 90 min only. At 90 min the culture medium was changed for normal culture media for the remaining period up to 24 h. All the conditioned media were harvested for TNF-α measurement at 24 h after stimulation. The results represent the mean data for the experimental condition divided by the corresponding control, expressed as a percentage. The results in these panels represent the mean value of 12 individual samples from four individual experiments ± standard deviation. Statistically significant differences (P-value < 0·01) are highlighted with an asterisk. (a,c): ▪, LPS only;  , 20 mM; □, 60 mM;
  , 90 mM. (b,d): ▪, PMA only;
  , 20 mM; □, 60 mM;
  , 90 mM.


