Abstract
In patients with systemic sclerosis (SSc), there are conflicting findings regarding which is predominant between type 1 and type 2 immune responses. To determine the balance between type 1 and type 2 T lymphocytes in peripheral blood from SSc patients, we investigated the expression of intracellular cytokines, such as interferon-γ (IFN-γ), interleukin-2 (IL-2), IL-4, and IL-13, and chemokine receptors such as CXCR3 and CCR4 by flow cytometry. The frequency of IFN-γ-producing cells among CD8+ cells was significantly increased in patients with diffuse cutaneous SSc (n = 11, P < 0·0001) and limited cutaneous SSc (lSSc; n = 16, P < 0·0001) compared with normal controls (n = 17) while there was no significant difference in the frequency of IL-4- or IL-13-producing cells. In contrast, the frequency of IFN-γ- or IL-4-producing cells among CD4+ cells was similar between the three groups. Similar results were obtained when absolute numbers were assessed. The frequency of IFN-γ-producing cells among CD8+ cells inversely correlated with percentage DLco in SSc patients (r = − 0·650, P < 0·005). CXCR3+ CD8+ cells selectively produced IFN-γ, and the frequency of CXCR3+ CD45RO+ cells among CD8+ cells was higher in lSSc patients (n = 14, P < 0·01) than in normal controls (n = 22). In contrast, there was no significant difference in the frequencies of CXCR3- or CCR4-expressing CD45RO+ cells among CD4+ cells. These results demonstrate the predominance of type 1 cytokine-producing cells (Tc1 cells) in peripheral blood CD8+ T cells from SSc patients, but no definite Th1/Th2 imbalance in CD4+ T cells. Tc1 cells may be associated with pulmonary vascular damage in SSc.
Keywords: type 1 immune response, type 2 immune response, Tc1 cells, CXCR3, pulmonary vascular damage
Introduction
Systemic sclerosis (SSc) is a connective tissue disease characterized by fibrosis and vascular changes in the skin and other visceral organs. Although the pathogenesis of SSc remains unclear, T lymphocytes are considered to play an important role. Dermal mononuclear cell infiltrates in SSc have been shown to be both CD4+ and CD8+ activated T cells [1–5]. Increased numbers and percentages of activated T cells have also been found in the lung interstitium and bronchoalveolar fluids (BALF) from SSc patients with active lung disease [6–8]. Furthermore, there is evidence of circulating T cell activation in SSc [9,10]. The activated T cells may promote the fibrosis and endothelial damage probably through the production of soluble mediators or cytotoxic effects in patients with SSc.
CD4+ T cells can be divided into functionally polarized subsets based on the cytokines they produce. Th1 cells produce mainly type 1 cytokines, including interferon-γ (IFN-γ) and interleukin-2 (IL-2), and promote cell-mediated immune responses, whereas Th2 cells secrete type 2 cytokines, including IL-4, IL-5, IL-6, IL-10, and IL-13, and enhance humoral immune responses [11–13]. Moreover, similar cytokine secretion patterns have been observed for CD8+ cytotoxic T cells, designated Tc1 and Tc2 cells, although their distinct functions are not clarified [11,12]. Imbalance between type 1 and type 2 immune responses plays a pathogenic role in several autoimmune diseases and allergic diseases of animals and humans [13–15]. Type 1 immune responses predominate in organ-specific autoimmune disorders such as multiple sclerosis and Crohn's disease [13,14]. In contrast, type 2 immune responses predominate in allergic disorders such as atopic dermatitis and asthma [13,15].
In patients with SSc, it has been reported that serum levels and production levels by stimulated peripheral blood mononuclear cells (PBMC) of type 2 cytokines, such as IL-4, IL-6, and IL-13, are increased, but those of type 1 cytokines such as IFN-γ are decreased [16–19]. In addition, circulating levels of soluble CD30, which may reflect Th2 cell activation, are increased in SSc patients [20,21]. Furthermore, Mavalia et al. [21] revealed type 2 cytokine profiles of production by cultured CD4+ T cells in the skin from SSc patients. They also showed elevated expression of IL-4 mRNA and CD30 by skin infiltrating mononuclear cells from SSc patients. These results suggest that SSc may be a type 2 response predominant disease. However, findings suggesting activation of type 1 response in SSc have also been reported. Serum tumour necrosis factor-α levels were increased in SSc patients and correlated with the presence of pulmonary fibrosis [22]. In addition, serum levels and spontaneous production levels by PBMC of IL-12, a potent inducer of Th1 cells, were elevated in SSc patients [23]. Moreover, some observations imply mixed activation of type 1 and type 2 phenotypes in SSc. Giacomelli et al. [24] found type 1 polarization of γ/δ T cells in addition to type 2 predominance of α/β T cells, using intracellular cytokine analysis without differentiating CD4+ and CD8+ subsets. Furthermore, cells expressing type 1 cytokine mRNA (IFN-γ and IL-2) in addition to those expressing type 2 cytokine mRNA (IL-4 and IL-5) were increased in the lung interstitium from SSc patients with fibrosing alveolitis, while the ratios of type 1 to type 2 cytokines were similar to controls [25]. Thus, Th1/Th2 and Tc1/Tc2 profiles in SSc patients remains unknown.
Recently, flow cytometric analysis of intracellular cytokines has enabled the detection of cytokine-producing cells at the single cell level [26]. Furthermore, chemokine receptors serve as good cell surface markers for type 1 versus type 2 T cells in addition to the targets for selective modulation of T cell dependent immunity since recent studies have reported that Th1/Tc1 cells predominantly express CXCR3 and CCR5 while Th2/Tc2 cells preferentially express CCR3, CCR4, and CCR8 [27–30]. In the present study, to determine the balance between type 1 and type 2 T lymphocytes in SSc patients, we investigated the expression of intracellular cytokines (IL-2, IL-4, IL-13, and IFN-γ) and chemokine receptors (CXCR3 and CCR4) in peripheral blood T cells from SSc patients.
Materials and methods
Patients and control subjects
Peripheral blood samples were obtained from 29 patients with SSc (3 males and 26 females, aged 31–81 years, median age 56 years; Table 1). All patients fulfilled the criteria proposed by the American College of Rheumatology [31]. Twelve patients were categorized as diffuse cutaneous SSc (dSSc) and 17 as limited cutaneous SSc (lSSc), according to the classification system proposed by LeRoy et al. [32]. Median disease duration was 3·8 (range 0·2–5·0) years. Of 29 patients with SSc, 27 patients (3 males, 24 females; aged 38–81 years, median age 58 years; 11 dSSc and 16 lSSc) were analysed for intracellular cytokine evaluation while 26 patients with SSc (one male, 25 females; aged 31–81 years, median age 54 years; 12 dSSc and 14 lSSc) were assessed for the chemokine receptor investigation. Regarding the chemokine receptor investigation, CXCR3 expression was examined in all 26 patients with SSc, while CCR4 expression was examined in 20 patients with SSc (8 dSSc, 12 lSSc patients). None of the patients had received oral steroid, immunosuppressive therapy, or d-penicillamine. Seventeen age- and sex-matched healthy individuals (2 males, 15 females; aged 35–78 years, median age 56 years) were used as normal controls for intracellular cytokine evaluation while 22 age- and sex-matched healthy persons (1 male, 21 females; aged 35–78 years, median age 54 years) were used for the chemokine receptor investigation: 22 subjects for CXCR3 expression and 14 for CCR4 expression.
Table 1.
Clinical or laboratory features of SSc patients
| dSSc (n = 12) | lSSc (n = 17) | |
|---|---|---|
| Age; years, median (range) | 54 (31–75) | 57 (45–81) |
| Sex (female : male) | 11 : 1 | 15 : 2 |
| Duration; years, median (range) | 2·7 (0·8–5·0) | 4·3 (0·2–5·0) |
| Organ involvement | ||
| Lung | ||
| Pulmonary fibrosis | 9/12 (75%) | 4/17 (24%) |
| %VC, median (range) | 79·7 (42·5–127·0) | 110·5 (90·4–132·0) |
| %DLco, median (range) | 60·6 (26·5–83·0) | 69·0 (41·3–91·0) |
| Oesophagus | 8/12 (67%) | 11/17 (65%) |
| Heart | 4/12 (33%) | 2/17 (12%) |
| Kidney | 4/12 (33%) | 3/17 (18%) |
| Joint | 5/12 (42%) | 4/17 (24%) |
| Muscle | 4/12 (33%) | 1/17 (6%) |
| Laboratory findings | ||
| Anti-topoisomerase I Ab* | 7/12 (58%) | 0/17 (0%) |
| Anti-centromere Ab | 0/12 (0%) | 15/17 (88%) |
Ab, antibody.
All patients had detailed clinical assessment for laboratory findings and involvement of the internal organs. Organ system involvement was defined as described previously [33,34]: lung – bibasilar fibrosis on high-resolution computed tomography and chest radiography; oesophagus – hypomotility shown by barium radiography; joint – inflammatory polyarthralgias or arthritis; heart – pericarditis, congestive heart failure, or arrhythmias requiring treatment; pulmonary hypertension – elevated systolic pulmonary artery pressure estimated by colour-flow Doppler ultrasonography; kidney – malignant hypertension and rapidly progressive renal failure without any other explanation; and muscle – proximal muscle weakness and elevated serum creatine kinase. The pulmonary function test, including vital capacity and diffusion capacity for carbon monoxide (DLco), was also performed. The protocol was approved by the Kanazawa University School of Medical Science and Kanazawa University Hospital, and informed consent was obtained from all patients.
Intracellular cytokine detection
Flow cytometric determination of cytokines in the cytoplasm of peripheral CD4+ and CD8+ T cells was performed as described previously [35]. Heparinized whole blood was stimulated with a combination of 25 ng/ml of phorbol 12-myristate 13-acetate (PMA; Sigma-Aldrich, St. Louis, MO, USA) and 1 µg/ml of ionomycin (Sigma-Aldrich) in the presence of 10 µg/ml of brefeldin A (Sigma-Aldrich) and cultured for 4 h at 37°C. Brefeldin A was used to increase the sensitivity of cytokine detection because it inhibits intracellular transport of proteins by interfering with the function of the Golgi apparatus [35]. Activated cultures were stained with peridinin chlorophyll (PerCP)-conjugated anti-CD3 (BD PharMingen, San Diego, CA, USA) and fluorescein isothiocyanate (FITC)-conjugated anti-CD8 monoclonal antibodies (MoAbs; Coulter Corp, Miami, FL, USA) for 15 min at room temperature, as described previously [36]. For the detection of intracellular cytokine expression in CD8+ CXCR3+ or CCR4+ cells, activated cultures were incubated with PerCP-conjugated anti-CD8 and FITC-conjugated anti-CXCR3 (R & D Systems Inc., Minneapolis, MN, USA) or purified anti-CCR4 (mouse IgG1) MoAbs [37]. The anti-CCR4 MoAb was kindly provided by Dr N. Hanai (Kyowa Hakko, Tokyo, Japan). For anti-CCR4 MoAb, phycoerythrin (PE)-conjugated goat F(ab′)2 antimouse IgG Ab (Southern Biotechnology Associates, Inc., Birmingham, AL, USA) was used as a secondary Ab. Blood erythrocytes were lysed after staining using the Coulter Whole Blood Immuno-Lyse kit (Coulter Corp). Then, the samples were incubated with FACS permeabilizing solution (BD PharMingen) for 10 min at room temperature. The cells were incubated with PE-conjugated anti-IL-2, anti-IL-4, anti-IL-13, or anti-IFN-γ MoAbs (BD PharMingen) for 30 min at room temperature. The samples were washed and analysed using a FACScan flow cytometer (BD PharMingen). Positive and negative populations of cells were determined using unreactive isotype-matched MoAbs (BD PharMingen) as controls for background staining.
Analysis of chemokine receptor expression
Heparinized blood samples were collected and placed on ice. Three-colour analysis was performed using a combination of PerCP-conjugated anti-CD4 or anti-CD8 (BD PharMingen), FITC-conjugated anti-CD45RO (Coulter Corp.), and PE-conjugated anti-CXCR3 (BD PharMingen) or anti-CCR4 MoAbs. The blood samples were stained at 4°C for 20 min and then blood erythrocytes were lysed using the Coulter Whole Blood Immuno-Lyse kit (Coulter Corp.). Cells were analysed using a FACScan flow cytometer (BD PharMingen).
Statistical analysis
Mann–Whitney U-tests were used to compare variables between two groups. Bonferroni's test was used for multiple comparisons. Spearman's rank correlation coefficient was used to examine the relationship between 2 continuous variables. A P-value < 0·05 was considered statistically significant.
Results
Intracellular cytokine analysis in T cells
The frequencies of cytokine-producing CD4+ or CD8+ T cells were assessed after stimulation with PMA and ionomycin at the single cell level, using intracellular cytokine staining and flow cytometry with three-colour analysis (Figs 1–3). Since CD4 expression is down-regulated after stimulation with PMA [38], the CD4+ population was analysed by gating on the CD3+ CD8− population: 10000 CD3+ cells were collected per sample. There were significantly higher frequencies of IFN-γ-producing CD8+ T cells in SSc patients (median 83%, range 41–98%) than in normal controls (46%, 26–70%, P < 0·0001; Fig. 2). Concerning subsets of SSc, the frequencies of IFN-γ-producing CD8+ T cells were significantly higher in dSSc patients (P < 0·0001) and lSSc patients (P < 0·0001) than in normal controls. The frequencies of IFN-γ-producing CD8+ T cells were similar for dSSc patients and lSSc patients. There was no significant difference in the frequencies of IL-2-producing CD8+ T cells between SSc patients and normal controls. However, the frequencies of IL-2-producing CD8+ T cells in lSSc patients was significantly increased compared with dSSc patients (P < 0·05) and normal controls (P < 0·05). In contrast, no significant difference was found in the proportion of IL-4- or IL-13-producing cells among CD8+ T cells between the three groups. Absolute numbers of cytokine-producing CD4+ or CD8+ T cells were also analysed. There were significantly more IFN-γ-producing CD8+ T cells in dSSc patients (P < 0·05) and lSSc patients (P < 0·05) than in normal controls (Table 2). Absolute numbers of IL-2-, IL-4-, and IL-13-producing CD8+ T cells were similar between the three groups.
Fig. 1.
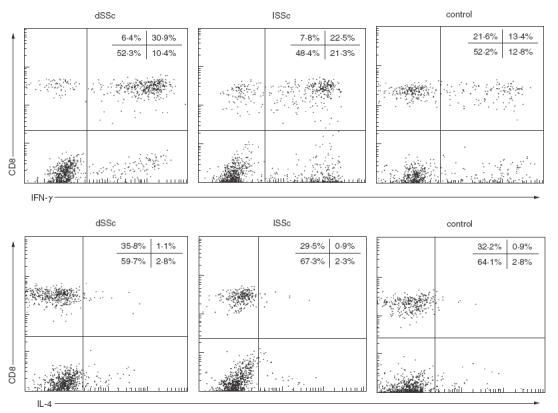
Representative expression of IFN-γ and IL-4 in the cytoplasm of CD8+ and CD8− (CD4+) T cells from a patient with diffuse cutaneous systemic sclerosis (dSSc), a patient with limited cutaneous SSc (lSSc), and a normal control (control). Whole blood samples were activated with phorbol myristate acetate and ionomycin in the presence of brefeldin A. Intracellular cytokine production was determined by flow cytometry with three-colour analysis. Plots represent live cells gated for expression of CD3. Quadrants were set according to the staining of control MoAbs.
Fig. 3.
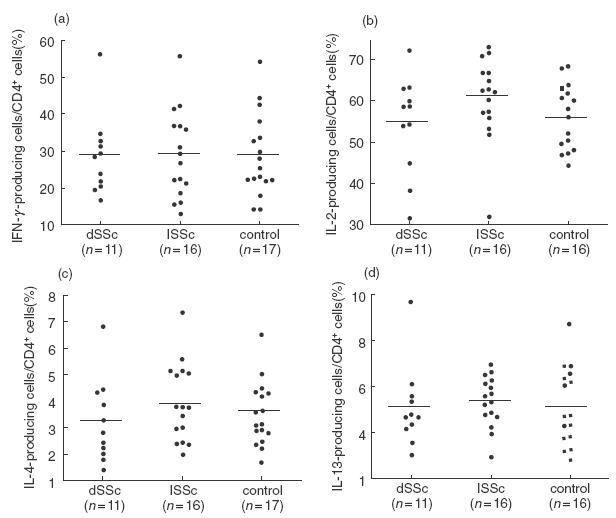
Frequencies of CD4+ T cells producing (a) IFN-γ, (b) IL-2, (c) IL-4 and (d) IL-13 in peripheral blood CD4+ T cells from dSSc patients, lSSc patients, and normal controls (control). Intracellular expression of cytokines was determined by flow cytometry, as described in Fig. 1. Bars indicate the medians.
Fig. 2.
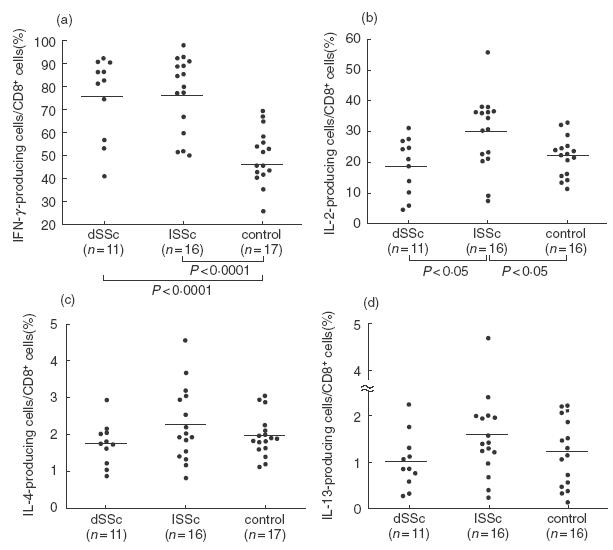
Frequencies of CD8+ T cells producing (a) IFN-γ, (b) IL-2, (c) IL-4 and (d) IL-13 in peripheral blood CD8+ T cells from dSSc patients, lSSc patients, and normal controls (control). Intracellular expression of cytokines was determined by flow cytometry, as described in Fig. 1. Bars indicate the medians.
Table 2.
Absolute numbers of cytokine-producing CD8+ or CD4+ T cells
| T cells (per mm3) | |||
|---|---|---|---|
| Cytokine | dSSc | lSSc | Control |
| CD8+ T cells | |||
| IFN-γ | 259 (136–512)* | 210 (69–394)* | 184 (86–318) |
| IL-2 | 62 (15–152) | 137 (27–166) | 87 (42–145) |
| IL-4 | 7 (3–12) | 7 (3–22) | 8 (3–17) |
| IL-13 | 4 (1–7) | 5 (1–19) | 7 (0–12) |
| CD4+ T cells | |||
| IFN-γ | 159 (112–318) | 210 (69–394) | 184 (86–318) |
| IL-2 | 309 (150–633) | 406 (181–828) | 359 (263–641) |
| IL-4 | 19 (11–33) | 28 (13–77) | 21 (10–54) |
| IL-13 | 34 (22–37) | 39 (20–86) | 34 (17–70) |
Values are presented as median (ranges).
P < 0·05 compared to controls.
The percentages of IFN-γ-, IL-2-, IL-4-, and IL-13-producing cells among CD4+ T cells were similar between the three groups (Fig. 3). Similarly, no significant difference was observed in the absolute numbers of IFN-γ-, IL-2-, IL-4-, or IL-13-producing CD4+ T cells in peripheral blood between the three groups (Table 2).
The Th1 : Th2 and Tc1 : Tc2 ratios were evaluated from the ratio of IFN-γ-producing cells to IL-4-producing cells. The Tc1 : Tc2 ratios of peripheral CD8+ T cells in dSSc patients (median 46, range 20–82, P < 0·001) and lSSc patients (38, 11–102, P < 0·01) were significantly elevated compared with normal controls (24, 14–46). In contrast, there was no significant difference in the Th1 : Th2 ratios of CD4+ T cells between the three groups (data not shown).
Concerning the clinical correlation of intracellular cytokine production, the frequency of IFN-γ-producing cells among CD8+ cells in peripheral blood correlated inversely with percentage DLco (r = −0·650, P < 0·005; Fig. 4). A similar correlation was observed in SSc patients without pulmonary fibrosis (r = − 0·48, P < 0·05). The frequencies of IFN-γ-producing CD8+ T cells were similar between SSc patients with lung fibrosis and those without lung fibrosis (data not shown). None of the 27 patients examined in this study exhibited pulmonary hypertension, and pulmonary artery pressure showed no correlation with the frequency of IFN-γ-producing CD8+ T cells (data not shown). Otherwise, there was no correlation between the proportions of any cytokine-producing cells and any clinical or serological features.
Fig. 4.
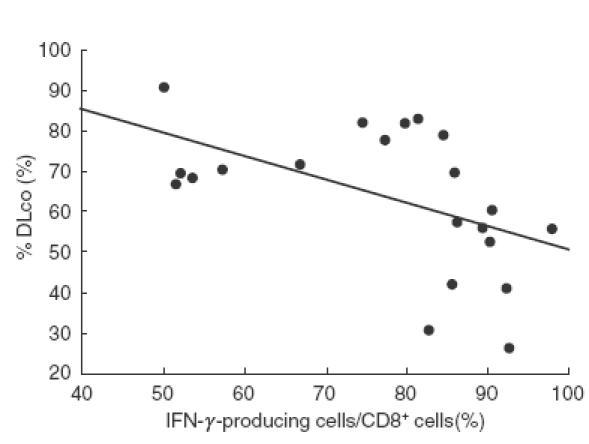
The inverse relation between the frequency of IFN-γ-producing cells among peripheral blood CD8+ T cells and percentage DLco in SSc patients. Intracellular expression of IFN-γ was determined by flow cytometry, as described in Fig. 1. r =−0·650; P < 0·005
Intracellular cytokine production in CXCR3+ CD8+ T cells
To confirm association of CXCR3 expression with IFN-γ production in CD8+ T cells, production of IFN-γ and IL-4 in the cytoplasm of activated blood CXCR3+ CD8+ T cells from SSc patients was determined by flow cytometry with three-colour analysis (Fig. 5). IFN-γ was selectively detected in CXCR3+ CD8+ T cells from SSc patients (n = 6, 3 dSSc and 3 lSSc) and normal controls (n = 6), whereas IL-4 was not observed. Thus, CXCR3+ CD8+ T cells selectively produced IFN-γ. The frequency of IFN-γ-producing cells in CXCR3+ CD8+ T cells was significantly increased in SSc patients (median 84%, range 77–89%) compared with normal controls (50%, 39–71%, P < 0·01). The frequency of CD8+ CCR4+ T cells was so small that cytokine production in these cells could not be assessed. However, a previous study confirmed that peripheral CCR4+ and CXCR3+ CD4+ T cells predominantly produced IL-4 and IFN-γ, respectively [39].
Fig. 5.
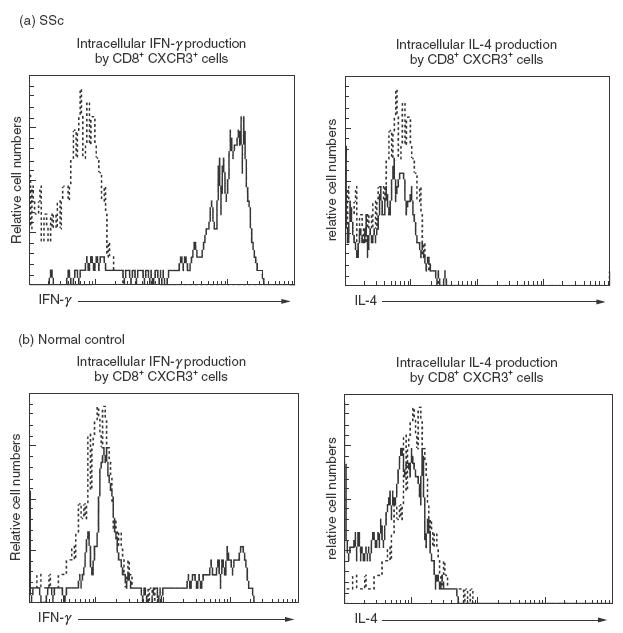
Representative expression of IFN-γ and IL-4 in the cytoplasm of CXCR3+ CD8+ T cells in peripheral blood from (a) a patient with SSc and (b) a normal control. Whole blood samples were activated with phorbol myristate acetate and ionomycin in the presence of brefeldin A. Intracellular cytokine production was determined by flow cytometry with three-colour analysis. Histograms represent live cells gated for expression of CD8 and CXCR3 (——). Staining of control MoAbs (------).
Chemokine receptor expression in T cells
CXCR3 and CCR4 expression on peripheral blood CD4+ or CD8+ CD45RO+ T cells was assessed by flow cytometry with three-colour analysis (Fig. 6): 10000 CD4+ or CD8+ cells were collected per sample. No significant difference was detected in the percentages of CXCR3-expressing CD45RO+ T cells among CD8+ T cells between SSc patients and normal controls. Concerning subsets of SSc, however, there was a significant increase in the percentage of CXCR3-expressing CD45RO+ T cells among CD8+ T cells in lSSc patients compared with normal controls (P < 0·01), but no significant difference compared with dSSc patients. The percentages of CXCR3-expressing CD45RO+ T cells among CD8+ T cells were similar for dSSc patients and normal controls. In contrast, no significant difference was found in the percentages of CCR4-expressing CD8+ CD45RO+ T cells between the three groups. There was no significant difference in the frequency of CXCR3- or CCR4-expressing CD45RO+ T cells among CD4+ T cells between the three groups. Similar results were obtained when absolute numbers of CXCR3- or CCR4-expressing CD8+ or CD4+ memory T cells were assessed (Table 3).
Fig. 6.
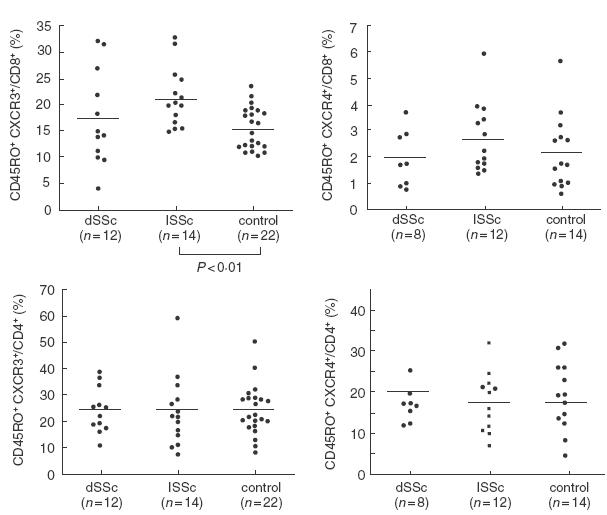
Frequencies of CCR4+ or CXCR3+ cells in peripheral blood CD8+ or CD4+ memory T cells from dSSc patients, lSSc patients, and normal controls (control). CCR4 and CXCR3 expression was determined by flow cytometry with three-colour analysis. Bars indicate the medians.
Table 3.
Absolute numbers of CD8+ or CD4+ T cells expressing CXCR3 or CCR4
| T cells (per mm3) | |||
|---|---|---|---|
| Chemokine receptor | dSSc | lSSc | Control |
| CD8+ T cells | |||
| CXCR3 | 62 (33–135) | 73 (41–120)* | 63 (39–106) |
| CCR4 | 8 (2–15) | 7 (3–15) | 8 (2–18) |
| CD4+ T cells | |||
| CXCR3 | 117 (83–222) | 182 (44–369) | 136 (52–356) |
| CCR4 | 101 (33–135) | 141 (38–228) | 133 (27–308) |
Values are presented as medians (range).
P < 0·05 compared to controls.
Discussion
In this study, intracellular cytokine analysis at the single cell level showed that the numbers of IFN-γ-producing CD8+ T cells in SSc patients were increased compared with those in normal controls. Consistently, the numbers of CXCR3+ CD8+ memory T cells in lSSc patients were higher than those in normal controls. In contrast, no evidence suggesting Th1/Th2 imbalance in CD4+ T cells was observed. Thus, the results of this study demonstrate a strong shift to Tc1 in peripheral blood CD8+ T cells from SSc patients, but no definite Th1/Th2 imbalance in CD4+ T cells.
The present findings contradict previous observations that suggested the predominance of type 2 immune response in SSc patients based on elevated serum levels and production by cultured PBMC of type 2 cytokines and increased serum soluble CD30 [16–21]. Although the reasons for this are not clear, it is possible that serum cytokine levels and cytokine production by isolated PBMC are derived not only from T cells, but also from various immune cells including macrophages, fibroblasts, NK cells, and B cells. T cell populations may change while being cultured for dozens of hours. Moreover, analysis of serum concentrations and production levels by PBMC of cytokines cannot detect the profiles of T cells at the single cell level. Finally, controversial information has been reported regarding the role of CD30 as a Th2 cell differentiation marker since a recent study reported that CD30 is also expressed on activated Th0 and Th1 cells [40]. The present results are also inconsistent with the observations by Giacomelli et al. [24]; they showed type 2 predominance of circulating α/β T cells, using intracellualr cytokine analysis. Although the reason for this discrepancy is unclear, it may be related to the difference in the studied populations: 27 patients within 5 years from the onset were enrolled in the present study, while 13 patients whose disease duration was not clarified were assessed in their investigation.
It has been appreciated that type 1 and type 2 T cells express different sets of chemokine receptors, allowing them to migrate into different tissues [41]. CXCR3 has been reported to be preferentially expressed on Th1 and Tc1 cells, whereas CCR4 on Th2 and Tc2 cells [27–30]. Consistent with normal Th1/Th2 balance by intracellular cytokine analysis in SSc, we found the normal numbers of CXCR3- or CCR4-expressing CD4+ memory T cells in SSc patients. Furthermore, consistent with the increased Tc1 cells in lSSc patients by intracellular cytokine analysis, lSSc patients exhibited elevated numbers of CXCR3+ CD8+ memory T cells. Moreover, we confirmed that IFN-γ was selectively produced in the cytoplasm of CXCR3+ CD8+ cells while IL-4 was not detected. However, unlike the results of intracellular cytokine analysis, the numbers of CXCR3+ CD8+ memory cells were similar for dSSc patients and normal controls. Since almost all CXCR3+ CD8+ T cells expressed intracellular IFN-γ in SSc patients, the normal numbers of CXCR3+ CD8+ memory cells in dSSc patients suggest that subsets of CD8+ cells other than CXCR3+ cells may also produce IFN-γ. Consistently, it has been reported that IFN-γ-producing cells also express CCR5, CXCR6, and CCR2 [42]. Nevertheless, the results of the present study suggest that the balance of Tc1/Tc2 or Th1/Th2 by intracellular cytokine analysis is also supported by the analysis of the expression of chemokine receptors.
SSc patients with active lung disease have increased numbers and percentages of lymphocytes, accompanied by an increase in CD8+ T cells and a decrease in CD4+ T cells, in the lung interstitium on biopsy and BALF [6–8]. In addition, concurrent activation of type 1 as well as type 2 phenotype has been observed in the lung interstitium from patients with fibrosing alveolitis [25]. The present study showed that IFN-γ-producing CD8+ T cells correlated inversely with percentage DLco in SSc patients. It is likely that this correlation of IFN-γ-producing CD8+ T cells with percentage DLco reflects pulmonary vascular damage rather than lung fibrosis since such a correlation was also observed in patients without pulmonary fibrosis. Consistently, the number of CXCR3+ CD8+ memory cells was increased in lSSc patients, but not in dSSc patients who are more frequently associated with lung fibrosis. Chemokines and chemokine receptors were shown to have the capability of regulating the selective migration of Th1/Tc1 cells and Th2/Tc2 cells to the target tissues and of controlling the type 1 and type 2 immune responses [41]. Therefore, the present results suggest that Tc1 cells that infiltrate into the lung interstitium possibly by CXCR3 may contribute to the pulmonary microvascular damage in SSc, especially in lSSc.
In conclusion, we have shown a strong shift to Tc1 cells among CD8+ T cells but no Th1/Th2 imbalance among CD4+ T cells in peripheral blood from SSc patients. In addition, the present findings suggest that elevated proportions of Tc1 cells may be associated with the pulmonary vascular damage. These findings not only will lead to a better understanding of pathogenesis of SSc, but could provide a therapeutic target for SSc.
Acknowledgments
We Thank Ms. M. Matsubara and Y. Yamada for technical assistance. The anti-CCR4 MoAb was kindly provided by Dr N. Hanai (Kyowa Hakko, Tokyo).
REFERENCES
- 1.Gruschwitz M, Sepp N, Kofler H, Wick G. Expression of class II-MHC antigens in the dermis of patients with progressive systemic sclerosis. Immunobiology. 1991;182:234–55. doi: 10.1016/S0171-2985(11)80660-1. [DOI] [PubMed] [Google Scholar]
- 2.Gruschwitz M, von den Vieth G. Up-regulation of class II major histocompatibility complex and intercellular adhesion molecule 1 expression on scleroderma fibroblasts and endothelial cells by interferon-gamma and tumor necrosis factor alpha in the early disease stage. Arthritis Rheum. 1997;40:540–50. doi: 10.1002/art.1780400321. [DOI] [PubMed] [Google Scholar]
- 3.Gruschwitz M, von den Driesch P, Kellner I, Hornstein OP, Sterry W. Expression of adhesion proteins involved in cell-cell and cell–matrix interactions in the skin of patients with progressive systemic sclerosis. J Am Acad Dermatol. 1992;27:169–77. doi: 10.1016/0190-9622(92)70165-c. [DOI] [PubMed] [Google Scholar]
- 4.Sollberg S, Peltonen J, Uitto J, Jimenez SA. Elevated expression of beta 1 and beta 2 integrins, intercellular adhesion molecule 1, and endothelial leukocyte adhesion molecule 1 in the skin of patients with systemic sclerosis of recent onset. Arthritis Rheum. 1992;35:290–8. doi: 10.1002/art.1780350307. [DOI] [PubMed] [Google Scholar]
- 5.Prescott RJ, Freemont AJ, Jones CJ, Hoyland J, Fielding P. Sequential dermal microvascular and perivascular changes in the development of scleroderma. J Pathol. 1992;166:255–63. doi: 10.1002/path.1711660307. [DOI] [PubMed] [Google Scholar]
- 6.Edelson JD, Hyland RH, Ramsden M, et al. Lung inflammation in scleroderma. clinical, radiographic, physiologic and cytopathological features. J Rheumatol. 1985;12:957–63. [PubMed] [Google Scholar]
- 7.Wells A, Hansell D, Rubens M, King A, Cramer D, Black C, du Bois R. Fibrosing alveolitis in systemic sclerosis. indices of lung function in relation to extent of disease on computed tomography. Arthritis Rheum. 1997;40:1229–36. doi: 10.1002/1529-0131(199707)40:7<1229::AID-ART6>3.0.CO;2-W. [DOI] [PubMed] [Google Scholar]
- 8.Yurovsky VV, Wigley FM, Wise RA, White B. Skewing of the CD8+ T-cell repertoire in the lungs of patients with systemic sclerosis. Hum Immunol. 1996;48:84–97. doi: 10.1016/0198-8859(96)00091-2. [DOI] [PubMed] [Google Scholar]
- 9.Kahaleh B. Immunologic aspects of scleroderma. Curr Opin Rheumatol. 1993;5:760–5. doi: 10.1097/00002281-199305060-00011. [DOI] [PubMed] [Google Scholar]
- 10.Fiocco U, Rosada M, Cozzi L, et al. Early phenotypic activation of circulating helper memory T cells in scleroderma: correlation with disease activity. Ann Rheum Dis. 1993;52:272–7. doi: 10.1136/ard.52.4.272. [DOI] [PMC free article] [PubMed] [Google Scholar]
- 11.Salgame P, Abrams JS, Clayberger C, Goldstein H, Convit J, Modlin RL, Bloom BR. Differing lymphokine profiles of functional subsets of human CD4 and CD8 T cell clones. Science. 1991;254:279–82. doi: 10.1126/science.254.5029.279. [DOI] [PubMed] [Google Scholar]
- 12.Paliard X, Waal D, Malefijt R, et al. Simultaneous production of IL-2, IL-4, and IFN-gamma by activated human CD4+ and CD8+ T cell clones. J Immunol. 1988;141:849–55. [PubMed] [Google Scholar]
- 13.Romagnani S. T-cell subsets (Th1 versus Th2) Ann Allergy Asthma Immunol. 2000;85:9–18. doi: 10.1016/S1081-1206(10)62426-X. [DOI] [PubMed] [Google Scholar]
- 14.Lucey DR, Clerici M, Shearer GM. Type 1 and type 2 cytokine dysregulation in human infectious, neoplastic, and inflammatory diseases. Clin Microbiol Rev. 1996;9:532–62. doi: 10.1128/cmr.9.4.532. [DOI] [PMC free article] [PubMed] [Google Scholar]
- 15.Nakazawa M, Sugi N, Kawaguchi H, Ishii N, Nakajima H, Minami M. Predominance of type 2 cytokine-producing CD4+ and CD8+ cells in patients with atopic dermatitis. J Allergy Clin Immunol. 1997;99:673–82. doi: 10.1016/s0091-6749(97)70030-7. [DOI] [PubMed] [Google Scholar]
- 16.Needleman BW, Wigley FM, Stair RW. Interleukin-1, interleukin-2, interleukin-4, interleukin-6, tumor necrosis factor alpha, and interferon-gamma levels in sera from patients with scleroderma. Arthritis Rheum. 1992;35:67–72. doi: 10.1002/art.1780350111. [DOI] [PubMed] [Google Scholar]
- 17.Famularo G, Procopio A, Giacomelli R, Danese C, Sacchetti S, Perego MA, Santoni A, Tonietti G. Soluble interleukin-2 receptor, interleukin-2 and interleukin-4 in sera and supernatants from patients with progressive systemic sclerosis. Clin Exp Immunol. 1990;81:368–72. doi: 10.1111/j.1365-2249.1990.tb05340.x. [DOI] [PMC free article] [PubMed] [Google Scholar]
- 18.Kahaleh MB, Yin TG. Enhanced expression of high-affinity interleukin-2 receptors in scleroderma: possible role for IL-6. Clin Immunol Immunopathol. 1992 doi: 10.1016/0090-1229(92)90028-m. [DOI] [PubMed] [Google Scholar]
- 19.Hasegawa M, Fujimoto M, Kikuchi K, Takehara K. Elevated serum levels of interleukin 4 (IL-4), IL-10, and IL-13 in patients with systemic sclerosis. J Rheumatol. 1997;24:328–32. [PubMed] [Google Scholar]
- 20.Giacomelli R, Matucci CM, Cipriani P, et al. Circulating Vdelta1+ T cells are activated and accumulate in the skin of systemic sclerosis patients. Arthritis Rheum. 1998;41:327–34. doi: 10.1002/1529-0131(199802)41:2<327::AID-ART17>3.0.CO;2-S. [DOI] [PubMed] [Google Scholar]
- 21.Mavalia C, Scaletti C, Romagnani P, et al. Type 2 helper T-cell predominance and high CD30 expression in systemic sclerosis. Am J Pathol. 1997;151:1751–8. [PMC free article] [PubMed] [Google Scholar]
- 22.Hasegawa M, Fujimoto M, Kikuchi K, Takehara K. Elevated serum tumor necrosis factor-alpha levels in patients with systemic sclerosis: association with pulmonary fibrosis. J Rheumatol. 1997;24:663–5. [PubMed] [Google Scholar]
- 23.Sato S, Hanakawa H, Hasegawa M, et al. Levels of interleukin 12, a cytokine of type 1 helper T cells, are elevated in sera from patients with systemic sclerosis. J Rheumatol. 2000;27:2838–42. [PubMed] [Google Scholar]
- 24.Giacomelli R, Cipriani P, Fulminis A, Barattelli G, Matucci CM, D’Alo S, Cifone G, Tonietti G. Circulating gamma/delta T lymphocytes from systemic sclerosis (SSc) patients display a T helper (Th) 1 polarization. Clin Exp Immunol. 2001;125:310–5. doi: 10.1046/j.1365-2249.2001.01603.x. [DOI] [PMC free article] [PubMed] [Google Scholar]
- 25.Majumdar SLD, Ansari T, Pantelidis P, Black C, Gizycki M, du Bois R, Jeffery P. Different cytokine profiles in cryptogenic fibrosing alveolitis and fibrosing alveolitis associated with systemic sclerosis: a quantitative study of open lung biopsies. Eur Respir J. 1999;14:251–7. doi: 10.1034/j.1399-3003.1999.14b03.x. [DOI] [PubMed] [Google Scholar]
- 26.Maino VC, Picker LJ. Identification of functional subsets by flow cytometry: intracellular detection of cytokine expression. Cytometry. 1998;34:207–15. doi: 10.1002/(sici)1097-0320(19981015)34:5<207::aid-cyto1>3.0.co;2-j. [DOI] [PubMed] [Google Scholar]
- 27.Cosmi L, Annunziato F, Galli M, Maggi R, Nagata K, Romagnani S. CRTH2 is the most reliable marker for the detection of circulating human type 2 Th and type 2 T cytotoxic cells in health and disease. Eur J Immunol. 2000;30:2972–9. doi: 10.1002/1521-4141(200010)30:10<2972::AID-IMMU2972>3.0.CO;2-#. [DOI] [PubMed] [Google Scholar]
- 28.Cerwenka A, Morgan TM, Harmsen AG, Dutton RW. Migration kinetics and final destination of type 1 and type 2 CD8 effector cells predict protection against pulmonary virus infection. J Exp Med. 1999;189:423–34. doi: 10.1084/jem.189.2.423. [DOI] [PMC free article] [PubMed] [Google Scholar]
- 29.Ward SG, Bacon K, Westwick J. Chemokines and T lymphocytes: more than an attraction. Immunity. 1998;9:1–11. doi: 10.1016/s1074-7613(00)80583-x. [DOI] [PubMed] [Google Scholar]
- 30.Sallusto F, Lanzavecchia A, Mackay CR. Chemokines and chemokine receptors in T-cell priming and Th1/Th2-mediated responses. Immunol Today. 1998;19:568–74. doi: 10.1016/s0167-5699(98)01346-2. [DOI] [PubMed] [Google Scholar]
- 31.Subcommittee for scleroderma criteria of the American Rheumatism Association Diagnostic and Therapeutic Criteria Committee. Preliminary criteria for the classification of systemic sclerosis (Scleroderma) Arthritis Rheum. 1980;23:581–90. doi: 10.1002/art.1780230510. [DOI] [PubMed] [Google Scholar]
- 32.LeRoy EC, Black C, Fleischmajer R, Jablonska S, Krieg T, Medsger TJ, Rowell N, Wollheim F. Scleroderma (systemic sclerosis): classification, subsets and pathogenesis. J Rheumatol. 1988;15:202–5. [PubMed] [Google Scholar]
- 33.Steen VD, Powell DL, Medsger TJ. Clinical correlations and prognosis based on serum autoantibodies in patients with systemic sclerosis. Arthritis Rheum. 1988;31:196–203. doi: 10.1002/art.1780310207. [DOI] [PubMed] [Google Scholar]
- 34.Sato S, Ihn H, Soma Y, Igarashi A, Tamaki T, Kikuchi K, Ishibashi Y, Takehara K. Antihistone antibodies in patients with localized scleroderma. Arthritis Rheum. 1993;36:1137–41. doi: 10.1002/art.1780360815. [DOI] [PubMed] [Google Scholar]
- 35.Jung T, Schauer U, Heusser C, Neumann C, Rieger C. Detection of intracellular cytokines by flow cytometry. J Immunol Meth. 1993;159:197–207. doi: 10.1016/0022-1759(93)90158-4. [DOI] [PubMed] [Google Scholar]
- 36.Sato S, Miller AS, Inaoki M, Bock CB, Jansen PJ, Tang ML, Tedder TF. CD22 is both a positive and negative regulator of B lymphocyte antigen receptor signal transduction: altered signaling in CD22-deficient mice. Immunity. 1996;5:551–62. doi: 10.1016/s1074-7613(00)80270-8. [DOI] [PubMed] [Google Scholar]
- 37.Imai T, Nagira M, Takagi S, et al. Selective recruitment of CCR4-bearing Th2 cells toward antigen-presenting cells by the CC chemokines thymus and activation-regulated chemokine and macrophage-derived chemokine. Int Immunol. 1999;11:81–8. doi: 10.1093/intimm/11.1.81. [DOI] [PubMed] [Google Scholar]
- 38.Bigby M, Wang P, Fierro JF, Sy MS. Phorbol myristate acetate-induced down-modulation of CD4 is dependent on calmodulin and intracellular calcium. J Immunol. 1990;144:3111–6. [PubMed] [Google Scholar]
- 39.Nakatani T, Kaburagi Y, Shimada Y, Inaoki M, Takehara K, Mukaida N, Sato S. CCR4 memory CD4+ T lymphocytes are increased in peripheral blood and lesional skin from patients with atopic dermatitis. J Allergy Clin Immunol. 2001;107:353–8. doi: 10.1067/mai.2001.112601. [DOI] [PubMed] [Google Scholar]
- 40.Tarkowski M. Expression and function of CD30 on T lymphocytes. Arch Immunol Ther Exp (Warsz) 1999;47:217–21. [PubMed] [Google Scholar]
- 41.D’Ambrosio D, Iellem A, Colantonio L, Clissi B, Pardi R, Sinigaglia F. Localization of Th-cell subsets in inflammation: differential thresholds for extravasation of Th1 and Th2 cells. Immunol Today. 2000;21:183–6. doi: 10.1016/s0167-5699(00)01590-5. [DOI] [PubMed] [Google Scholar]
- 42.Kim CH, Rott L, Kunkel EJ, Genovese MC, Andrew DP, Wu L, Butcher EC. Rules of chemokine receptor association with T cell polarization in vivo. J Clin Invest. 2001;108:1331–9. doi: 10.1172/JCI13543. [DOI] [PMC free article] [PubMed] [Google Scholar]


