

Abstract
Purpose
To evaluate correlations between Retinal Nerve Fiber Layer (RNFL) thickness with visual field (VF) sensitivities in eyes with Non-artertic Anterior Ischemic Optic Neuropathy (NAION).
Design
case-control study.
Methods
This study was conducted in an academic, institutional setting. One eye from 21 NAION patients and 32 healthy participants were included in this prospective study. Humphrey Visual Field (HVF) sensitivities were obtained from standard achromatic HVF test (24-2 SITA). RNFL was measured with scanning laser polarimetry (GDx-VCC) and optical coherence tomographer (StratusOCT). Correlations were evaluated between RNFL and sensitivities from global, hemifields and regional locations of the VF pertinent to the RNFL distribution. 15 NAION eyes had an inferior altitudinal HVF defects and their global and regional RNFL was compared to that of control eyes. The main outcome measure was correlation between HVF sensitivities and RNFL.
Results
Correlations of global, hemifield and sectorial HVF sensitivities with RNFL were greater when RNFL was measured with StratusOCT than with GDx-VCC, except for nasal and infero-nasal sectors. RNFL thickness was significantly lower in the hemiretinas corresponding to the relative unaffected hemifield in eyes with altitudinal visual field defect compared to controls.
Conclusions
In patients with NAION, RNFL measured by StratusOCT provided better correlation to HVF changes than GDx-VCC did. Both instruments showed decreased RNFL in NAION eyes with altitudinal visual field defects compared to control eyes, demonstrating loss of RNFL even in sectors of the optic disc that corresponded to relatively unaffected hemifield, suggesting greater damaged beyond the extent estimated by visual field methods.
Introduction
Unlike the cupping that occurs with glaucomatous optic neuropathy, ganglion cell loss in non-arteritic anterior ischemic optic neuropathy (NAION) manifests as increased pallor of the optic disc, which is more difficult to access subjectively. Quantitative techniques that measure the peripapillary retinal nerve fiber layer (RNFL) thickness such as Optical Coherence Tomography (StratusOCT) and Scanning Laser Polarimetry (GDx-VCC) may be useful in evaluating pallor in non-glaucomatous optic neuropathy. These two imaging techniques have shown significant correlations to glaucoma severity as defined by standard perimetry. 1-6 Although usage of StratusOCT and GDx-VCC have been recently reported in non-glaucomatous optic neuropathies (compressive, traumatic, and optic neuritis),7-11 these two techniques have not been evaluated and compared to each other in NAION. The purpose of this study was to evaluate the correlations between visual field defects with RNFL thickness as measured by GDx-VCC and StratusOCT in NAION eyes.
Methods
A list of patients with NAION was obtained from the University of Alabama at Birmingham (UAB) Ophthalmology Clinics, seen from 2000 to 2003. All participants were interviewed for inclusion into present study. The UAB Institutional Review Board approved all methodology. All aspects of the protocol adhered to the tenets of the Declaration of Helsinki. The present study was compliant with Health Insurance Portability and Accountability Act (HIPPA) policies and informed consent was obtained from all participants.
The diagnosis of NAION was on the basis of complete ophthalmologic evaluation performed by a treating neuro-ophthalmologist. This evaluation revealed typical signs and symptoms of NAION (e.g. acute and painless loss of visual acuity and/or visual field loss, an ipsilateral relative afferent pupillary defect, color deficit, acute optic disc edema with hemorrhages in the acute phase, and optic disc crowding in the unaffected eye) and exclusion of arteritic anterior ischemic optic neuropathy based on clinical grounds and laboratory findings when indicated. In all cases, optic disc edema had resolved at the time of recruitment for the present study.
All subjects had a complete ophthalmologic examination including slit-lamp biomicroscopy, Goldmann applanation tonometry, stereoscopic fundus examination, and simultaneous stereoscopic photographs of the optic discs (Nidek technology America, Inc., Greensboro NC). In order to ensure reliable visual field examinations (defined as fixation losses and false-positive less than 33%), patients with visual acuity worse than 20/60 were excluded. Additionally, patients with spherical or cylinder refraction greater than ± 5.00 and ± 3.00 Diopters (D), respectively; taking medications known to affect visual sensitivity, or with co-existence of ophthalmologic or neurological disease, or previous ophthalmic surgery (other than uneventful cataract extraction) were excluded.
Visual fields (VF) consisted of 24-2 SITA12 (Humphrey Field Analyzer II, Humphrey-Zeiss Instruments, San Leandro CA). Sensitivity values from 52 locations within the central 24 spot, were grouped into the following regions: global field, superior and inferior hemifields, and into 6 visual field regions corresponding to 6 sectors pertinent to the RNFL anatomy as described by Garway-Heath et al.13 (Fig. 1).
Figure 1.
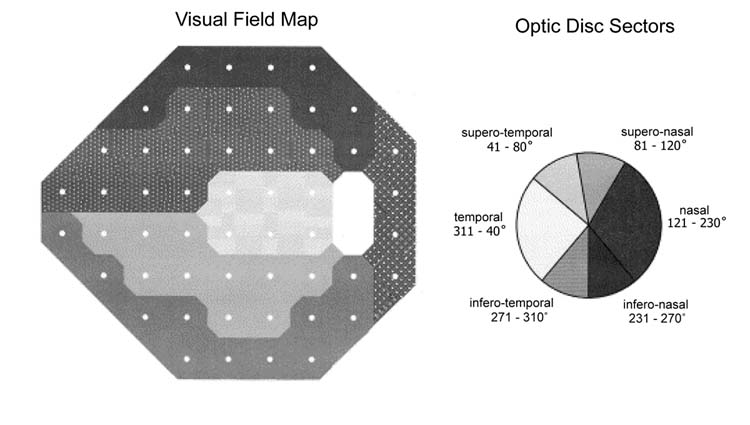
Humphrey visual field map (left) and their corresponding optic disc sectors (right) as described by Garway-Heath and collaborators (reprinted with permission from authors).
Peripapillary RNFL thickness was obtained using the StratusOCT (Carl Zeiss Meditec Inc., Dublin, CA) and GDx-VCC (Laser Diagnostic Technologies, Inc, San Diego, CA). Details of the operation of each instrument have been described elsewhere. 14, 15 In brief, StratusOCT uses an edge-detection algorithm to automatically differentiate retinal microstructures, such as RNFL, on the basis of their reflectivity.16, 17 The GDx-VCC measures the retardation based on the birefringence properties of the RNFL.18 Retardation values are then converted into relative RNFL.19, 20 From each device, the raw data were exported into a database (256 points for StratusOCT and 64 points for GDx-VCC) (Fig. 2, right). From these points, RNFL was reconstructed to provided global thickness, thickness at the superior and inferior 90 following optic disc sectors13: temporal (311 - 40°), supero-temporal (41 - 80°), supero-nasal (81 - 120°), nasal (121 - 230°), infero-nasal (231 - 270°) and infero-temporal (271 - 310°) (Fig. 1). Lastly, GDx-VCC also provides retardation parameters such as TSNIT (Temporal, Superior, Nasal, Inferior and Temporal), regional retardation (superior, inferior modulation, average and ratios), and Nerve Fiber Indicator (NFI). NFI is a support vector machine-derived parameter indicating the likelihood that an eye has abnormal RNFL thickness and is used for glaucoma detection.21 The mean of 3 scans were obtained with each device and only good quality scans, judged by an experienced operator (JDL-O), were included.
Figure 2.

Fundus photography obtained from an eye with non-arteritic anterior ischemic optic neuropathy (NAION) (left). The two circular lines represent the location and area scanned by GDx-VCC (thick line) and StratusOCT (thin line). The 360°-averaged profile ± 1 standard deviation of the retinal nerve fiber layer from NAION eyes is shown as for GDx-VCC and StratusOCT (right). The profile starts from the temporal side of the optic disc (0°), then superior, nasal, and inferior, ending at temporal sector (360°).
To evaluate the extent of RNFL loss corresponding to relatively unaffected areas of the VF, RNFL from NAION eyes with an altitudinal VF defect were compared with the RNFL from controls with healthy eyes. An altitudinal VF defect was defined as a field defect that respected the horizontal meridian, in which the abnormal hemifield had a minimum of 18 out of 26 test locations outside the 95% confidence interval (CI) on the total deviation (TD) probability plot, and the uninvolved hemifield had no more than 6 out of 26 locations outside the 95% CI in the TD plot.22 Data from one eye of controls were obtained from the UAB Optic Nerve Imaging Center database, and controls were matched to NAION patients in age and disc area. Disc areas were measured in both groups with the confocal scanning laser ophthalmoscope (HRT II, Heidelberg Engineering, Heidelberg, Germany) following standard procedures.23-25
Coefficients of determination from linear regression analysis were used to evaluate the relationship between RNFL and VF sensitivities, and were considered significant if the P-value of estimates was < 0.05. Correction for multiple comparisons was used for the correlations and comparisons of the 6 optic disc-visual field map sectors (Bonferroni, α= 0.008). Comparisons between groups were done using two-tailed t-tests for continuous variables and chi-square tests for categorical variables. Statistical analyses were conducted using JMP 5.0.1a (SAS Institute, Cary, NC).
Results
Twenty-four patients with NAION were recruited. One patient was excluded because of unreliable VF test results, and two patients were excluded for diabetic retinopathy found during ophthalmoscopy. Thus, data of 21 eyes from 21 patients with NAION were included with a mean age of 60.5 ± 13.9 years (mean ± 1 Standard Deviation). Eleven (52 %) patients were female and 18 (86 %) were of Caucasian ancestry. Twelve (66%) had a visual acuity of 20/30 or better, while the remainder had 20/40 to 20/50. Mean intraocular pressure (IOP) was 15.5 ± 3.1 mmHg. Visual field MD ranged from -2.4 to -28.7 Decibels (dB) (median = - 9.3, 25% quartile -16.5 dB, 75% quartile -3.9 dB). Fifteen patients had an altitudinal inferior field defect, and the remaining patients had extensive defects in superior and inferior hemifields. One of the authors (JDL-O) evaluated the optic disc stereo photographs using a masked method to determine localization of pallor, and pallor was found in the temporal sector in 4 eyes, in the superior pole in 11 eyes, and diffuse pallor in 6 eyes.
Table 1 shows the correlations between VF sensitivities and reconstructed RNFL thickness. Global RNFL showed significant correlations with MD and global sensitivity for GDx-VCC and StratusOCT, but StratusOCT was superior to GDx-VCC since the coefficients of determination were greater for StratusOCT. For the correlations between localized RNFL with their corresponding hemifield sensitivities (inferior, better and worst hemifields), StratusOCT also showed greater correlations than GDx-VCC, except for the superior hemifield in which GDx-VCC yielded a higher correlation. Furthermore, GDx-VCC was also superior for the correlations at the infero-nasal and nasal optic disc sectors. After Bonferroni correction, correlations that remained significant were at the infero-nasal and infero-temporal sectors for GDx-VCC (P = 0.003 and 0.001 respectively) and the infero-temporal sector for StratusOCT (P = 0.001).
Table 1.
Coefficient of determination (R2) for RNFL correlated with global index, hemifield and regional visual field data in eyes with non-arteritic anterior ischemic optic neuropathy (N = 21)
| GDx VCC |
StratusOCT |
|||
|---|---|---|---|---|
| SAP | R2 | P value | R2 | P value |
| Global Index: | ||||
| Mean Deviation | 0.45 | 0.001 | 0.63 | <0.0001 |
| VF Sensitivity (dB): | ||||
| Global | 0.43 | 0.001 | 0.64 | <0.0001 |
| Inferior Hemifield* | 0.15 | 0.081 | 0.32 | 0.007 |
| Superior Hemifield† | 0.57 | <0.001 | 0.40 | 0.002 |
| Worse Hemifield‡ | 0.13 | 0.1034 | 0.30 | 0.011 |
| Better Hemifield§ | 0.29 | 0.012 | 0.43 | 0.001 |
| VF Sensitivity by Disc Sectors:∥ | ||||
| Temporal# | 0.07 | 0.241 | 0.23 | 0.028 |
| Supero-temporal# | 0.14 | 0.098 | 0.24 | 0.026 |
| Supero-nasal# | 0.20 | 0.038 | 0.25 | 0.022 |
| Nasal# | 0.34 | 0.005 | 0.25 | 0.022 |
| Infero-nasal# | 0.24 | 0.002 | 0.18 | 0.055 |
| Infero-temporal# | 0.37 | 0.003 | 0.47 | 0.001 |
dB = Decibels, VF = visual field
Correlated to the superior 90° RNFL
Correlated to the inferior 90° RNFL
Correlated to hemifield with greatest number of abnormal test points (“worse hemifield”)
Correlated to the hemifield with no field defect in cases of altitudinal field defect, or to the hemifield with the least number of abnormal test points in cases of diffuse field defect
Bonferroni correction for 6 comparison, alpha = 0.008
Correlated with corresponding visual field region
GDx-VCC retardation parameters rather than the reconstructed global RNFL had higher correlations with the VF global index MD. Correlations were significant for the following retardation parameters: normalized inferior area (0.71), TSNIT standard deviation (0.63), inferior maximum (0.63), inferior average (0.62) (all with P < 0.001); maximum modulation (0.50), NFI (0.37), TSNIT average (0.43), ellipse modulation (0.34) (all with P < 0.01). However, the majority of these parameters provided specific information about RNFL thickness located at the inferior peripapillary sectors or about the degree of RNFL asymmetry between superior and inferior peripapillary sectors. Thus, while GDX-VCC did provided information about the status of RNFL in NAION, it was mainly from locations that were least affected by the disease, as the majority of patients had an altitudinal inferior hemifield defect, and failed to present significant correlations with the location mostly affected in this group of patients (i.e. superior peripapillary sector). These latter findings contrasted those findings obtained with StratusOCT, as all correlations between StratusOCT and VF were significant, regardless of the location evaluated.
Furthermore, to investigate the extent of RNFL loss, the superior RNFL thickness (corresponding to the inferior hemifield) from 15 NAION patients with an altitudinal inferior visual field defects was compared with a group of 32 healthy eyes, matched in age and disc area. Similar comparisons were done for inferior RNFL thickness corresponding to the relatively unaffected superior hemifield. The normal group had a mean age of 56.4 ± 9.4 years, and no differences were found between the NAION and normal group in age, race, gender, sphere and cylinder refraction, intraocular pressure, and optic disc area (P = 0.987, 0.50, 0.699, 0.478, 0.420, 0.326, respectively). As expected, the inferior hemifield in NAION eyes had lower sensitivities than in controls, but no differences were found in the superior hemifield (inferior hemifield: 18.1 ± 3.5 dB for NAION, 29.2 ± 6.1 dB for controls, P < 0.0001; superior hemifield: 27.3 ± 3.7 dB for NAION, 29.4 ± 3.7 dB for controls, P = 0.07). Results of RNFL group comparisons are shown in Table 2. GDx-VCC and StratusOCT showed that NAION eyes had significant decreased RNFL thickness at the superior sectors, which corresponded to inferior altitudinal visual field defects. An interesting finding was that at the inferior RNFL thickness (corresponding to the relative unaffected visual hemifield) also showed significantly lower values in NAION eyes than in controls eyes (P = 0.003 and 0.010 for GDx-VCC and StratusOCT, respectively). Similar findings were observed for the correlations between the 6 visual field regions corresponding to 6 sectors pertinent to the RNFL anatomy (Table 2). There were no differences between NAION and controls for RNFL thickness located at the temporal sector using both imaging devices.
Table 2.
RNFL thickness corresponding to affected and relative unaffected hemifields from 15 non-arteritic anterior ischemic optic neuropathy (NAION) eyes with altitudinal defects compared to 32 normal controls eyes.
| GDx VCC |
StratusOCT |
|||||
|---|---|---|---|---|---|---|
| NAION | Normal | P value | NAION | Normal | P value | |
| N = 15 | N = 32 | N = 15 | N = 32 | |||
| Global | 42.7 ± 10.6 | 54.5 ± 4.6 | <0.0001 | 74.8 ± 21.8 | 109.5 ± 14.3 | <0.0001 |
| Affected hemifield | 38.3 ± 10.6 | 69.7 ± 8.1 | <0.0001 | 67.9 ± 23.2 | 118.2 ± 19.4 | <0.0001 |
| Unaffected hemifield | 61.1 ± 11.7 | 70.6 ± 8.8 | 0.003 | 109.0 ± 33.8 | 133.2± 26.6 | 0.010 |
| Optic Disc Sectors:* | ||||||
| Temporal† | 35.4 ± 15.1 | 30.7 ± 9.9 | 0.211 | 66.8 ± 29.7 | 70.4 ± 16.3 | 0.590 |
| Supero-temporal† | 36.5 ± 14.0 | 67.6 ± 11.3 | <0.0001 | 74.2 ± 37.0 | 123.1 ± 21.1 | <0.0001 |
| Supero-nasal† | 42.8 ± 14.9 | 71.3 ± 11.1 | <0.0001 | 61.5 ± 25.1 | 113.2 ± 26.9 | <0.0001 |
| Nasal† | 37.9 ± 8.8 | 49.9 ± 7.8 | <0.0001 | 57.8 ± 17.4 | 83.7 ± 14.6 | <0.0001 |
| Infero-nasal† | 65.7 ± 15.5 | 80.3 ± 12.4 | 0.0012 | 97.1 ± 34.6 | 124.7 ± 31.7 | 0.0097 |
| Infero-temporal† | 59.7 ± 18.9 | 58.9 ± 13.6 | 0.877 | 120.9 ± 8.7 | 141.9 ± 5.9 | 0.0521 |
Data is displayed as mean ± 1 standard deviation
Bonferroni correction for 6 comparison, alpha = 0.008
Correlated with corresponding visual field region
Discussion
Visual field defects and optic disc pallor are two major diagnostic components of NAION, but they are variable in their clinical presentation among patients. 26 The extent and depth of visual field defects are quantifiable in a reproducible manner using standard automated perimetry. 27 In contrast, the information about optic disc pallor is usually from a subjective evaluation performed by the clinician and the quantification of extent and degree of pallor is a difficult task and prone to high variability among observers.28 Imaging devices that evaluate the topography of the optic disc, such as scanning laser ophthalmoscope, provide little information because NAION rarely produces significant changes at the rim and cup such as rim thinning and excavation. 29 Therefore, a valid approach is to determine the thickness of RNFL around the optic disc as a surrogate of the amount of ganglion cells axons coursing towards the optic nerve head. The present study evaluated two commercially available units that are currently used to quantify RNFL thickness in glaucoma patients: StratusOCT and GDx-VCC.5
Some information exists in the literature about evaluating RNFL in non-glaucomatous optic neuropathies caused by compressive, traumatic, inflammatory and toxic etiologies,7-10 disc edema30 using optical coherence tomography technique. Of interest, Trip et al. 11 found significant correlations between VF loss and RNFL thickness in patients with optic neuritis after the first (and single) episode suggesting that axonal loss was responsible of visual impairment. Conversely, little information is available about the use of scanning laser polarimetry technology in non-glaucomatous optic neuropathy.31, 32 Nevertheless, these limited studies suggest that both imaging devices are potentially useful in quantifying RNFL in clinical conditions other than in glaucoma. From our results, StratusOCT was superior to GDx-VCC since StratusOCT provided better information about the relationship between RNFL thickness and visual field sensitivity (affected and relatively unaffected regions).
A possible explanation for differences in the degree of correlations may be the dissimilarities in the dynamic range these imaging techniques particularly in eyes with significant damage. This is suggested in part by the dissimilarities in the range of measurements (± 1 SD) by each technique as shown in Figure 2. Sectors of RNFL corresponding to regions with greater damage had a narrower and flatter profile of RNFL with GDx-VCC than with StratusOCT. Additionally, GDx-VCC had a limited correlation with sensitivities from VF regions that were greatly affected, while a better correlation was observed in VF regions of relatively unaffected sensitivities. Thus, GDx-VCC had better performance measuring sectors of the RNFL that had relatively less affected thickness than in sectors with more affected (reduced) thickness. All these findings suggest that measurements with GDx-VCC, in contrast to StratusOCT, may have suffered from a floor effect, similar to the GDx-VCC findings observed in eyes of patients with end-stage glaucoma.33 Additional investigation is required to determine the dynamic range of both instruments, particularly in cases of extensive nerve fiber loss and consequently extensive field loss. If this is the case, this may have implications in follow up of patients with advanced glaucoma with these instruments.
Another interesting finding was that NAION eyes had lower RNFL thickness than control eyes in sectors corresponding to the relatively unaffected hemifield. This finding suggests that loss of RNFL in NAION may extend beyond the region that corresponds to the visual field defect as detected by SAP. The concept of greater damage and loss of RNFL beyond the one measured by SAP is supported by findings of greater field loss detected by Frequency-Doubling perimetry Technology (FDT) compared with SAP in NAION patients with altitudinal defects.22 The ability of StratusOCT to recognize RNFL loss beyond corresponding visual field defect is of clinical interest with potential use for follow-up of patients and estimation of visual prognosis, and as potential use in neuroprotection trial in non-glaucomatous optic neuropathy.
NAION and control eyes showed comparable RNFL thickness at the temporal sector (the papillo-macular bundle). Since all patients with NAION included in the present study had relative good visual acuity, it remains of interest to further evaluate this temporal sector and determine if it is significantly reduced in patients with greater visual acuity loss than in our patients. Perhaps, a relative normal thickness at the temporal sector may serve as a clinical indicator for preserved central vision. To maintain VF reliability, patients with NAION included in the analysis had relatively good central visual acuity, and our results may not be applicable to more severely damaged eyes with poor visual acuity.
In conclusion, both GDx-VCC and StratusOCT showed decreased RNFL in NAION eyes. StratusOCT was superior to GDx-VCC, as StratusOCT yielded higher correlations between visual field sensitivity with RNFL thickness than the GDx-VCC. A possible floor effect may be affecting retardation measurements of the RNFL, which limits the utility of GDx-VCC for evaluating NAION cases. Additionally, the degree of RNFL loss beyond visual field defect suggests greater anatomical injury than one seen with conventional clinical techniques (VF), suggesting that StratusOCT may provide a quantitative measurement of ganglion cell loss in the pale optic disc and should be considered in the evaluation of patients with NAION after swelling of the optic disc has resolved.
Figure 3.

Example of tests results of Humphrey Visual Field (HVF), GDx-VCC and StratusOCT retinal nerve fiber layer thickness from a patient with Non-arteritic Anterior Ischemic Optic Neuropathy (NAION) and an inferior altitudinal field defect.
Biographies
Biographic Sketch
 Julio De León Ortega, MD, PhD is research associate at the Department of Ophthalmology, University of Alabama at Birmingham (UAB). He obtained his medical degree from The Francisco Marroquín University Medical School in Guatemala. He completed his ophthalmology residency at The Hospital Juarez of Mexico, a program accredited by The National Autonomous University of Mexico. He completed a fellowship in glaucoma at Department of Ophthalmology and a Ph.D. degree from the Vision Sciences program, both at UAB.
 Christopher A. Girkin, MD, is an associate professor of Ophthalmology and director of the Glaucoma Service in the Department of Ophthalmology, at The University of Alabama at Birmingham. He completed his ophthalmology residency at The University of Alabama at Birmingham. He completed a fellowship in neuro-ophthalmology at Johns Hopkins1 Wilmer Eye Institute, Baltimore, Maryland, and was a Heed Glaucoma Fellow at The Shiley Eye Center at the University of California, San Diego.
Footnotes
Publisher's Disclaimer: This is a PDF file of an unedited manuscript that has been accepted for publication. As a service to our customers we are providing this early version of the manuscript. The manuscript will undergo copyediting, typesetting, and review of the resulting proof before it is published in its final citable form. Please note that during the production process errors may be discovered which could affect the content, and all legal disclaimers that apply to the journal pertain.
Financial Disclosure: The authors had no commercial interest.
Contribution to authors: design and conduct of the study (CAG, JDL-O); collection of data (JDL-O, SNA, KEC), management, analysis, and interpretation of data (JDL-O, CAG), preparation and review of manuscript (JDL-O, KEC); and approval of manuscript (JDO-L, CAG).
References
- 1.Bagga H, Greenfield DS, Feuer W, Knighton RW. Scanning laser polarimetry with variable corneal compensation and optical coherence tomography in normal and glaucomatous eyes. Am J Ophthalmol. 2003;135(4):521–9. doi: 10.1016/s0002-9394(02)02077-9. [DOI] [PubMed] [Google Scholar]
- 2.Medeiros FA, Zangwill LM, Bowd C, et al. Comparison of scanning laser polarimetry using variable corneal compensation and retinal nerve fiber layer photography for detection of glaucoma. Arch Ophthalmol. 2004;122(5):698–704. doi: 10.1001/archopht.122.5.698. [DOI] [PubMed] [Google Scholar]
- 3.Medeiros FA, Zangwill LM, Bowd C, et al. Use of progressive glaucomatous optic disk change as the reference standard for evaluation of diagnostic tests in glaucoma. Am J Ophthalmol. 2005;139(6):1010–8. doi: 10.1016/j.ajo.2005.01.003. [DOI] [PubMed] [Google Scholar]
- 4.Medeiros FA, Zangwill LM, Bowd C, et al. Evaluation of retinal nerve fiber layer, optic nerve head, and macular thickness measurements for glaucoma detection using optical coherence tomography. Am J Ophthalmol. 2005;139(1):44–55. doi: 10.1016/j.ajo.2004.08.069. [DOI] [PubMed] [Google Scholar]
- 5.Medeiros FA, Zangwill LM, Bowd C, Weinreb RN. Comparison of the GDx VCC scanning laser polarimeter, HRT II confocal scanning laser ophthalmoscope, and stratus OCT optical coherence tomograph for the detection of glaucoma. Arch Ophthalmol. 2004;122(6):827–37. doi: 10.1001/archopht.122.6.827. [DOI] [PubMed] [Google Scholar]
- 6.Leung CK, Chong KK, Chan WM, et al. Comparative study of retinal nerve fiber layer measurement by StratusOCT and GDx VCC, II: structure/function regression analysis in glaucoma. Invest Ophthalmol Vis Sci. 2005;46(10):3702–11. doi: 10.1167/iovs.05-0490. [DOI] [PubMed] [Google Scholar]
- 7.Gotoh Y, Machida S, Tazawa Y. Selective loss of the photopic negative response in patients with optic nerve atrophy. Arch Ophthalmol. 2004;122(3):341–6. doi: 10.1001/archopht.122.3.341. [DOI] [PubMed] [Google Scholar]
- 8.Tatsumi Y, Kanamori A, Kusuhara A, et al. Retinal nerve fiber layer thickness in optic tract syndrome. Jpn J Ophthalmol. 2005;49(4):294–6. doi: 10.1007/s10384-005-0195-y. [DOI] [PubMed] [Google Scholar]
- 9.Savini G, Barboni P, Valentino ML, et al. Retinal nerve fiber layer evaluation by optical coherence tomography in unaffected carriers with Leber′s hereditary optic neuropathy mutations. Ophthalmology. 2005;112(1):127–31. doi: 10.1016/j.ophtha.2004.09.033. [DOI] [PubMed] [Google Scholar]
- 10.Zoumalan CI, Agarwal M, Sadun AA. Optical coherence tomography can measure axonal loss in patients with ethambutol-induced optic neuropathy. Graefes Arch Clin Exp Ophthalmol. 2005;243(5):410–6. doi: 10.1007/s00417-004-1053-1. [DOI] [PubMed] [Google Scholar]
- 11.Trip SA, Schlottmann PG, Jones SJ, et al. Retinal nerve fiber layer axonal loss and visual dysfunction in optic neuritis. Ann Neurol. 2005;58(3):383–91. doi: 10.1002/ana.20575. [DOI] [PubMed] [Google Scholar]
- 12.Bengtsson B, Heijl A. Evaluation of a new perimetric threshold strategy, SITA, in patients with manifest and suspect glaucoma. Act Ophthalmol Scand. 1998;76:268–72. doi: 10.1034/j.1600-0420.1998.760303.x. [DOI] [PubMed] [Google Scholar]
- 13.Garway-Heath DF, Poinoosawmy D, Fitzke FW, Hitchings RA. Mapping the visual field to the optic disc in normal tension glaucoma eyes. Ophthalmology. 2000;107(10):1809–15. doi: 10.1016/s0161-6420(00)00284-0. [DOI] [PubMed] [Google Scholar]
- 14.Stein DM, Wollstein G, Schuman JS. Imaging in glaucoma. Ophthalmol Clin North Am. 2004;17(1):33–52. doi: 10.1016/S0896-1549(03)00102-0. [DOI] [PMC free article] [PubMed] [Google Scholar]
- 15.Burgoyne CF. Image analysis of optic nerve disease. Eye. 2004;18(11):1207–13. doi: 10.1038/sj.eye.6701544. [DOI] [PubMed] [Google Scholar]
- 16.Huang D, Swanson EA, Lin CP, et al. Optical coherence tomography. Science. 1991;254(5035):1178–81. doi: 10.1126/science.1957169. [DOI] [PMC free article] [PubMed] [Google Scholar]
- 17.Hee MR, Izatt JA, Swanson EA, et al. Optical coherence tomography of the human retina. Arch Ophthalmol. 1995;113(3):325–32. doi: 10.1001/archopht.1995.01100030081025. [DOI] [PubMed] [Google Scholar]
- 18.Weinreb RN, Dreher AW, Coleman A, et al. Histopathologic validation of Fourier-ellipsometry measurements of retinal nerve fiber layer thickness. Arch Ophthalmol. 1990;108(4):557–60. doi: 10.1001/archopht.1990.01070060105058. [DOI] [PubMed] [Google Scholar]
- 19.Weinreb RN, Bowd C, Zangwill LM. Scanning laser polarimetry in monkey eyes using variable corneal polarization compensation. J Glaucoma. 2002;11(5):378–84. doi: 10.1097/00061198-200210000-00002. [DOI] [PubMed] [Google Scholar]
- 20.Morgan JE, Waldock A, Jeffery G, Cowey A. Retinal nerve fibre layer polarimetry: histological and clinical comparison. Br J Ophthalmol. 1998;82(6):684–90. doi: 10.1136/bjo.82.6.684. [DOI] [PMC free article] [PubMed] [Google Scholar]
- 21.Reus NJ, Lemij HG. Diagnostic accuracy of the GDx VCC for glaucoma. Ophthalmology. 2004;111(10):1860–5. doi: 10.1016/j.ophtha.2004.04.024. [DOI] [PubMed] [Google Scholar]
- 22.Girkin CA, McGwin G, Jr., DeLeon-Ortega J. Frequency doubling technology perimetry in non-arteritic ischaemic optic neuropathy with altitudinal defects. Br J Ophthalmol. 2004;88(10):1274–9. doi: 10.1136/bjo.2004.046383. [DOI] [PMC free article] [PubMed] [Google Scholar]
- 23.Bathija R, Zangwill L, Berry CC, et al. Detection of early glaucomatous structural damage with confocal scanning laser tomography. J Glaucoma. 1998;7(2):121–7. [PubMed] [Google Scholar]
- 24.Girkin CA, McGwin G, Jr., McNeal SF, DeLeon-Ortega J. Racial differences in the association between optic disc topography and early glaucoma. Invest Ophthalmol Vis Sci. 2003;44(8):3382–7. doi: 10.1167/iovs.02-0792. [DOI] [PubMed] [Google Scholar]
- 25.Girkin CA, McGwin G, Jr., Long C, et al. Subjective and objective optic nerve assessment in african americans and whites. Invest Ophthalmol Vis Sci. 2004;45(7):2272–8. doi: 10.1167/iovs.03-0996. [DOI] [PubMed] [Google Scholar]
- 26.Hayreh SS. Anterior ischaemic optic neuropathy. II. Fundus on ophthalmoscopy and fluorescein angiography. Br J Ophthalmol. 1974;58(12):964–80. doi: 10.1136/bjo.58.12.964. [DOI] [PMC free article] [PubMed] [Google Scholar]
- 27.Bengtsson B, Heijl A. Inter-subject variability and normal limits of the SITA Standard, SITA Fast, and the Humphrey Full Threshold computerized perimetry strategies, SITA STATPAC. Acta Ophthalmol Scand. 1999;77(2):125–9. doi: 10.1034/j.1600-0420.1999.770201.x. [DOI] [PubMed] [Google Scholar]
- 28.Cox MJ, O′Brien C. Comparison of computer-assisted versus manual optic nerve head pallor measurement. Invest Ophthalmol Vis Sci. 1992;33(11):3169–73. [PubMed] [Google Scholar]
- 29.Danesh-Meyer H, Savino PJ, Spaeth GL, Gamble GD. Comparison of arteritis and nonarteritic anterior ischemic optic neuropathies with the Heidelberg Retina Tomograph. Ophthalmology. 2005;112(6):1104–12. doi: 10.1016/j.ophtha.2004.12.041. [DOI] [PubMed] [Google Scholar]
- 30.Karam EZ, Hedges TR. Optical coherence tomography of the retinal nerve fibre layer in mild papilloedema and pseudopapilloedema. Br J Ophthalmol. 2005;89(3):294–8. doi: 10.1136/bjo.2004.049486. [DOI] [PMC free article] [PubMed] [Google Scholar]
- 31.Colen TP, van Everdingen JA, Lemij HG. Axonal loss in a patient with anterior ischemic optic neuropathy as measured with scanning laser polarimetry. Am J Ophthalmol. 2000;130(6):847–50. doi: 10.1016/s0002-9394(00)00627-9. [DOI] [PubMed] [Google Scholar]
- 32.Banks MC, Robe-Collignon NJ, Rizzo JF, 3rd, Pasquale LR. Scanning laser polarimetry of edematous and atrophic optic nerve heads. Arch Ophthalmol. 2003;121(4):484–90. doi: 10.1001/archopht.121.4.484. [DOI] [PubMed] [Google Scholar]
- 33.Blumenthal EZ, Horani A, Sasikumar R, et al. Correlating structure with function in end-stage glaucoma. Ophthalmic Surg Lasers Imaging. 2006;37(3):218–23. doi: 10.3928/15428877-20060501-06. [DOI] [PubMed] [Google Scholar]