Abstract
The lactate dehydrogenase A (LDH-A) gene, whose product participates in normal anaerobic glycolysis and is frequently increased in human cancers, has been identified as a c-Myc-responsive gene. It was of interest, therefore, to compare the effect of glucose deprivation in c-Myc-transformed and nontransformed cells. We observed that glucose deprivation or treatment with the glucose antimetabolite 2-deoxyglucose caused nontransformed cells to arrest in the G0/G1 phase of the cell cycle. In contrast, c-Myc-transformed fibroblasts, lymphoblastoid, or lung carcinoma cells underwent extensive apoptosis. Ectopic expression of LDH-A alone in Rat1a fibroblasts was sufficient to induce apoptosis with glucose deprivation but not with serum withdrawal, suggesting that LDH-A mediates the unique apoptotic effect of c-Myc when glycolysis is blocked. The apoptosis caused by glucose deprivation was blocked by Bcl-2 expression but appeared to be independent of wild-type p53 activity. These studies provide insights on the coupling of glucose metabolism and the cell cycle in c-Myc-transformed cells and may in the future be exploited for cancer therapeutics.
Keywords: lactate dehydrogenase, apoptosis, glucose deprivation
Deregulation of the c-myc oncogene is prevalent in various human cancers (1–3). The c-Myc protein participates in the regulation of cell proliferation, differentiation, and apoptosis induced by serum withdrawal (4–11). The mechanisms by which c-Myc induces neoplastic transformation and apoptosis are only beginning to emerge from studies of c-Myc target genes and signal transduction pathways (12). One of the putative c-Myc up-regulated genes that we identified by representational difference analysis was lactate dehydrogenase A (LDH-A) (13), which plays an essential role in glycolysis and has been strongly implicated as a tumor marker.
Glucose is an essential energy source for many life forms, and its deprivation can lead to growth arrest in yeast (14) and mammalian cells (15). In many normal nonproliferating cells, glucose is catabolized to pyruvate to generate ATP and NADH. Under aerobic conditions, pyruvate is further metabolized in the mitochondria to generate ATP through oxidative phosphorylation. When normal cells are deprived of oxygen, glucose continues to be catabolized to pyruvate, thereby generating ATP, but depleting the NAD+ pool. The conversion of pyruvate to lactate during anaerobic glycolysis regenerates NAD+, which may be reused for further catabolism of glucose. Glucose is required for mitogen-activated rat thymocytes to undergo proliferation that is coupled with a transition from aerobic to anaerobic metabolism, an 18-fold increase in glucose utilization, and an 8-fold induction of glycolytic enzymes (16). Tumor cells characteristically maintain a high glycolytic rate even under aerobic conditions, a phenomenon recognized by Warburg (17) and subsequently by Crabtree (18) seven decades ago. Because glucose levels are limited by diffusion into spheroid clusters of tumor cells (19), which are characterized by high aerobic glycolysis rates, we sought to determine whether glucose deprivation may play a role in regulating the growth of c-Myc-transformed cells and found that c-Myc transformed cells undergo apoptotic cell death with glucose deprivation.
EXPERIMENTAL PROCEDURES
Description of Plasmids.
The rat LDH-A sense expression vector was constructed by ligating an EcoRI–BglII 1.6-kb LDH-A cDNA fragment from pLDH-2 (20) into the corresponding sites of pSG5, a simian virus 40 promoter-driven expression vector (Stratagene).
Cell Culture and Transfection.
Rat fibroblast cells and mouse embryo fibroblast cells were cultured in a humidified atmosphere of 5% CO2 in air at 37°C in DMEM supplemented with 10% fetal bovine serum (FBS; GIBCO/BRL) and antibiotics (GIBCO/BRL). Human lymphoid cells were similarly cultured in Iscove’s modified Dulbecco’s medium (GIBCO/BRL). Human lung carcinoma cells were cultured in RPMI 1640 medium (GIBCO/BRL).
For glucose deprivation studies, cells were washed twice with PBS and then cultured with DMEM without glucose (GIBCO/BRL) containing dialyzed 10% FBS supplemented with sodium pyruvate. For serum withdrawal studies, cells were washed twice with PBS and cultured in DMEM with 0.1% FBS.
Rat1a fibroblasts were transfected with pSG5-LDH-A sense and a puromycin-resistance marker plasmid (pBABE puro) by using Lipofectin (GIBCO/BRL) as described (21). Pooled transfected Rat1a cells were selected with puromycin (Sigma; 0.75 μg/ml).
Apoptosis Assay and Bromodeoxyuridine (BrdUrd) Labeling.
The cell cycle distribution and the fraction of actively proliferating cells were determined by two-dimensional flow cytometry. Time-dependent data were obtained from cells grown to a half-confluent monolayer in culture flasks. After incubation for 30 min with BrdUrd (10 μM), the cells were washed, fixed in 70% ethanol at −20°C, digested with pepsin (0.4 mg/ml in 0.1 M HCl) for 30 min, incubated in 2 M HCl for 20 min at room temperature, and then stained with a fluorescein isothiocyanate-labeled anti-BrdUrd antibody (Becton Dickinson Immunocytometry Systems). The nuclei were subsequently stained for total DNA with propidium iodide (22, 23). Propidium iodide and fluorescein isothiocyanate fluorescence and forward light scattering were detected by using a Coulter EPICS 752 flow cytometer equipped with mdads 11 software, Version 1.0. Cell cycle distribution profiles were determined with a curve fitting program elite Version 3.0 (Coulter).
DNA fragmentation characteristics of apoptosis were quantified by using two-dimensional flow cytometry (24). Cells were fixed in 1% formaldehyde followed by 70% methanol, washed, and incubated at 37°C with the deoxynucleotide analog biotin-16-dUTP plus terminal deoxynucleotidyltransferase (TdT; Boehringer Mannheim). Cells were then treated with fluorescein isothiocyanate-conjugated avidin (Boehringer Mannheim) followed by propidium iodide staining and analyzed by flow cytometry as described above.
RESULTS
Glucose Deprivation Induces Apoptosis of c-Myc-Transformed Cells.
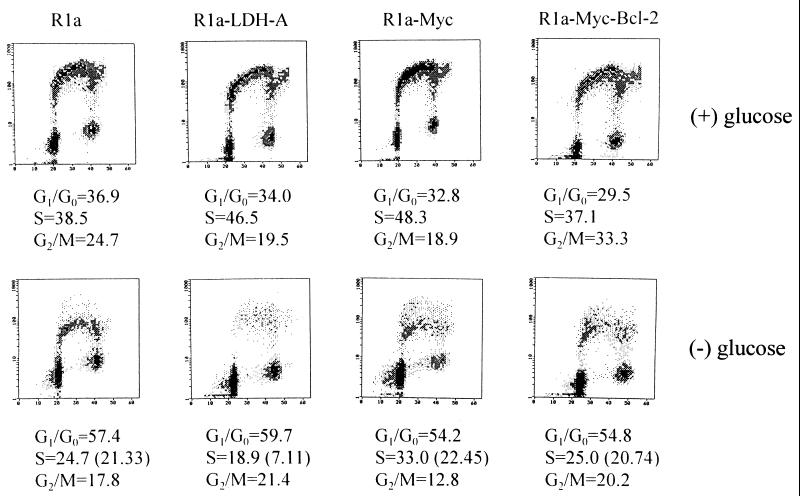
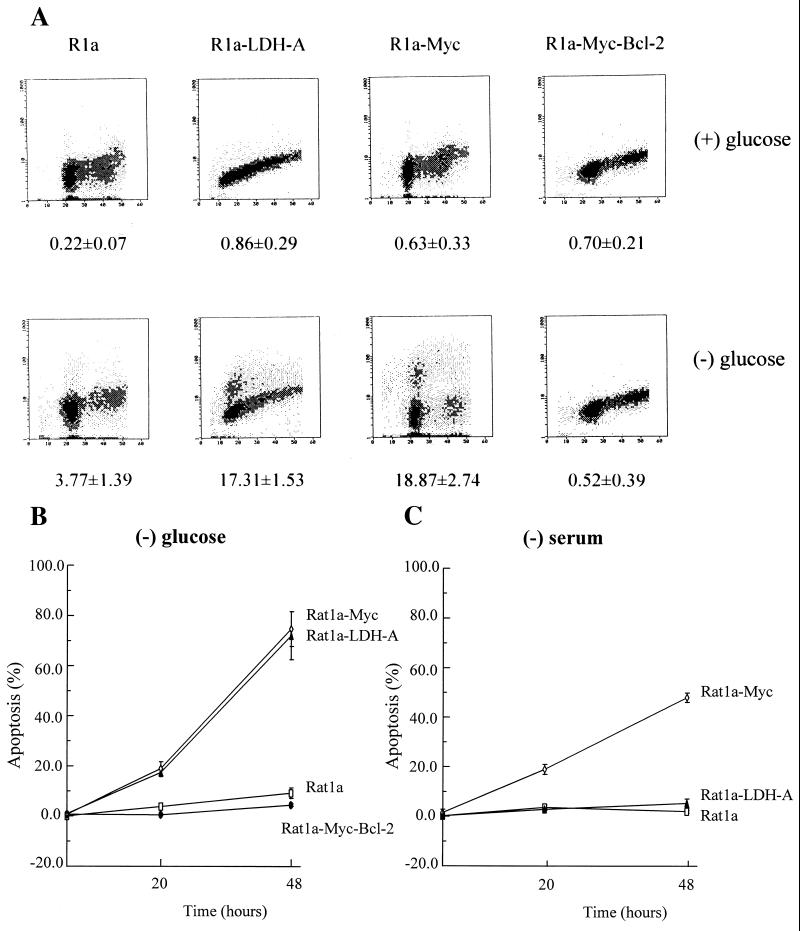
It has been reported that c-Myc participates in the regulation of apoptosis induced by serum deprivation (6, 8–10). Given c-Myc’s recently identified role as a transactivator of LDH-A, we sought to determine whether there were differences in the role of glycolysis in c-Myc-transformed cells compared with nontransformed cells. We first examined the effects of glucose deprivation on rat fibroblasts. Glucose deprivation of nontransformed Rat1a cells caused a reduction in BrdUrd incorporation, an enrichment in G0/G1 phase cells, and a reduction in G2/M cells (Fig. 1). Of the cells identified by curve fitting as being in S phase, 88% of glucose-deprived Rat1a cells incorporated BrdUrd, indicating that almost all were viable. In contrast, of the S phase Rat1a cells overexpressing c-Myc (Rat1a-Myc) upon glucose deprivation, 33% did not incorporate BrdUrd, indicating that a significant fraction of these cells were either arrested or dead. Microscopic examination showed that 20% of the Rat1a-Myc cells were round, refractile, and floating after 20 h of glucose deprivation, consistent with the hypothesis that they were either necrotic or apoptotic. We therefore determined the extent of apoptotic cell death by using the TdT end-labeling flow cytometric assay. As shown in Fig. 2, the nontransformed Rat1a cells displayed minimal apoptotic cell death with glucose deprivation. In contrast, the Rat1a-Myc cells underwent extensive apoptosis, as shown by TdT labeling over a 48-h period of glucose deprivation (Fig. 2B). These observations uncover a glucose-dependent pathway that is activated by c-Myc.
Figure 1.
Cell cycle distribution and BrdUrd incorporation characteristics of Rat1a, Rat1a-LDH-A, Rat1a-Myc, and Rat1a-Myc-Bcl-2 cells. Two-dimensional flow cytometric distributions of DNA content stained by propidium iodide (abscissa) and BrdUrd labeling (ordinate) are shown for each cell line cultured for 20 h in the presence (Upper) or absence (Lower) of glucose. Distributions of nuclei in each compartment (G0/G1, S, or G2/M phases) were estimated by curve fitting and are shown below. (Lower) Numbers in parentheses for the S phase indicate the percentage of BrdUrd-labeled cells. (Upper) The percentage of cells in S phase and those labeled with BrdUrd were equal.
Figure 2.
(A) Glucose-deprivatio-induced apoptotic cell death of c-Myc- or LDH-A-overexpressing cells. Rat1a, Rat1a-LDH-A, Rat1a-Myc, and Rat1a-Myc-Bcl-2 cells were cultured for 20 h in the presence (Upper) or absence (Lower) of glucose. Cells were harvested, and DNA strand breaks were labeled with biotin-dUTP by using TdT and then stained with propidium iodide. DNA content determined by propidium iodide staining is shown on the abscissa and DNA strand breaks content is shown on the ordinate. The numbers below indicate the percentage of cells that were apoptotic and labeled with biotin-dUTP. (B) Time course of glucose-deprivation-induced apoptotic death of Rat1a-Myc and Rat1a-LDH-A cells as compared with Rat1a and Rat1a-Myc-Bcl-2 cells. (C) Time course of serum-deprivation-induced apoptotic death of Rat1a-Myc cells as compared with Rat1a-LDH-A and Rat1a cells.
Overexpression of LDH-A Sensitizes Rat Fibroblasts to Glucose Deprivation-Induced Apoptosis.
Because LDH-A is intimately linked to glucose metabolism and its expression is enforced by c-Myc (13), we investigated whether LDH-A overexpression may underlie the ability of glucose deprivation to induce apoptosis in c-Myc-transformed cells. We studied the effects of glucose deprivation in stably transfected Rat1a cells that overexpress LDH-A (Rat1a-LDH-A) (13). Withdrawal of glucose was associated with a dramatic 85% reduction in BrdUrd-positive cells in S phase (Fig. 1). Of the S phase cells, 63% did not incorporate BrdUrd, indicating that these cells were apoptotic. It is notable, however, that overexpression of LDH-A caused a different cell cycle profile than the profile seen when c-Myc is overexpressed, suggesting that these cells have different phenotypes. Glucose-deprived Rat1a cells ectopically expressing LDH-A, similar to c-Myc overexpressing cells, displayed a significant extent of apoptotic cell death with the TdT end-labeling assay (Fig. 2). We also determined whether LDH-A overexpression contributed to the apoptotic cell death of serum-starved Myc-transformed fibroblasts (Fig. 2C). With serum withdrawal, 48% of Rat1a-Myc cells showed apoptosis, whereas Rat1a-LDH-A cells growth-arrested with only 5% apoptotic cell death over a 48-h period. We have overexpressed another putative c-Myc target gene, rcl, as described (25) to determine whether sensitivity to glucose is specific for fibroblasts expressing c-Myc or LDH-A. Although the Rat1a-Rcl cells displayed only 4% cell death with 20 h of glucose deprivation, 18% of the Rat1a-LDH-A cells died. Coexpression of Rcl in LDH-A-overexpressing cells did not significantly alter the extent of apoptotic death, resulting in 21% cell death with a 20-h period of glucose deprivation. These observations indicate that induction of apoptosis by glucose deprivation and serum deprivation are initiated from different pathways and that LDH-A links c-Myc to glucose-dependent apoptosis.
Glucose Deprivation-Induced Apoptosis Is Blocked by Bcl-2 but Independent of Wild-Type p53 Activity.
The product of the bcl-2 gene protects cells from apoptosis induced by a variety of stimuli. To determine whether Bcl-2 also impacted upon this glucose-dependent pathway, we used Rat1a-Myc cells that overexpressed Bcl-2 as described (21). Glucose deprivation of these cells resulted in an S phase population in which 83% of cells incorporated BrdUrd, similar to the 88% noted in Rat1a cells (Fig. 1). TdT end-labeling assay (Fig. 2) confirmed that there was no significant apoptotic cell fraction and, therefore, that Bcl-2 blocks apoptosis induced through this pathway.
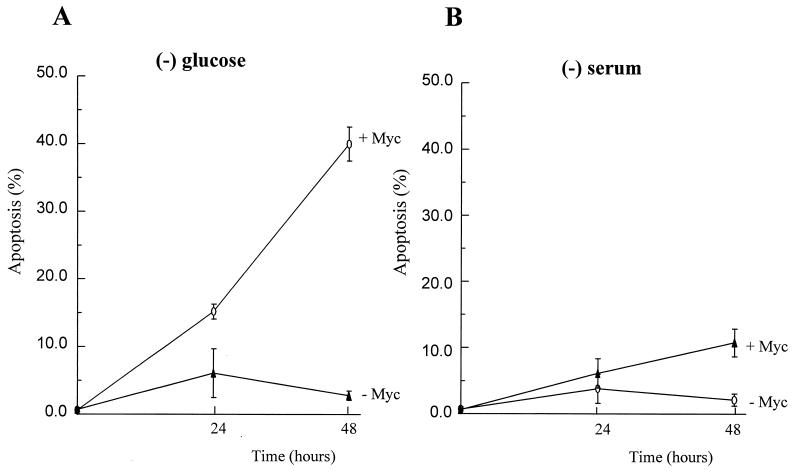
Because p53 is reported to mediate apoptosis in c-Myc-transformed cells deprived of serum (8, 10), we examined whether wild-type p53 is required for glucose-deprivation-induced apoptosis in c-Myc-overexpressing cells. (10.1)Val-Myc, a mouse BALB/c 3T3 fibroblast line that overexpresses c-Myc and has a temperature-sensitive p53 allele (26), was cultured at a nonpermissive temperature and subjected to either glucose deprivation or serum deprivation to determine whether the apoptosis caused by glucose deprivation is dependent on p53 activity. As shown in Fig. 3, glucose deprivation caused apoptosis in (10.1)Val5-Myc cells, and serum withdrawal had a diminished apoptotic effect over a 48-h period. These observations imply that the apoptosis of c-Myc-overexpressing cells caused by glucose deprivation is independent of wild-type p53 activity.
Figure 3.
Myc-mediated apoptosis caused by glucose deprivation appears to be independent of wild-type p53 activity. (A) A mouse embryo fibroblast cell line, (10.1)Val5-Myc (+Myc) that overexpresses c-Myc and lacks the wild-type p53 function at 39°C, underwent more extensive apoptosis caused by glucose deprivation when compared with (10.1)Val5 cells (−Myc) that do not overexpress murine c-Myc. (B) Mouse fibroblast cells were grown in DMEM with 10% FBS and deprived of serum (0.1% FBS) for 24 or 48 h before flow cytometric analysis for apoptosis.
The Glycolytic Inhibitor 2-Deoxyglucose (2-DG) Induces Apoptosis in c-Myc-Transformed Cells.
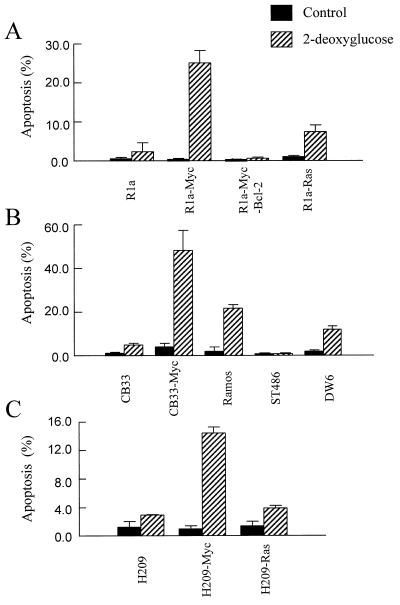
Because glucose deprivation is able to selectively induce apoptosis of c-Myc-transformed cells, we used the glucose antagonist 2-DG to determine whether inhibition of glycolysis was able to induce apoptosis of c-Myc-transformed cells. 2-DG is thought to inhibit glycolysis via competitive inhibition after it is phosphorylated by hexokinase (27). Fig. 4A shows that 2-DG differentially induced apoptosis of Rat1a-Myc cells versus nontransformed Rat1a cells. Bcl-2 coexpression blocked the ability of 2-DG to induce apoptosis of c-Myc-transformed cells. Interestingly, Rat1a cells transformed by Ras (Rat1a-Ras) did not contain a significant apoptotic population after 2-DG treatment, unlike the Rat1a-Myc cells, indicating that this process was indeed due to c-Myc activity and not part of the process of transformation.
Figure 4.
The glycolysis inhibitor 2-DG induces apoptosis in c-Myc-overexpressing cells. (A) Rat fibroblasts exposed to 10 mM 2-DG for 1 day were harvested for flow cytometric analysis of apoptosis. (B) Various lymphoid cells were exposed to 10 mM 2-DG for 1 day before they were fixed for analysis of apoptosis. (C) Human small cell lung cancer cells were treated with 10 mM 2-DG for 1 day before subjected to the apoptosis assay.
To determine whether 2-DG induced apoptosis is cell-type specific, we expanded the 2-DG treatment to nonfibroblast human cells overexpressing c-Myc. Nontransformed CB33 lymphoblastoid cells, those transformed by c-Myc (CB33-Myc), and three Burkitt lymphoma cell lines with c-myc chromosomal translocations (Ramos, ST486, and DW6 cell lines) were studied. The c-Myc-transformed lymphoblastoid and Burkitt lymphoma cell lines all have elevated c-Myc protein expression that is associated with elevations in LDH-A levels compared with the nontransformed lymphoblastoid CB33 cells (13). Studies of the effects of 2-DG on these lymphoid cells showed that only the CB33-Myc, Ramos, and DW6 cell lines, but not ST486, displayed apoptosis (Fig. 4B). Although ST486 cells have elevated Myc expression, they also overexpress Bcl-2 (13), which may block the apoptosis caused by 2-DG. The Ramos Burkitt lymphoma cell line, which contains a mutant p53 (28), displayed apoptosis with 2-DG treatment (Fig. 4B). This combined with data shown in Fig. 3 suggests that the apoptosis of c-Myc-overexpressing cells caused by glucose deprivation is independent of wild-type p53 activity.
The human NCI H209 small cell lung cancer cells (29) are also sensitized to 2-DG by overexpression of c-Myc. c-Myc overexpression elevates LDH enzyme activity by 30% in H209 cells (data not shown) and sensitizes the H209 cells to 2-DG-induced apoptosis to a greater extent than Ras overexpression in the same cell type (Fig. 4C).
To determine whether the differential effect of 2-DG on c-Myc-overexpressing cells was caused by differences in 2-DG uptake, the uptake rate of [1-14C]2-DG was measured in CB33-Myc cells compared with CB33 cells. CB33-Myc cells took up [1-14C]-2-DG only 30% higher than CB33 cells (data not shown), whereas 2-DG induced 8-fold more apoptosis in CB33-Myc compared with CB33 cells. Thus, the differences in 2-DG uptake do not account for the differential effect of 2-DG on c-Myc-overexpressing cells. These observations suggest that overexpression of c-Myc causes cells, when exposed to 2-DG, to undergo apoptotic cell death that is independent of wild-type p53 function and is suppressed by the overexpression of Bcl-2.
DISCUSSION
The growth of neoplastic cells in spheroid clusters is limited by the diffusion of oxygen, glucose, and other nutrients into the tumor mass (19, 30, 31). We have observed (13) that the induction of LDH-A by c-Myc is advantageous to transformed cells that exist under hypoxic conditions. In this report, however, we observe that glucose deprivation induces extensive apoptosis of fibroblasts, lymphoblastoid, or lung carcinoma cells that overexpress c-Myc. Overexpression of LDH-A alone in rat fibroblasts is sufficient to sensitize cells to this glucose-deprivation-induced apoptosis. This observation supports the hypothesis that LDH-A is a downstream target of c-Myc that mediates this unique apoptotic phenotype.
The connection between LDH-A overexpression, glucose deprivation, and the common pathway leading to apoptotic cell death remains to be elucidated. We speculate, however, that constitutive generation of NAD+ and lactate by LDH-A and the decrease in the regeneration of NADH by inhibition of glycolysis alter the redox state in the cells, which then triggers the final apoptotic pathway (32). Glucose and oxygen are potent regulators of glycolytic enzyme gene transcripts (33). Therefore, genetic alterations in cancer other than activation of c-Myc are expected to augment LDH-A and other glycolytic enzyme transcripts. These other genetic alterations are also expected to sensitize transformed cells to glucose deprivation. Glucose is able to stimulate transcription of genes encoding glycolytic and lipogenic enzymes in adipocytes and hepatocytes through the carbohydrate response element (ChoRE), a CACGTG motif (34–37). Intriguingly, the ChoRE motif has the same sequence as the core binding site for c-Myc. Likewise, hypoxia induces the transcription of glycolytic enzymes through the hypoxia-inducible factor HIF-1, which binds to sequences resembling the Myc E-box CACGTG (38, 39). Therefore, we hypothesize the existence of a direct connection between deregulated c-Myc expression, acting through LDH-A, and aerobic glycolysis, which in turn contribute to transformation.
Our observation that glucose is required for nontransformed cells to progress through the G1–S boundary has been observed with 3T3 fibroblasts (40). Furthermore, Saccharomyces cerevisiae growth-arrested before the START point when deprived of glucose (14). Extensive depletion of ATP per se through mitochondrial uncoupling also arrests mammalian cells in G1 and G2 phases (41). Our results and previous studies suggest that there exist regulatory points in the cell cycle that are sensitive to glucose deprivation (16, 42).
The glucose-dependent apoptotic pathway described herein is suppressed by Bcl-2 but appears to be independent of p53 status. As such, the therapeutic implications of our observations must take into consideration the status of the Bcl-2 family of proteins in tumors. Studies performed almost four decades ago indicate that infusions of 2-DG into cancer patients were well tolerated (43). In leukemic patients, the white cell count fell during the 24-h period after a single 2-DG infusion and glycolysis was lowered in the leukemic cells. With the available modern molecular probes, cancer cells may be characterized with regard to their molecular markers, including their Bcl-2/Bcl-XL and status. On the basis of the data described herein, 2-DG should be effective in activating apoptosis in Bcl-2/Bcl-XL-negative neoplasms with high c-Myc or LDH-A levels through this glucose-dependent pathway. It may, therefore, prove to be valuable in the therapy of such neoplasms in the future.
Acknowledgments
We thank L. Barr for the H209 cells, I. Magrath for the Burkitt cells, and A. Levine for (10.1)Val5-Myc cells. We also thank R. Orlowski for critically reviewing the manuscript. This work was supported in part by National Institutes of Health grants and the Wilbur–Rogers Foundation. H.S. is a fellow of the Lymphoma Research Foundation of America. C.V.D. is a Scholar of the Leukemia Society of America. B.C.L is a Howard Hughes Predoctoral Fellow.
Footnotes
This paper was submitted directly (Track II) to the Proceedings Office.
Abbreviations: FBS, fetal bovine serum; BrdUrd, bromodeoxyuridine; TdT, terminal deoxynucleotidyltransferase; 2-DG, 2-deoxyglucose.
References
- 1.Cole M D. Annu Rev Genet. 1986;20:361–384. doi: 10.1146/annurev.ge.20.120186.002045. [DOI] [PubMed] [Google Scholar]
- 2.Dalla-Favera R, Bregni M, Erikson J, Patherson D, Gallo R C, Croce C M. Proc Natl Acad Sci USA. 1982;79:7824–7827. doi: 10.1073/pnas.79.24.7824. [DOI] [PMC free article] [PubMed] [Google Scholar]
- 3.Dang C V, Lee L A. c-Myc Function in Neoplasia. Austin, TX: Landes; 1995. [Google Scholar]
- 4.Eilers M, Picard D, Yamamoto K R, Bishop J M. Nature (London) 1989;340:66–68. doi: 10.1038/340066a0. [DOI] [PubMed] [Google Scholar]
- 5.Eilers M, Schirm S, Bishop J M. EMBO J. 1991;10:133–141. doi: 10.1002/j.1460-2075.1991.tb07929.x. [DOI] [PMC free article] [PubMed] [Google Scholar]
- 6.Evan G I, Wyllie A H, Gilbert C S, Littlewood T D, Land H, Brooks M, Waters C M, Penn L Z, Hancock D C. Cell. 1992;69:119–128. doi: 10.1016/0092-8674(92)90123-t. [DOI] [PubMed] [Google Scholar]
- 7.Harrington E A, Bennett M R, Fanidi A, Evan G I. EMBO J. 1994;13:3286–3295. doi: 10.1002/j.1460-2075.1994.tb06630.x. [DOI] [PMC free article] [PubMed] [Google Scholar]
- 8.Hermeking H, Eick D. Science. 1994;265:2091–2093. doi: 10.1126/science.8091232. [DOI] [PubMed] [Google Scholar]
- 9.Packham G, Cleveland J L. Biochim Biophys Acta. 1995;1242:11–28. doi: 10.1016/0304-419x(94)00015-t. [DOI] [PubMed] [Google Scholar]
- 10.Wagner A J, Kokontis J M, Hay N. Genes Dev. 1994;8:2817–2830. doi: 10.1101/gad.8.23.2817. [DOI] [PubMed] [Google Scholar]
- 11.White E. Genes Dev. 1996;10:1–15. doi: 10.1101/gad.10.1.1. [DOI] [PubMed] [Google Scholar]
- 12.Kauffmann-Zeh A, Rodriguez-Viciana P, Ulrich E, Gilbert C, Coffer P, Downward J, Evan G. Nature (London) 1997;385:544–547. doi: 10.1038/385544a0. [DOI] [PubMed] [Google Scholar]
- 13.Shim H, Dolde C, Lewis B C, Wu C S, Dang G, Jungmann R A, Dalla-Favera R, Dang C V. Proc Natl Acad Sci USA. 1997;94:6658–6663. doi: 10.1073/pnas.94.13.6658. [DOI] [PMC free article] [PubMed] [Google Scholar]
- 14.Gilles R J, Ugurbil K, den Hollander J A, G. S R. Proc Natl Acad Sci USA. 1981;78:2125–2129. doi: 10.1073/pnas.78.4.2125. [DOI] [PMC free article] [PubMed] [Google Scholar]
- 15.Pardee A B. Annu Rev Biochem. 1978;47:715–750. doi: 10.1146/annurev.bi.47.070178.003435. [DOI] [PubMed] [Google Scholar]
- 16.Greiner E F, Guppy M, Brand K. J Biol Chem. 1994;269:31484–31490. [PubMed] [Google Scholar]
- 17.Warburg O, Posener K, Negelein E. Biochem Z. 1924;152:309–344. [Google Scholar]
- 18.Crabtree H D. Biochem J. 1929;23:536–545. doi: 10.1042/bj0230536. [DOI] [PMC free article] [PubMed] [Google Scholar]
- 19.Sutherland R M, Sordat B, Bamat J, Gabbert H, Bourrat B, Mueller-Klieser W. Cancer Res. 1986;46:5320–5329. [PubMed] [Google Scholar]
- 20.Matrisian L M, Rautmann G, Magun B E, Breathnach R. Nucleic Acids Res. 1985;13:711–726. doi: 10.1093/nar/13.3.711. [DOI] [PMC free article] [PubMed] [Google Scholar]
- 21.Hoang A T, Cohen K J, Barrett J F, Bergstrom D A, Dang C V. Proc Natl Acad Sci USA. 1994;91:6875–6879. doi: 10.1073/pnas.91.15.6875. [DOI] [PMC free article] [PubMed] [Google Scholar]
- 22.Abraha A, Shim H, Wehrle J P, Glickson J D. NMR Biomed. 1996;9:173–178. doi: 10.1002/(SICI)1099-1492(199606)9:4<173::AID-NBM402>3.0.CO;2-J. [DOI] [PubMed] [Google Scholar]
- 23.Schutte B, Reynders M M J, van Assche C L M V J, Hupperts P S G J, Bosman F T, Blijham G H. Cytometry. 1987;8:372–376. doi: 10.1002/cyto.990080405. [DOI] [PubMed] [Google Scholar]
- 24.Gorczyca W, Gong J, Darzynkiewicz Z. Cancer Res. 1993;53:1945–1951. [PubMed] [Google Scholar]
- 25.Lewis B C, Shim H, Li Q, Wu C S, Lee L A, Maity A, Dang C V. Mol Cell Biol. 1997;17:4967–4978. doi: 10.1128/mcb.17.9.4967. [DOI] [PMC free article] [PubMed] [Google Scholar]
- 26.Chen J, Wu X, Lin J, Levine A J. Mol Cell Biol. 1996;16:2445–2452. doi: 10.1128/mcb.16.5.2445. [DOI] [PMC free article] [PubMed] [Google Scholar]
- 27.Kaplan O, Navon G, Lyon R C, Faustino P J, Straka E J, Cohen J S. Cancer Res. 1990;50:544–551. [PubMed] [Google Scholar]
- 28.Gaidano G, Ballerini P, Gong J Z, Inghirami G, Neri A, Newcomb E W, Magrath I T, Knowles D M, Dalla-Favera R. Proc Natl Acad Sci USA. 1991;88:5213–5417. doi: 10.1073/pnas.88.12.5413. [DOI] [PMC free article] [PubMed] [Google Scholar]
- 29.Barr L F, Campbell S E, Penno M B, Ball D W, Baylin S B. Cell Growth Differ. 1996;7:1149–1156. [PubMed] [Google Scholar]
- 30.Casciari J J, Sotirchos S V, Sutherland R M. Cancer Res. 1988;48:3905–3909. [PubMed] [Google Scholar]
- 31.Hemlinger G, Yuan F, Dellian M, Jain R K. Nat Med. 1997;3:177–182. doi: 10.1038/nm0297-177. [DOI] [PubMed] [Google Scholar]
- 32.Hockenbery D M, Oltvai Z N, Yin X M, Milliman C L, Korsmeyer S J. Cell. 1993;75:241–251. doi: 10.1016/0092-8674(93)80066-n. [DOI] [PubMed] [Google Scholar]
- 33.Dang C V, Lewis B C, Dolde C, Dang G, Shim H. J Bioenerg Biomembr. 1997;29:345–354. doi: 10.1023/a:1022446730452. [DOI] [PubMed] [Google Scholar]
- 34.Jacoby D B, Zilz N D, Towle H C. J Biol Chem. 1989;264:17623–17626. [PubMed] [Google Scholar]
- 35.Foufelle F, Gouhot B, Pegorier J P, Perdereau D, Girard J, Ferre P. J Biol Chem. 1992;267:20543–20546. [PubMed] [Google Scholar]
- 36.Thompson K S, Towle H C. J Biol Chem. 1991;266:8679–8682. [PubMed] [Google Scholar]
- 37.Lefrancois-Martinez A M, Diaz-Guerra M J, Vallet V, Kahn A, Antoine B. FASEB J. 1994;8:89–96. doi: 10.1096/fasebj.8.1.8299894. [DOI] [PubMed] [Google Scholar]
- 38.Semenza G L, Roth P H, Fang H M, Wang G L. J Biol Chem. 1994;269:23757–23763. [PubMed] [Google Scholar]
- 39.Semenza G L, Jiang B H, Leung S W, Passantino R, Concordet J P, Maire P, Giallongo A. J Biol Chem. 1996;271:32529–32537. doi: 10.1074/jbc.271.51.32529. [DOI] [PubMed] [Google Scholar]
- 40.Holley R W, Kiernan J A. Proc Natl Acad Sci USA. 1974;71:2942–2945. doi: 10.1073/pnas.71.8.2942. [DOI] [PMC free article] [PubMed] [Google Scholar]
- 41.Sweet S, Singh G. Cancer Res. 1995;55:5164–5167. [PubMed] [Google Scholar]
- 42.Pardee A B. Proc Natl Acad Sci USA. 1974;71:1286–1290. doi: 10.1073/pnas.71.4.1286. [DOI] [PMC free article] [PubMed] [Google Scholar]
- 43.Landau B R, Laszlo J, Stengle J, Burk D. J Natl Cancer Inst. 1958;21:485–494. [PubMed] [Google Scholar]


