

Abstract
Thirty patients with chronic schizophrenia and 30 age-matched controls performed the Attention Network Test (ANT). A subset of the patient group (n=18) also had available magnetic resonance diffusion tensor imaging (DTI) measures of the cingulum bundle (CB) fractional anisotropy and volume. The patients showed a significantly different pattern of ANT performance, characterized primarily by decreased alerting efficiency. In addition, left CB fractional anisotropy correlated significantly with orienting of attention. Smaller right CB volume also correlated with reduced alertness, but not when covarying for medication and illness duration.
Keywords: Schizophrenia, Attention, Cingulum Bundle
ATTENTIONAL NETWORKS AND CINGULUM BUNDLE IN CHRONIC SCHIZOPHRENIA
Over a century ago, William James emphasized selection, whether of a train of thought, a particular location, or a specific object, as the common feature of his aptly coined ‘varieties of attention’ (James, 1890; Parasuraman, 1998; Rees, Frackowiak, & Frith, 1997). Later, echoing James, Kraepelin (1919) described the rich and varied phenomenology of attentional disturbances in schizophrenia. Subsequent studies, including behavioral, neuropsychological, neurophysiological, and functional imaging, have underscored attentional deficits as a core characteristic of the cognitive disturbance of schizophrenia (Nestor & O’Donnell, 1998).
The current study applied a cognitive neuroscience model to examine the functional neuroanatomy of attention in patients with chronic schizophrenia. Attention is defined here as reflecting the efficiency of three anatomically-distinct, hierarchically-organized networks --- alerting, orienting, and executive control, which are widely distributed across frontal, parietal and thalamic sites (Posner & Peterson, 1990; Callejas, Lupianez, Funes, & Tudela, 2005). Such efficiency may depend in part on the integrity of a key white matter tract, the cingulum bundle (CB), which connects the anterior cingulate cortex to other frontal sites as well as to the amygdala, nucleus accumbens, and medial dorsal thalamus (Goldman-Rakic, Selemon, & Schwartz, 1984; Pandya & Seltzer, 1982; Vogt, Rosene, & Pandya 1979). For patients with schizophrenia, disturbances in the circuitry of the anterior cingulate cortex, including the CB, have been linked to deficits in attentional functioning (Carter, Mintun, Nichols, & Cohen, 1997; Fletcher, McKenna, Friston, Frith, & Dolan, 1999; Nestor et al., 2004).
In this study, we combined the Attention Network Test (ANT) (Fan et al., 2002) with magnetic resonance diffusion tensor imaging (DTI) studies of the CB in patients with chronic schizophrenia. The ANT provides within the same behavioral paradigm independent measures of alerting, orienting, and executive control. DTI provides the capacity, beyond conventional magnetic resonance, to quantify the coherence, integrity, or connectivity of specific white matter pathways that functionally unite widely distributed networks of brain regions (Basser, Mattiello, & LeBihan, 1994; Basser & Pierpaoli, 1996; Papadakis et al., 1999). As such, we focused on the relationship of the CB and ANT performance in schizophrenia.
METHOD
Subjects
All subjects (N=60) were male between the ages of 17 and 55 years, right-handed, native speakers of English, without histories of electro-convulsive therapy (ECT), neurological illness, and without alcohol or drug abuse in the past 5 years, as assessed by the Addiction Severity Index (McClellan et al., 1992). Diagnoses were ascertained by the Structured Clinical Interview for DSM-IV Axis I Disorders-Patient Edition (SCID-P; First et al., 1997), along with chart review. All patients (n=30) were part of an ongoing comprehensive, longitudinal study of schizophrenia and all were receiving neuroleptic medication; the mean chlorpromazine equivalent daily dose was 381.04 mg (SD=304.27) (Stoll, 2001). Mean age was 38.72 years (SD=10.25) and mean duration of illness was 14.67 years (SD=8.51). Eighteen of the 30 subjects also had available diffusion tensor imaging (DTI) magnetic resonance of the CB (Kubicki et al., 2005).
Healthy comparison participants (n=30) were recruited from newspaper advertisements. They had a mean age of 42.71 years (SD=7.39), and completed the Structured Clinical Interview for DSM-IV Axis I Disorders-Nonpatient Edition (SCID-NP; First, Spitzer, Gibbon, & Williams, 1997). Patients and healthy participants did not differ significantly on age, sex, handedness, and parents’ socioeconomic status. Mean education was 12.69 years (SD=2.02) for the patient group, and 15.36 (SD=1.75) for the control group (p<.01). After the study had been described to them, all of the participants provided written informed consent. Thirty patients and 30 controls completed the ANT. For patients and controls, neuropsychological test scores were available on the Wechsler Adult Intelligence Scale-Third Edition (WAIS-III; Wechsler, 1997), Wechsler Memory Scale-Third Edition (WMS-III; Tulsky, Zhu, & Ledbetter, 1997; Wechsler, 1997) and Wisconsin Card Sorting Test (WCST; Heaton, 1981). The patient group performed more poorly than did the controls across measures of WAIS-III intelligence, WMS-III memory and WCST executive functions (see Table 1).
Table 1.
Neuropsychological Summary Scores for Patients with Schizophrenia and Control Participants.
| Variable | Patients | Controls |
|---|---|---|
| Demographic Information | ||
| Age (years) | 39.11 ± 10.30 | 41.27 ± 8.59 |
| Education (years) | 13.21 ± 2.11 | 14.86 ± 1.91 |
| SES | 3.48 ± 1.21 | 2.28 ± 0.99 |
| Parents’ SES | 2.88 ± 1.01 | 2.47 ± 1.14 |
| WAIS-III IQ | ||
| Full Scale | 94.55 ± 13.81 | 107.48 ± 15.50 |
| Verbal | 97.45 ± 14.61 | 106.52 ± 13.34 |
| Performance | 91.55 ± 12.69 | 107.28 ± 17.55 |
| WAIS-III Index | ||
| Verbal Comprehension | 101.66 ± 15.36 | 106.00 ± 13.68 |
| Perceptual Organization | 96.72 ± 14.97 | 108.32 ± 16.41 |
| Working Memory | 95.66 ± 13.28 | 107.31 ± 15.77 |
| eProcessing Speed | 86.00 ± 15.18 | 105.83 ± 15.84 |
| WMS-III Memory Quotient | ||
| Immediate Memory | 87.11 ± 13.20 | 103.21 ± 15.57 |
| General Memory | 88.71 ± 11.30 | 104.63 ± 13.90 |
| WMS-III Index | ||
| Auditory Immediate | 92.75 ± 13.75 | 103.93 ± 16.07 |
| Visual Immediate | 85.64 ± 12.09 | 100.39 ± 13.78 |
| Auditory Delayed | 96.79 ± 15.22 | 106.74 ± 13.35 |
| Visual Delayed | 86.50 ± 13.10 | 101.81 ± 14.88 |
| Working Memory | 100.11 ± 12.88 | 107.7 ± 24.00 |
| WCST | ||
| Categories Completed | 3.73 ± 2.36 | 5.25 ± 1.43 |
| Perseverative Errors | 22.54 ± 19.30 | 11.64 ± 7.74 |
| Nonperseverative Errors | 18.38 ± 12.25 | 14.46 ± 14.71 |
Note. Values are means plus or minus standard deviations. SES = socioeconomic status; WAIS-III = Weschler Adult Intelligence Scale-Third Edition; WMS-III = Weschler Memory Scale-Third Edition; WCST = Wisconsin Card Sorting Test.
Attention Network Test: Stimuli, Procedures, and Measures
The stimuli and procedures for the ANT followed those outlined by Fan et al. (2002). An IBM microcomputer controlled stimulus displays and recorded responses. Stimuli were presented on a computer monitor (ViewSonic Professional Series PT771). Participants viewed the screen from a distance of 65 cm, and responses were collected via two input keys on a keyboard that rested on their laps. Stimuli consisted of a row of five visually presented horizontal black lines, with arrowheads pointing leftward or rightward against a gray background. The central target, a leftward or rightward arrowhead, was flanked by two arrows on each side, these four target flankers all pointed either in the same direction as the central target (congruent condition) or in the opposite direction as the central target (incongruent condition). For the neutral condition, horizontal lines instead of arrows flanked the central target, two horizontal lines on each side of the target. Subjects responded to the direction of the centrally presented target by pressing one key for the left direction and a different key for the right direction. A single arrow or line consisted of .55 degree of visual angle and the contours of adjacent arrows or lines were separated by 0.06 degree of visual angle. The stimuli (one central arrow plus 2 left flankers, 2 right flankers) consisted of a total 3.8 degree visual angle.
Subjects first fixated on a central cross of random variable duration (400–1600 ms), and then a warning cue for 100 ms. Following a short fixation period of 400 ms after the warning cue, the target and flankers appeared simultaneously. The target and flankers remained on until a response was made, but for no longer than 1700 ms, followed by an inter-trial interval of variable duration based on the duration of the first fixation and RT (3500 ms minus duration of first fixation minus RT). After this interval, the next trial began. Each trial lasted 4000 ms. The fixation cross appeared at the center of the screen during the whole trial. The row of five stimuli, presented either 1.06 degree above or below the fixation point, was preceded be one of four different warning conditions: no cue, center cue, double cue, and spatial cue. For the no-cue trials, subjects saw only a fixation cross for 100 ms. For the center-cue trials, subjects saw an asterisk at the location of fixation cross for 100 ms. For the double-cue trials, subjects saw two warning cues corresponding to the two possible target positions --- up and down. For the spatial-cue trials, the cue, always valid, appeared at the exact location of the subsequent target.
Alertness was calculated by subtracting the mean RT of the double-cue conditions from the mean RT of the no-cue condition; orienting by subtracting the mean RT of the spatial cue conditions from the mean RT of the center cue; and executive by subtracting the mean RT of all congruent flanking conditions, summed across cue types, from the mean RT of incongruent flanking conditions, summed across cue types. Following Wang et al. (2005), ratio measures of alerting, orienting, and executive control were calculated by dividing each by overall mean ANT RT.
DTI: Acquisition and Measures
For all the available subjects, DTI data were acquired on a 1.5 Tesla GE Echospeed system (General Electric Medical Systems, Milwaukee, WI), with a quadrature head coil, using line scan diffusion imaging (LSDI), and the acquisition protocol described previously (Kubicki et al., 2002; 2003; 2005). Coronal oblique 1.7 × 1.7 × 4 mm slices were acquired perpendicular to the AC-PC line, and analyzed using in-house software (slicer.org). After tensor reconstruction, which involved eddy current distortion correction, as well as movement correction, maps of eigenvectors, eigenvalues, and fractional anisotropy (FA) were calculated. ROI definition method was described in detail in Kubicki et al., 2003. Briefly, directional diffusion maps were generated using in-house software (www.slicer.org). Since cingulum bundle, on its extent above the corpus callosum runs perpendicular to the coronal plane (DTI acquisition plane), the structure can be identified on the out-of-plane diffusion tensor component map. Several points (one for each slice) were seeded within the CB, and a surface evolution automated segmentation method (levelsets) (Krissan et al., 2003), was used to detect contours of the structure based on the directional diffusion differences between white matter tract and surrounding brain tissue. These contours were used as ROIs, which were then overlaid on Fractional Anisotropy maps and slices including genu and splenium of the corpus callosum were manually excluded. Mean FA and CB volume were then calculated separately for left and right cingulum bundle (see figure 1).
Figure 1.
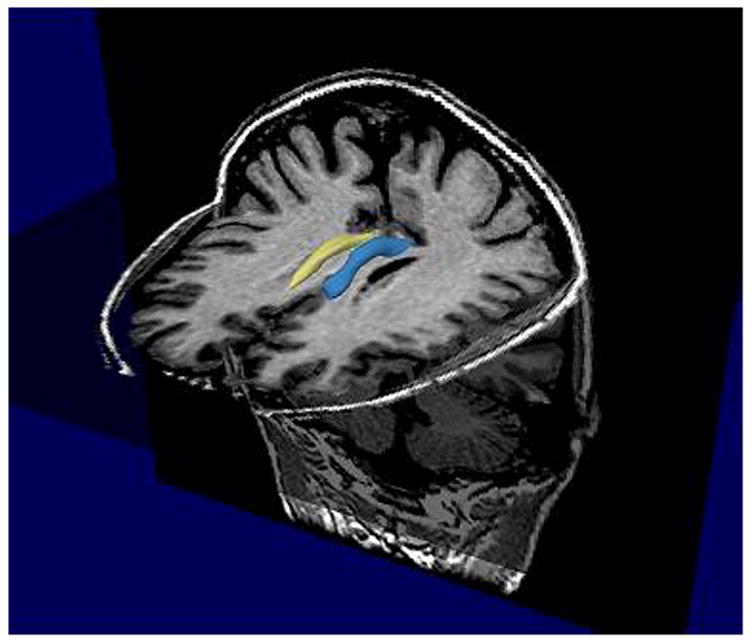
3D model of Cingulum Bundle ROIs (blue-left, yellow-right).
RESULTS
As shown in Table 2, the RT analysis revealed significantly slower overall responses times for patients than for controls, F (1, 58) = 12.33, p=.001. However, group differences in overall accuracy approached but did not reach significance F (1, 58) = 2.99, p=.09. In addition, both patients and controls showed a similar pattern of accuracy across cue and flanker conditions, as reflected by the absence of significant interaction of either of these factors with group.
Table 2.
Reaction and Accuracy as a Function of Experiment Condition for Patient and Control Groups
| Patients | Controls | |||
|---|---|---|---|---|
| Reaction Time | Accuracy | Reaction Time | Accuracy | |
| Congruent | ||||
| No cue | 737.30 ± 165.56 | 93.69 + 13.05 | 611.40 + 89.19 | 99.43 + 1.43 |
| Center Cue | 726.73 ± 172.04 | 93.31 + 15.22 | 589.57 + 95.79 | 99.13 + 2.27 |
| Double Cue | 715.33 ± 188.85 | 94.42 + 14.53 | 561.80 + 75.77 | 99.29 + 1.56 |
| Spatial Cue | 658.40 ± 184.83 | 94.31 + 12.43 | 540.40 + 85.83 | 99.71 + 1.05 |
| Incongruent | ||||
| No cue | 846.67 ± 185.73 | 88.54 + 24.28 | 742.83 + 97.13 | 95.25 + 6.12 |
| Center Cue | 857.13 ± 198.05 | 86.04 + 24.63 | 744.73 + 105.70 | 95.21 + 6.28 |
| Double Cue | 834.60 ± 198.43 | 85.84 + 25.95 | 724.83 + 106.91 | 95.07 + 6.40 |
| Spatial Cue | 755.27 ± 178.16 | 86.35 + 25.99 | 666.93 + 110.18 | 95.04 + 7.33 |
| Neutral | ||||
| No cue | 723.63 ± 162.26 | 91.85 + 14.95 | 596.80 + 82.15 | 98.86 + 2.39 |
| Center Cue | 724.93 ± 209.11 | 92.38 + 17.51 | 572.33 + 76.55 | 98.86 + 2.63 |
| Double Cue | 702.30 ± 177.33 | 91.88 + 16.59 | 557.93 + 64.44 | 98.71 + 2.45 |
| Spatial Cue | 647.47 ± 190.43 | 94.27 + 14.93 | 522,37 + 69.35 | 99.14 + 2.27 |
(Values: Mean ± Standard Deviation)
Ratio network measures were next submitted to a mixed analysis of variance with group (patients, controls) as a between-subject factor and network score (alerting, orienting, executive control) as a within-subject factor. The group main effect, F (1, 58) = 12.90, p = .001, revealed lower ratio scores across alertness, orienting, and executive control network measures for the patients in comparison to the controls (see Table 3). Most important is that network score interacted significantly with group, F (2,116) = 8.50, p < .001. As shown in Figure 2, the patient group showed a pronounced reduction for alertness, t (58) = 2.25, p < .05, but a very similar level of visual orienting to the control group, nor did the group differ significantly in executive control.
Table 3.
Attention Network scores (in RT and ratio score,) mean RT, and accuracy for patients with schizophrenia and controls.
| Patients | Controls | |||
|---|---|---|---|---|
| Mean | SD | Mean | SD | |
| Alerting (ms) RT | 21 | 37.77 | 37 | 22.38 |
| Ratio | .034 | .051* | .059 | .035 |
| Orienting (ms) RT | 79 | 46.07* | 59 | 30.46 |
| Ratio | .107 | .049 | .096 | .046 |
| Executive (ms) RT | 120 | 56.99 | 144 | 53.63 |
| Ratio | .183 | .132 | .233 | .079 |
| Mean RT (ms) | 730 | 157.87** | 618 | 81.91 |
| Accuracy (%) | 95 | 8.69* | 98 | 2.19 |
p< .05
p< .001
Figure 2.
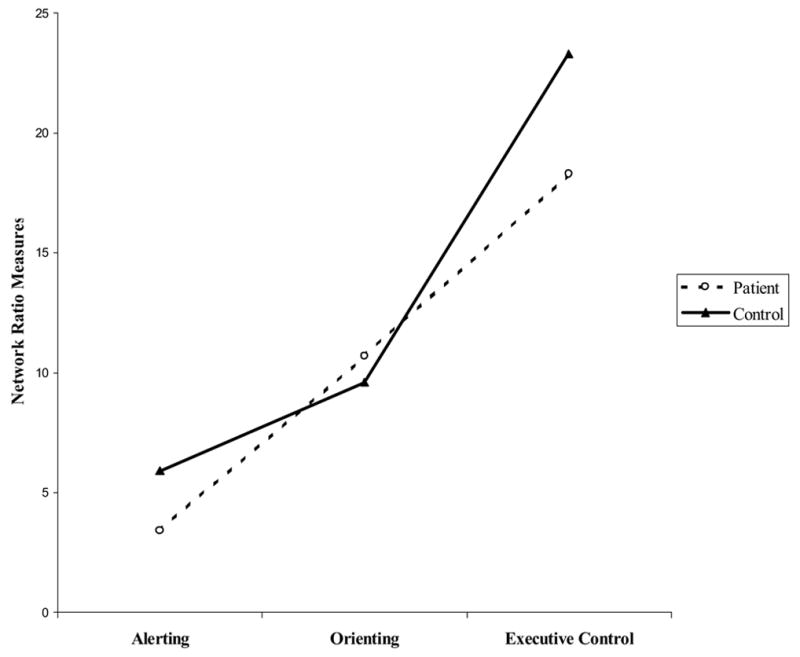
Network Ratio Scores for Patient and Control Groups
To compare group patterns of RT as a function of cue and flanker, we ran an analysis of covariance (covariate: overall RT) with group (patients, controls) as a between-subject factor and cue (no cue, double cue, center cue, spatial cue) and flanker (neutral, congruent, incongruent) as within-subject factors. As expected, both groups responded fastest to targets preceded by spatial cues, F (3,171) = 11.16, p < .001. Of special relevance is that flanker interacted with group, F (2, 114) = 6.27, p < .01. While both groups showed a similar pattern of response times for congruent and neutral trials, they showed different patterns of response times for the comparisons of incongruent and congruent trials, F (1, 57) = 5.92, p<.05, and incongruent and neutral trials, F (1, 57) = 7.51, p<.01. In both instances, in relation to the control group, the patient group, unexpectedly, showed reduced interference (incongruent-congruent) and reduced cost in response times for targets surrounded by incongruent flanker (incongruent-neutral).
Also of note is that while group interacted with cue, F (3, 171) = 2.612, p<.05, collapsing over flanker type did not reveal the source of this significant interaction of cue and group. However, in comparison to controls, the patient group consistently showed slower response times for targets surrounded by neutral flankers regardless as to whether the target was preceded by either a no cue, F (2, 114) = 3.08, p=.05, a double cue, F (2, 114) = 7.34, p = .001, or a center cue, F (2, 114) = 3.31, p=.05, with the notable exception for targets surrounded by neutral flankers preceded by a spatial cue. In other words, the patients showed a disproportionately slowing in RT to targets surrounded by non-informative neutral flankers across three of the four levels of the cue factor --- that is for targets preceded by either no cues, double cues, or center cues, but not for spatially cued-targets.
Spearman rank correlations revealed for the general patient group, lower levels of ANT alertness correlated with longer illness duration rho (27) = −.503, p<.01 and higher medication levels rho (26) = −575, p <.01. Slower overall RT on the ANT for the patient group also correlated with higher medication levels rho (26) = .579, p<.01. For the patient subset, Table 4 shows that slower overall RT on the ANT correlated significantly with lower volume for left, rho (18) = −.709, p=.001, and right, rho (18) = −.779, p<.001, CB. However, only the correlation of slower overall RT on the ANT and right CB volume remained significant when controlling for medication level, as reflected by the partial correlation value of −.572, p<.05 or after controlling for illness duration, as reflected by the partial correlation value of −.582, p<.05. In addition, reduced alerting efficiency correlated significantly with lower right CB volume, rho (18) = .494, p<.05, but this correlation only approached significance after controlling for medication, as reflected by the partial correlation value of .457, p=.075, and was no longer significant when controlling for illness duration (p>.35). Reduced visual orienting correlated significantly with lower left CB fractional anisotropy, rho (18) =.484, p<.05, and this correlation remained significant when controlling for medication level, as reflected by the partial correlation value of .495, p<.05 and for illness duration, as reflected by the partial correlation value of .759, p<.01.
Table 4.
Spearman rank correlations of cingulum bundle and ANT measures for the patient subset.
| Left | Right | |||
|---|---|---|---|---|
| Volume | Fractional Anisotropy | Volume | Fractional Anisotropy | |
| Alertness | .383 | .004 | .494* | .073 |
| Orienting | .191 | .484* | .251 | .412 |
| Executive Control | −.067 | −.028 | .082 | −.005 |
| Overall Reaction Time | −.709** | −.201 | −.779** | −.240 |
p<.05
p<.001
DISCUSSION
The results indicated that the patient group showed a distinct pattern of performance on the ANT, characterized primarily by reduced efficiency in alertness but similar levels to controls for both orienting and executive control. Unlike controls, patients did not respond faster to visual alerting cues signaling the impending appearance of the target arrow. This deficit in alertness is consistent with previous classic information processing studies of schizophrenia (Neale & Oltmanns, 1980; Shakow, 1962) as well as more recent visual cue studies (Nestor et al., 1992).
The alerting network is thought to construct a temporal template or time window for the expected appearance of a target. It provides information as to when the target will appear, which can be combined with information derived from spatial cues signaling where the target will appear, that is, its expected location in space, and what the target is, that is, its identifying stimulus features. Together temporal and spatial attention may help to generate expectancies and to build context. For patients with chronic schizophrenia, for whom failures of contextual processing are paramount, the inefficiencies in temporal attention that are evident by their abnormalities in alerting may hamper their ability to infer the temporal structure of a task, including extracting timing, rhythm, and tempo of the sequence of events
With respect to DTI-ANT correlates in the patient subset, the current results linked the alerting deficit to reductions in DTI-derived volume of the right CB. That is, patients with lower levels of alertness had smaller right CB volumes, suggesting that inefficiencies in alerting may be directly tied to the reduced microstructural integrity of the right CB. In addition, the right CB correlation with overall slowing in RT for the ANT may also reflect a general alerting effect in schizophrenia. Alertness, regardless of stimulus modality, is thought to be subserved by a mostly right-hemisphere frontal, parietal, thalamic, and brainstem network (Sturm & Willmes, 2001). Thus, the right CB correlation with both lower levels of alertness and with overall slower RT in the patient subset would be in keeping with neuropsychological and neuroimaging evidence that has underscored the important contribution of the right hemisphere, including frontal regions, in subserving alertness (Sturm & Willmes, 2001).
Alerting efficiency and right CB volume, each correlated with higher medication dosage and longer illness duration. Less efficient alerting and reduced structural integrity of the right CB may thus be influenced by both current levels of anti-psychotic medication and illness duration. Each of these illness variables may represent the chronicity of the disorder, although current medication dosage is a less precise indicator than is illness duration. By contrast, reduced visual orienting attention to spatial cues correlated significantly with lower fractional anisotropy of the left CB in the patient subset, and unlike the alerting-DTI correlation, neither orienting nor left CB fractional anisotropy correlated significantly with either medication dosage or illness duration. Thus, within the patient subset, better scores on the orienting network measure corresponded to higher fractional anisotropy values, and this association was not complicated by current medication dosage, illness duration, or overall slow response.
The current study focused on the CB, a major white matter tract that that serves to connect the anterior cingulate cortex to widely-distributed and functionally-diverse networks of brain regions. Abnormal anterior cingulate cortex interactions via the CB represent a key element in contemporary connectionist models of neuropsychological disturbance in schizophrenia (e.g., Fletcher et al., 1999). In support of these models are the current findings linking reduced DTI-derived CB measures of presumed connectivity with lower attentional efficiency in schizophrenia: slower overall response times on the ANT as well as lower levels of alertness and visual orienting each correlated with reduced CB connectivity.
Surprisingly, however, the patient group did not differ from the control group in efficiency of the executive control network. This current finding differed from Wang et al. (2005) who found in their sample of Chinese patients with schizophrenia slowing in response to incongruent flanker trials in comparison to congruent flanker trials. Slower response to incongruent trials generally reflects greater interference, and reduced efficiency of the executive network, a characteristic that is typically associated with attentional problems of schizophrenia (see Wang et al., 2005).
However, slower response to conflicting and competing stimuli likely also depends on the extent to which these stimulus incongruities are registered, encoded, detected, or monitored. As modeling studies have suggested, among the many functions of the anterior cingulate is to monitor performance, so as to provide feedback for prefrontal sites for on-line adjustments in control (Botvinick et al., 2001). In the current study, patients may not have shown the expected deficit in executive control because of failures in monitoring the incongruent flanking arrows pointing in direction opposite to that of the target arrow. If such competing stimuli did not fully register, then slowing in RT to incongruent trials would not be expected to be significantly greater for the patients than for the controls. Put simply, monitoring failures in the patient group may have masked executive control deficits. By contrast for the Wang et al patients, who were 10 years younger than the patients of the current study, with an average duration of illness of approximately 5 years compared to approximately 15 years in the current sample, conflict might have been detected, triggering adjustments in executive control, albeit less efficiently than their control subjects.
Monitoring on the ANT may be examined by comparing incongruent and neutral trials. The idea here is that efficient monitoring would be associated with greater slowing, disadvantage, or cost in RT for incongruent trials compared to neutral trials. As expected and consistent with prior research using a visual cue paradigm (Nestor et al., 1992), patients here showed significantly less attentional cost than did controls. This might simply reflect particularly slow responses for the patient group when dealing with stimuli that do not provide any relevant information, such as neutral flankers. Whereas controls may not be influenced by such non-informative stimuli, the patients seemed distracted by the neutral flankers, slowing their responses to the central target. On the other hand, reduced attentional cost might also be analogous to findings in patients with schizophrenia of reduced negative priming as indexed by less RT disadvantage for distractor-turn-target items of the Stroop (Salo, Robertson, & Nordahl, 1996). These apparent failures of performance monitoring and visual orienting may be related to a disease-related reduction in the potency of distractor inhibition (May et al., 1995), or to a reduced depth of perceptual encoding of stimuli, whether distractors or non-distractors (Brebion, Smith, Amador, Malaspina, & Gorman, 1997; Kubicki et al., 2003).
In summary, the current findings add to a growing body of evidence for the validity of the ANT (Fan et al., 2002; Fossella et al., 2002), and are consistent with prior studies that have emphasized the important role of anterior cingulate cortex interactions in the attentional disturbance of schizophrenia. However, the current ANT-DTI results are emphasized as preliminary, based on a subset of patients (n=18) who had available previous DTI studies of the CB (Kubicki et al., 2005). Future work will need to examine other brain regions combining DTI and functional imaging in an unselected sample of both male and female patients before any more definite conclusions can be drawn about the functional neuroanatomy of attentional networks in chronic schizophrenia.
Footnotes
This work was supported by the National Institute of Health (K02 MH 01110 and R01 MH 50747 to MES, R01 MH 40799 to RWM, RO1 MH 63360 to MN, R03 MH068464-01 to MK), National Alliance for Research on Schizophrenia and Depression (MK), the Department of Veterans Affairs Merit Awards (MES, MN, PGN, RWM), and the Department of Veterans Affairs REAP Award (RWM).
Publisher's Disclaimer: This is a PDF file of an unedited manuscript that has been accepted for publication. As a service to our customers we are providing this early version of the manuscript. The manuscript will undergo copyediting, typesetting, and review of the resulting proof before it is published in its final citable form. Please note that during the production process errors may be discovered which could affect the content, and all legal disclaimers that apply to the journal pertain.
References
- Basser PJ, Mattiello J, LeBihan D. MR diffusion tensor spectroscopy and imaging. Biophysiology Journal. 1994;66:259–267. doi: 10.1016/S0006-3495(94)80775-1. [DOI] [PMC free article] [PubMed] [Google Scholar]
- Basser PJ, Pierpaoli C. Microstructural and physiological features of tissues elucidated by quantative-diffusion tensor MRI. Journal of Magnetic Resonance. 1996;111:209–219. doi: 10.1006/jmrb.1996.0086. [DOI] [PubMed] [Google Scholar]
- Botvinick MM, Braver TS, Barch DM, Carter CS, Cohen JD. Conflict monitoring and cognitive control. Psychological Review. 2001;108(3):624–652. doi: 10.1037/0033-295x.108.3.624. [DOI] [PubMed] [Google Scholar]
- Brebion G, Smith MJ, Amador X, Malaspina D, Gorman JM. Clinical correlates of memory in schizophrenia: differential links between depression, positive and negative symptoms, and two types of memory impairment. American Journal of Psychiatry. 1997;154(11):1538–1543. doi: 10.1176/ajp.154.11.1538. [DOI] [PubMed] [Google Scholar]
- Callejas A, Lupianez J, Funes MJ, Tudela P. Modulations among the alerting, orienting, and executive control networks. Experimental Brain Research. 2005;167:27–37. doi: 10.1007/s00221-005-2365-z. [DOI] [PubMed] [Google Scholar]
- Carter CS, Mintun M, Nichols T, Cohen JD. Anterior cingulate gyrus dysfunction and selective attention deficits in schizophrenia: [15O]H2O PET study during single-trial Stroop task performance. American Journal of Psychiatry. 1997;154(12):1670–1675. doi: 10.1176/ajp.154.12.1670. [DOI] [PubMed] [Google Scholar]
- Fan J, McCandliss BD, Fossela J, Flombaum JI, Posner MI. The activation of attentional networks. NeuroImage. 2005;26:471–479. doi: 10.1016/j.neuroimage.2005.02.004. [DOI] [PubMed] [Google Scholar]
- Fan J, McCandliss BD, Sommer T, Raz A, Posner MI. Testing the efficiency and independence of attentional networks. Journal of Cognitive Neuroscience. 2002;14(3):340–347. doi: 10.1162/089892902317361886. [DOI] [PubMed] [Google Scholar]
- First MB, Spitzer RL, Gibbon M, Williams JBW. Structured Clinical Interview for DSM-IV Axis I Disorders. Washington, DC: American Psychiatric Press; 1997. [Google Scholar]
- Fletcher P, McKenna PJ, Friston KJ, Frith CD, Dolan RJ. Abnormal cingulate modulation of fronto-temporal connectivity in schizophrenia. Neuroimage. 1999;9(3):337–42. doi: 10.1006/nimg.1998.0411. [DOI] [PubMed] [Google Scholar]
- Fossella KJ, Sommer T, Fan J, Wu Y, Swanson JM, Pfaff DW, et al. Assessing the molecular genetics of attention networks. Biomed Central Neuroscience. 2002;3(1):14. doi: 10.1186/1471-2202-3-14. [DOI] [PMC free article] [PubMed] [Google Scholar]
- Goldman-Rakic PS, Selemon LD, Schwartz ML. Dual pathways connecting the dorsolateral prefrontal cortex with the hippocampal formation and parahippocampal cortex in the rhesus monkey. Neuroscience. 1984;12:719–743. doi: 10.1016/0306-4522(84)90166-0. [DOI] [PubMed] [Google Scholar]
- Heaton RK. Wisconsin card sort manual. Odessa, FL: Psychological Assessment Resources; 1981. [Google Scholar]
- James W. The principles of psychology. New York: Henry Holt; 1890. [Google Scholar]
- Kraepelin E. In: Dementia praecox. Barclay E, Barclay S, translators. New York: Churchill Livingstone; 1971. (Original work published in 1919) [Google Scholar]
- Krissian K, Westin CF. Fast and accurate redistancing for level set methods. Paper presented at: Computer Aided Systems Theory (EUROCAST ‘03), 2003; Las Palmas de Gran Canaria, Spain. [Google Scholar]
- Kubicki M, Park H, Westin CF, Nestor PG, Mulkern RV, Maier SE, Niznikiewicz M, Connor EE, Levitt JJ, Frumin M, Kikinis R, Jolesz FA, McCarley RW, Shenton ME. DTI and MTR abnormalities in schizophrenia: analysis of white matter integrity. Neuroimage. 2005;26(4):1109–1118. doi: 10.1016/j.neuroimage.2005.03.026. [DOI] [PMC free article] [PubMed] [Google Scholar]
- Kubicki M, Westin CF, Nestor PG, Wible CG, Frumin M, Maier SE, Kikinis R, Jolesz FA, McCarley RW, Shenton ME. Cingulate fasiculus integrity disruption in schizophrenia: a magnetic resonance diffusion tensor imaging study. Biological Psychiatry. 2003;54:1171–1180. doi: 10.1016/s0006-3223(03)00419-0. [DOI] [PMC free article] [PubMed] [Google Scholar]
- Kubicki M, Westin CF, Maier SE, Frumin M, Nestor PG, Salisbury DF, Kikinis R, Jolesz FA, McCarley RW, Shenton ME. Uncinate fasciculus findings in schizophrenia: a magnetic resonance diffusion tensor imaging study. American Journal of Psychiatry. 2002;159(5):813–820. doi: 10.1176/appi.ajp.159.5.813. [DOI] [PMC free article] [PubMed] [Google Scholar]
- May CP, Kane MJ, Hasher L. Determinants of negative priming. Psychological Bulletin. 1995;118:35–54. doi: 10.1037/0033-2909.118.1.35. [DOI] [PubMed] [Google Scholar]
- McLellan AT, Kushner H, Metzger D. The fifth edition of the Addiction Severity Index. Journal of Substance Abuse Treatment. 1992;9(3):199–213. doi: 10.1016/0740-5472(92)90062-s. [DOI] [PubMed] [Google Scholar]
- Neale JM, Oltmanns TF. Schizophrenia. New York: Wiley; 1980. [Google Scholar]
- Nestor PG, Faux SF, McCarley RW, Penhune V, Shenton ME, Pollak S. Attentional cues in chronic schizophrenia: abnormal disengagement of attention. Journal of Abnormal Psychology. 1992;101(4):682–689. doi: 10.1037//0021-843x.101.4.682. [DOI] [PubMed] [Google Scholar]
- Nestor PG, Kubicki M, Gurrera RJ, Niznikiewicz M, Frumin M, McCarley RW, Shenton ME. Neuropsychological correlates of diffusion tensor imaging in schizophrenia. Neuropsychology. 2004;18(4):629–637. doi: 10.1037/0894-4105.18.4.629. [DOI] [PMC free article] [PubMed] [Google Scholar]
- Nestor PG, O’Donnell BF. The mind adrift: attentional dysregulation in schizophrenia. In: Parasuraman R, editor. The attentive brain. Cambridge, MA: MIT Press; 1998. pp. 527–546. [Google Scholar]
- Pandya DN, Seltzer B. Intrinsic connections and architectonics of posterior parietal cortex in the rhesus monkey. Journal of Comparative Neurology. 1982;204:196–210. doi: 10.1002/cne.902040208. [DOI] [PubMed] [Google Scholar]
- Papadakis NG, Xing D, Houston GC, Smith JM, Smith MI, James MF, et al. A study of rotationally invariant and symmetric indices of diffusion anisotropy. Magnetic Resonance Imaging. 1999;17:881–892. doi: 10.1016/s0730-725x(99)00029-6. [DOI] [PubMed] [Google Scholar]
- Parasuraman R, editor. The attentive brain. Massachusetts: MIT Press; 1998. [Google Scholar]
- Posner MI, Peterson SE. The attention system in the human brain. Annual Review of Neuroscience. 1990;13:25–42. doi: 10.1146/annurev.ne.13.030190.000325. [DOI] [PubMed] [Google Scholar]
- Rees G, Frackowiak R, Frith C. Two modulatory effects of attention that mediate object categorization in human cortex. Science. 1997;275:835–838. doi: 10.1126/science.275.5301.835. [DOI] [PubMed] [Google Scholar]
- Salo R, Robertson LC, Nordahl TE. Normal sustained effects of selective attention are absent in schizophrenic patients withdrawn from medication. Psychiatry Research. 1996;62(2):121–130. doi: 10.1016/0165-1781(96)02804-1. [DOI] [PubMed] [Google Scholar]
- Shakow D. Segmental set: A theory of formal psychological deficit in schizophrenia. Archives of General Psychiatry. 1962;6:1–17. doi: 10.1001/archpsyc.1962.01710190003001. [DOI] [PubMed] [Google Scholar]
- Stoll AL. The psychopharmacology reference card. Belmont, MA: MacLean Hospital; 2001. [Google Scholar]
- Sturm W, Willmes K. On the functional neuroanatomy of intrinsic and phasic alertness. NeuroImage. 2001;14:S76–S84. doi: 10.1006/nimg.2001.0839. [DOI] [PubMed] [Google Scholar]
- Tulsky D, Zhu J, Ledbetter MF. WMS-III technical manual. San Antonio, TX: The Psychological Corporation, Harcourt Brace & Company; 1997. [Google Scholar]
- Vogt BA, Rosene DL, Pandya DN. Thalamic and cortical afferents differentiate anterior from posterior cingulate cortex in the monkey. Science. 1979;204(4389):205–207. doi: 10.1126/science.107587. [DOI] [PubMed] [Google Scholar]
- Wang K, Fan J, Dong Y, Wang C, Lee TMC, Posner MI. Selective impairment of attentional networks of orienting and executive control in schizophrenia. Schizophrenia Research. 2005;78(2–3):235–241. doi: 10.1016/j.schres.2005.01.019. [DOI] [PubMed] [Google Scholar]
- Wechsler D. Weschler adult intelligence scales. 3. San Antonio, TX: Harcourt Brace & Co; 1997. [Google Scholar]
- Wechsler D. Weschler memory scale. 3. San Antonio, TX: Harcourt Brace & Co; 1997. [Google Scholar]
- Zahn TP, Rosenthal D, Shakow D. Effects of irregular preparatory intervals on reaction time in schizophrenia. Journal of Abnormal Social Psychology. 1963;67:44–52. doi: 10.1037/h0049269. [DOI] [PubMed] [Google Scholar]