

Abstract
The diagnosis of lung cancer is quite often hampered by the existence of various cell types within samples such as biopsies or pleural effusions. We have established a new marker for image cytometry of interphase tumor cells of the lung by using the most recurrent and early cytogenetic event in lung cancer, the loss of the short arm of chromosome 3. The method is based on the detection of the imbalance between the long and the short arms of chromosome 3 by performing two-color fluorescence in situ hybridization on both arms. Fourteen tumors were analyzed after short-term culture and compared with the corresponding cytogenetic data obtained from metaphase analysis. Results on interphase nuclei and control experiments on metaphases were the same, with imbalance ratios ranging from 1.0 to 2.0 (mean value 1.6, median 1.5). To assess the clinical significance of this approach, three pleural effusions were analyzed. Data showed that normal cells within the sample could have been distinguished from the tumor cells based on different imbalance values between the long and the short arms. Thus, our method allows refined detection of lung tumor cells within samples containing heterogeneous cell populations.
Lung cancer is one of the leading causes of cancer mortality in the Western world. Clinically, it can be divided into two categories: small-cell lung cancer (SCLC), constituting about 20 to 25% of all bronchogenic cancers, and non-small-cell lung cancer (NSCLC), accounting for the other 75 to 80%. 1, 2 Despite their high incidence, detailed cytogenetic analysis of these tumors has remained scarce. This is due mainly to the difficulties of obtaining well spread metaphases. 3, 4 For NSCLCs, only 40 to 60% of the cases give analyzable metaphases; for SCLCs, this value decreases to as low as 20%. 3
Several significant recurrent chromosome rearrangements, however, have been identified, such as loss of the short arm of chromosomes 3, 9, and 17. 3 The loss of the short arm of chromosome 3 (3p) is the most frequently observed, 1, 2, 3, 4 appearing in 70 to 80% of SCLCs and 50% of NSCLCs. This deletion is confirmed by data obtained from molecular biology, ie, allelic losses. The target gene remains unknown, but several possible tumor suppressor genes could be involved. 5, 6, 7, 8 Moreover, the 3p loss is an early event in the tumor progression of lung cancer, in that it is also observed in preneoplastic lesions. 9, 10 Thus, the loss of 3p leads to an imbalance between the long and the short arms of chromosome 3 within lung tumors.
Recently, we have developed a method to investigate chromosome rearrangements within interphase nuclei using fluorescence in situ hybridization (FISH) and image cytometry. 11 Briefly, our method consisted of detecting the imbalance between the long and short chromosome arms. After two-color FISH of chromosome arm paintings for both arms, the imbalance for each nucleus was determined by calculating the fluorescence ratio of the two arms. This method has the advantage of being free of any technical and biological bias encountered during spot counting. 12
In the present study, we applied this approach to lung cancer to develop a new marker for the detection of cancer cells. Using image cytometry and chromosome arm paintings, we first analyzed xenografted and short-time cultured lung tumors for which data from classical cytogenetics were available. Pleural effusions were then analyzed to investigate whether rare tumors cells were detectable among heterogeneous cell populations.
Materials and Methods
Biological Samples
The study was carried out on xenografted and short-time-cultured lung tumor samples as well as pleural effusions after thoracocentesis. Clinical samples were obtained from the Institut Curie following informed consent and institutional review board approval. Pleural effusions were obtained by thoracocentesis. 13, 14 Tumors and effusions were prepared for short-term cultures (48–72 hours). 15 Metaphase spreads and nuclei on slides were fixed in 3:1 ethanol/acetic acid (v/v) (Carnoy). Another fraction of the effusions was fixed without being cultured in 0.5% paraformaldehyde diluted in phosphate buffered saline, followed by postfixation in 70% ethanol (paraformaldehyde/ethanol) appropriate for image cytometric quantitation of fluorescence signals. 16
Case Description
Fourteen cases of lung carcinomas were analyzed. Eight and six cases were histologically proven SCLCs and NLSCLCs, respectively. Of these cases, eight were xenografted, cultured, and analyzed; the remaining cases were cultured directly. Three samples of pleural effusions from lung cancer were treated as mentioned above. Control experiments were performed on lymphocytes from healthy donors.
DNA Probes and Labeling
One bladder cancer cell line OBR containing del3(p10-pter), kindly provided by Dominique Bellet (Institut Gustave Roussy, Villejuif, France) was used to prepare chromosome 3 arm-specific probes. Chromosome suspensions and chromosome sorting by flow cytometry were performed as described. 17 Chromosome DNA was amplified and labeled according to Milan et al 18 using digoxigenin-11-dUTP (Roche Diagnostics, Meylan, France) for 3q. Commercially available chromosome 3p arm painting (biotin-labeled from AL Technologies, Arlington, VA) was used.
FISH
In situ hybridization for analysis by image cytometry was carried out as described, 11 with minor modifications. Briefly, slides were pretreated with RNase (100 μg/ml, Sigma, France, Saint Quentin Fallavier, France) and pepsin (4 μg/ml, Sigma). Thermal probe denaturation was performed at 70°C for 10 minutes in classical hybridization buffer. Amplified probe DNA was about 30 ng per slide. Target DNA was denaturated at 70°C for 3 minutes in 70% formamide (Fluka, Neu-Ulm, Germany) /2× SSC. Hybridization was carried out overnight at 37°C. Rapid posthybridization washes were performed in 2× SSC at 72°C for 5 minutes.
For fluorescent detection, slides were incubated with anti-digoxigenin FITC antibodies (Roche Diagnostics, Meylan, France) for the 3q arm, whereas mouse anti-biotin antibodies followed by anti-mouse IgG antibodies labeled with Texas Red (Molecular Probes, Leiden, The Netherlands) were applied for 3p arm detection. Slides were counterstained with DAPI (1 μg/ml) and mounted in p-phenylene-diamine.
Systematically, reference slides with normal lymphocytes were hybridized together with tumor slides.
Quantitative FISH Measurements
Quantitation of the hybridization signals was performed using a Discovery automated image analyzer (Becton Dickinson Image Cytometry Systems, Leiden, The Netherlands). Detection procedure was same as described, 11 with slight modifications. Nuclei were first detected by DAPI excitation at 330 nm. Next, the integrated fluorescence of the hybridization signal was measured separately for fluorescein isothiocyanate (FITC; 3q arm, green fluorescence, excitation at 485 nm) and for Texas Red (3p arm, red fluorescence, excitation at 577 nm). For each experiment, optimal integration time was determined with the reference slide and kept constant for all tumor slides. Generally, 500 to 700 nuclei were quantified and one measurement was done per slide. Artifacts, incorrectly segmented nuclei, and nuclei containing either no green or no red fluorescence were excluded interactively. The percentage of excluded cells could reach up to 20%, depending on the hybridization efficiency. At least 500 cells with analyzable data were obtained. The resulting histograms for each fluorochrome were generated by the Discovery software.
Visual Observations
Visual observations and photography were performed with an epifluorescence microscope (Leitz, Welmar, Germany) equipped with a mercury arc lamp and a 100× oil immersion objective.
Determination of the Imbalance between Chromosome 3 Arms
Interphase Nuclei
The signal ratio between 3q and 3p arms was determined first. Two different methods were used. First, mean integrated fluorescence of each color was determined by setting the gates at half the height of the histogram peak, and the Discovery software calculated the mean values. The level of green fluorescence (3q) divided by that of red fluorescence (3p) was the 3q/3p ratio. For cases containing two different cell populations, integrated fluorescence of each color and for each nucleus was plotted against each other in a scatter plot. After setting of a region, mean values and the corresponding standard deviations (SDs) of each color were automatically calculated by the Discovery software. The SD of each mean fluorescence was taken as an indicator of the dispersion of the values. Different regions were used, and mean and SD were determined for each region separately. The mean green fluorescence (3q) divided by red fluorescence (3p) was the 3q/3p ratio. Imbalances for interphase nuclei (Ii) were obtained by dividing the 3q/3p ratio of tumor samples by the 3q/3p ratio of the reference slide (normal lymphocytes).
Metaphases
When available after short-term cultures, metaphases on the same slides were also used to determine 3q/3p imbalance as a control for nuclei measurements.
R-banding was performed together with FISH. For complex karyotypes, the number of arm copies was determined by summing all labeled arm fragments in the genome and by taking the normal arm as a reference. For xenografts, about 10 metaphases could have been analyzed, whereas the amount of analyzable metaphases for tumor samples was lower (about 5). Imbalance detected on metaphases (Ιm) was calculated by dividing the amount of 3q (green fluorescence) by the amount of 3p copies (red fluorescence).
Background Measurements
To estimate nonspecific background signal, slides without probe were analyzed. Comparison with normally hybridized slides showed that the mean background signal was <20% of the specific signal. Thus, background noise did not significantly interfere with the measurements.
Control Experiments
Metaphases from normal lymphocytes gave two specifically marked 3q and 3p arms (data not shown). The corresponding nuclei showed two large spots, each representing the long or short arm. Determination of imbalances within lymphocyte samples showed differences of up to 10%.
Results
Fourteen lung tumors and three pleural effusions were analyzed by interphase FISH. Whenever possible, control data from metaphases were collected from metaphase FISH and R-banding experiments on the same slides of the same case. Thus, image cytometric data were verified by cytogenetic data. Imbalances were calculated by all three methods and varied from 1.0 to 2.0, with a mean value of 1.6 (median, 1.5; Table 1 ), indicating an excess gain of 3q over 3p. No excess loss of 3q over that of 3p was observed in any case. For two cases of pleural effusions, the samples were split to obtain data after cell culturing (Figure 1C) and after direct spreading on the slides. Results on interphase nuclei were concordant in all cases for both cultured and directly spread samples. Cytogenetic control data from R-banding and metaphase FISH were available in 60% of the cases representing the actual percentage of successfully karyotyped cases. Chromosome rearrangements were so complex in some cases that no precise imbalance value could have been determined by R-banding data (cases NSCLC1, NSCLC3, and SCLC110). The analysis of metaphase FISH showed precise imbalance values in some cases (SCLC41 and NSCLC3) but was not sufficient in other cases (SCLC110 and NSCLC1), due to the high complexity of the chromosome rearrangements. Overall, only complete or partial loss of 3p and no gain of 3q were detected, leading especially to formation of derivative chromosomes der(1;3)(q10;p10) and der(3;17)(q10;q10) (Figure 1A and 1B) , except for case SCLC108, where the formation of an isochromosome i(3q) was observed (Figure 1D) . For cases where data on nuclei and metaphases were available, measured imbalances were similar except for two cases.
Table 1.
Comparison between the Detection of Chromosome 3 Imbalances by FISH and Classical Cytogenetics within Lung Cancer Samples
| Case | Interphase imbalance (Ii) | Metaphase imbalance (IM) | |
|---|---|---|---|
| R-banding | FISH | ||
| SCLC6 | 1.7 | 1.7 | 1.7 |
| SCLC10 | 1.7 | 1.7 | 1.7 |
| SCLC41 | 2 | 2 | 2 |
| SCLC74 | 1.7 | 1.7 | 1.7 |
| SCLC108 | 2 | 2 | 2 |
| SCLC110 | 1.3 | * | >1 |
| SCLC130 | 1.5 | 1.5 | 1.5 |
| SCLC131 | 1.3 | N.D. | N.D. |
| NSCLC1 | 1.7 | 1.5<l<2 | 1.5<l<2 |
| NSCLC3 | 1.5 | >1 | 1.5 |
| NSCLC4 | 1 | 1 | N.D. |
| NSCLC9 | 1 | N.D. | N.D. |
| NSCLC8 | 1.3 | 1 and 1.5 | N.D. |
| NSCLCIC8 | 1.8 | N.D. | N.D. |
| EFF1† | 1.3 | 1 and 1.5 | 1 and 1.5 |
| EFF2† | 1 | N.D. | N.D. |
| EFF2‡ | 1 | N.D. | N.D. |
| EFF3† | 1.5 | N.D. | N.D. |
| EFF3‡ | 1.5 | N.D. | N.D. |
Karyotype too complex for imbalance determination.
Cultured sample.
Directly fixed sample without culturing.
SCLC, small-cell lung cancer; NSCLC, non-small-cell lung cancer; EFF, pleural effusion; N.D., not determined due to lack of metaphases; I, imbalance.
Figure 1.
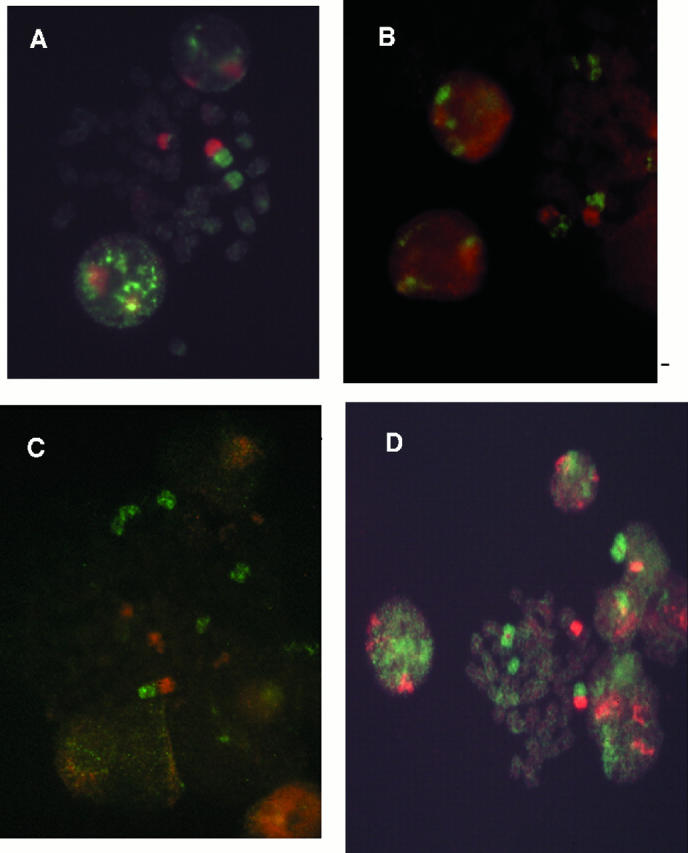
Metaphases from lung cancer samples. Images were taken with double filter (FITC-Rhodamine) and a 100× objective. A: Metaphase obtained from an SCLC (case SCLC10). B: Metaphase obtained from NSCLC (case NSCLC1). C: Metaphase obtained from an effusion (EFF1). D: Metaphase obtained from SCLC108 showing an isochromosome i(3q).
Detection of Different Subpopulations
In two cases (one tumor and one effusion), Ii values were different from those obtained from metaphasis. Metaphase analysis displayed two populations, one normal population showing no imbalance and one population with an imbalance of 1.5. Interphase analysis revealed an imbalance of 1.3. Therefore, a refined analysis using scatter plots was performed (Figure 2) . Compared to the standard method where one single population was considered (Figure 2A) , Ii were calculated as if at least two different subpopulations were present (Figure 2B) . To separate these populations, different criteria based on the scatter plot were applied. The existence of two regions with significantly different imbalance values based on the visual distinction was observed (Figure 2B) , and the corresponding regions were set. To confirm the first rough analysis, another refinement was necessary. One criterion was applied: the change of the SDs between the two populations. The limit of each region was defined when a significant change in the SD of green and red fluorescence occurred. Hence, three regions were obtained, regions 1 and 2 as shown, representing about 33 to 50% of the whole population, and region 3, containing less than 10% of the cells of the whole population. Iis determined for each region showed that region 1, with the normal cells, gave an Ii = 1 and region 2, with tumor cells, gave an Ii = 1.5, corresponding to what was obtained by Ims. The cells having an Ii = 0.8 seemed to represent a population with loss of 3q. Because this loss has never been observed in lung cancer and only a few cells are in this region, the Ii can be considered as representing artifacts generated during the hybridization procedure.
Figure 2.

Scatter plot of the distribution of integrated fluorescence for the long arm (3q) and short arm (3p) paintings, quantified on approximately 500 nuclei of one single population and one pleural effusion containing three subpopulations. Integrated fluorescence is given in arbitrary units (a.u.) on both axes (x axis = 3q and y axis = 3p). A: Case SCLC 6 with Ii = 1.7. B: Same case, Region 1 (normal cells) Ii = 1, region 2 (tumor cells) Ii = 1.5, and region 3 (artifacts) Ii = 0.8.
Discussion
Because loss of 3p is a recurrent and early event in progression of lung carcinomas, we have developed a new marker for cancer cells based on measurements of the imbalance between the short and the long arms of chromosome 3. This method offers all of the advantages of interphase cytogenetics that already have been described. 9 However, only a majority (not all) of lung cancer cells will be detected by our approach, because loss of 3p is observed in 75% of SCLCs and 50% of NSCLCs.
Different cell populations could be distinguished based on the detection of the imbalance between chromosome arms. However, the distinction must be made in an objective and rigorous manner using computer programs with mathematical models. In our study, because no appropriate program was available, SDs were used as the criterion. This separation of the populations is very useful because many cytological samples are contaminated with mesothelial cells as well as normal blood cells, which may be difficult to distinguish morphologically. Because the actual amount of tumor cells within the samples remains low, our approach could provide data for better diagnoses with cytological samples of lung cancer. More rigorous analysis of the data would allow the detection of small populations of tumor cells in a reliable way. Indeed, the lowest percentage of tumor cells with chromosome 3 imbalances would determine the sensitivity of the method. The essential requirement for improved diagnosis would be the specificity of this chromosome rearrangement for lung cancer. Hence, malignant metastatic cells from lung cancer in pleural effusions could be distinguished from reactive mesothelial hyperplasia and mesothelioma, 19 and atypical cells or secondary carcinoma from other sites such as the breast, 20 because these cells do not show imbalance of the chromosome 3 as a recurrent event.
Recent findings 21 about tumor extension in lung carcinomas by analysis of cell proliferation showed evidence for higher proliferative activity of cells located at the periphery of the tumor. It would therefore be possible, using our approach, to confirm whether these cells have already undergone chromosome rearrangements and have become tumoral. This would give more insight into tumor progression.
Another potential avenue of diagnostic or perhaps prognostic improvement would be the application of our method to preneoplastic lesions such as bronchial epithelial dysplasia. Many studies using molecular biology show loss of heterozygosity at loci on the short arm of chromosome 3 occurring in all histological types of lung cancer, 7, 8 so that our marker could be of prognostic significance in such lesions. Because they tend to be noninvasive but premalignant, a detailed analysis could show at what stage they become invasive carcinomas. Using an in situ approach, it would also be possible to obtain additional data on routinely stained slides such as Papanicolaou-stained bronchial cytological samples. For this purpose, a series of bronchial brush and aspiration specimens is currently analyzed by FISH after destaining of the slides. Additionally, we intend to compare these data with clinical data obtained from conventional cytology and corresponding histological biopsies.
In conclusion, quantitative FISH of lung cancer samples allows detection of the presence of malignant cells of lung cancer in a reliable manner, as previously shown for breast cancer cells, by analyzing the imbalance of chromosome 1. 11 This new tool could improve the detection of lung cancer cells and help in the characterization of premalignant lesions.
Address reprint requests to Khuong Truong, Institut Curie, UMR 147-CNRS, 26 rue d’Ulm, 75248 Paris cedex 05, France. E-mail: ktruong@curie.fr.
Footnotes
Supported by grants from the Ligue Nationale contre le Cancer (Comité National, Paris et Hauts-de-Seine) and the Association pour la Recherche sur le Cancer (ARC).
References
- 1.Carbone D: The biology of lung cancer. Sem Oncol 1997, 24:388-401 [PubMed] [Google Scholar]
- 2.Sekido Y, Fong KM, Minna JD: Progress in understanding the molecular pathogenesis of human lung cancer. Biochim Biophys Acta 1998, 1378:F21-F59 [DOI] [PubMed] [Google Scholar]
- 3.Testa JR, Liu Z, Feder M, Bell DW, Balsara B, Cheng JQ, Taguchi T: Advances in the analysis of chromosome alterations in human lung carcinomas. Cancer Genet Cytogenet 1997, 95:20-32 [DOI] [PubMed] [Google Scholar]
- 4.Flüry-Herard A, Viegas-Péquignot E, De Cremoux H, Chlecq C, Bignon J, Dutrillaux B: Cytogenetic study of five cases of lung adenosquamous carcinomas. Cancer Genet Cytogenet 1992, 59:1-8 [DOI] [PubMed] [Google Scholar]
- 5.Whang-Peng J, Kao-Shan CS, Lee EC, Bunn PA, Carney DN, Gazdar AF, Minna JD: Specific chromosome defect associated with human small-cell lung cancer. Science 1982, 215:181-182 [DOI] [PubMed] [Google Scholar]
- 6.Naylor SL, Johnson BE, Minna JD, Sakaguchi AY: Loss of heterozygosity of chromosome 3p markers in small-cell lung cancer. Nature 1987, 329:451-454 [DOI] [PubMed] [Google Scholar]
- 7.McNeill-Killary A, Wolf ME, Giambernardi TA, Naylor SL: Definition of a tumor suppressor locus within human chromosome 3p21–p22. Proc Natl Acad Sci USA 1992, 89:10877-10881 [DOI] [PMC free article] [PubMed] [Google Scholar]
- 8.Hibi K, Takahashi T, Yamakawa K, Ueda R, Sekido Y, Ariyoshi Y, Suyama M, Takagi H, Nakamura Y, Takahashi T: Three distinct regions involved in 3p deletion in human lung cancer. Oncogene 1992, 7:445-449 [PubMed] [Google Scholar]
- 9.Sundaresan V, Ganly P, Hasleton P, Rudd R, Sinha G, Bleehen NM, Rabbitts P: p53 and chromosome 3 abnormalities, characteristic of malignant lung tumours, are detectable in preinvasive lesions of the bronchus. Oncogene 1992, 7:1989-1997 [PubMed] [Google Scholar]
- 10.Sozzi G, Miozzo M, Pastorino U, Pilotti S, Donghi R, Giarola M, De Gregorio L, Manenti G, Radice P, Minoletti F, Della Porta G, Pierotti MA: Genetic evidence for an independent origin of multiple preneoplastic and neoplastic lung lesions. Cancer Res 1995, 55:135-140 [PubMed] [Google Scholar]
- 11.Truong K, Guilly MN, Gerbault-Seureau M, Malfoy B, Vielh P, Bourgeois CA, Dutrillaux B: Quantitative FISH by image cytometry for the detection of chromosome 1 imbalances in breast cancer: a novel approach analyzing chromosome rearrangements within interphase nuclei. Lab Invest 1998, 78:1607-1613 [PubMed] [Google Scholar]
- 12.Truong K, Boenders J, Maciorowski Z, Vielh P, Dutrillaux B, Malfoy B, Bourgeois CA: Signal amplification of FISH for automated detection using image cytometry. Anal Cell Pathol 1997, 13:137-146 [DOI] [PMC free article] [PubMed] [Google Scholar]
- 13.Sokolowski JW, Burgher LW, Jones FL, Jr.,, Patterson JR, Selecky PA: Guidelines for thoracocentesis and needle biopsy of the pleura. Am J Respir Dis 1989, 140:257-258 [DOI] [PubMed] [Google Scholar]
- 14.Prakash UBS, Reiman HM: Comparison of needle biopsy with cytologic analysis for the evaluation of pleural effusion: analysis of 414 cases. Mayo Clin Proc 1985, 60:158-164 [DOI] [PubMed] [Google Scholar]
- 15.Muleris M, Almeida A, Gerbault-Seureau M, Malfoy B, Dutrillaux B: Detection of DNA amplification in 17 primary breast carcinomas with homogeneously staining regions by a modified comparative genomic hybridization technique. Genes Chromosomes Cancer 1994, 10:160-170 [DOI] [PubMed] [Google Scholar]
- 16.Maciorowski Z, Veilleux C, Gibaud A, Bourgeois CA, Klijanienko J, Boenders J, Vielh P: Comparison of fixation procedures for fluorescent quantitation of DNA content using image cytometry. Cytometry 1997, 28:123-129 [PubMed] [Google Scholar]
- 17.Van den Engh G, Trask B, Gray JW, Cram S, Bartholdi M: Preparation of chromosome suspensions for flow cytometry. Cytometry 1984, 5:108-117 [DOI] [PubMed] [Google Scholar]
- 18.Milan D, Riquet J, Yerle M, Goureau A, Schmitz A, Cribiu EP, Frelat G, Gelin J: Homologous and heterogeneous FISH painting with PARM-PCR chromosome-specific probes in mammals. Mamm Genome 1996, 7:194-199 [DOI] [PubMed] [Google Scholar]
- 19.Henderson DW, Shilkin KB, Whitaker D: Reactive mesothelial hyperplasia versus mesothelioma, including mesothelioma in situ. Am J Clin Pathol 1998, 110:397-404 [DOI] [PubMed] [Google Scholar]
- 20.Raab SS: Significance of atypical cells in cytologic serous fluid specimens. Am J Clin Pathol 1999, 111:11-13 [DOI] [PubMed] [Google Scholar]
- 21.Shoji M, Dobashi Y, Morinoga S, Jiang S, Kameya T: Tumor extension and cell proliferation in adenocarcinomas of the lung. Am J Pathol 1999, 154:909-918 [DOI] [PMC free article] [PubMed] [Google Scholar]