

Abstract
A monoclonal B cell population is the hallmark of B cell neoplasms including cutaneous B cell lymphomas (CBCLs). We modified and tested several polymerase chain reaction (PCR)-based assays involving amplification of immunoglobulin heavy chain (IgH) gene rearrangements to optimize assays specifically for cutaneous lymphoid infiltrates. We achieved greatest sensitivity with an assay employing IgH consensus primers complementary to the framework 3 portion of the upstream variable region and the downstream joining region. We studied 12 CBCLs, 6 nodal lymphomas and 7 cell lines. In 17/25 of these B cell neoplasms (84%), we detected one or two dominant bands, consistent with one or both IgH alleles being rearranged in the neoplastic B cell clone. As expected, IgH PCR assays produced diffuse smears in agarose gels or complex ladders in polyacrylamide gels when polyclonal B cell controls (blood and tonsil) were analyzed. However, in normal skin and non-CBCL skin lesions, one or a small number of discrete bands were sometimes detected. In certain cases, this made it difficult to distinguish true positives (monoclonal CBCL) from false positives (clonally restricted benign B cells). Correlation with immunophenotyping confirmed that false positive results were confined to samples with sparse or immunohistologically undetectable B cell infiltrates. Pseudoclonal bands showed variable sizes in repeat PCR reactions and could be distinguished from monoclonal bands by polyacrylamide gel electrophoresis of pooled triplicate PCR products. These findings suggest that molecular diagnosis using IgH PCR assays is best suited for B-cell-rich infiltrates, and can be problematic when applied to suspected T-cell-rich CBCLs, cutaneous T cell lymphomas, or other lesions containing only few B cells unless one is cognizant of the potential pitfalls. Furthermore, these results demonstrate the presence of rare B cells in normal skin and immunohistologically defined cutaneous T cell infiltrates. This correlates with recent reports of sparse B cells within the lymph draining from normal skin and may represent molecular evidence for a trafficking B cell component of the skin-associated lymphoid tissue (SALT). It also suggests a candidate B cell subset for the pathogenesis of cutaneous lymphoid hyperplasia and CBCLs.
Polymerase chain reaction (PCR)-based analysis of immunoglobulin heavy chain (IgH) gene rearrangements is potentially useful for the analysis of B cell clonality in CBCLs, other skin lesions, and noncutaneous extranodal specimens exhibiting small size and/or sparse lymphoid infiltrates. Such specimens are frequently not amenable to conventional Southern blot analysis of genomic immunoglobulin gene rearrangements. Nevertheless, the complexity of the IgH gene presents challenges to the design of effective PCR-based IgH assays that are rapid, straightforward, sensitive, and specific. 1, 2, 3, 4, 5, 6, 7, 8, 9, 10, 11, 12 The variable region of the IgH gene is composed of a large number of gene segments, each of which contains three hypervariable complementary determining regions (CDR1, -2, and -3) and three relatively conserved framework regions (FR1, -2, and -3). This structure is depicted in Figure 1 . Using FR-directed oligonucleotide PCR primers reported to amplify IgH gene rearrangements with sensitivity and specificity in lymphoid and hematopoietic tissues, we developed and tested IgH PCR methods designed for extranodal tissues such as the skin. We found that analysis of the skin poses special challenges for the interpretation of B cell clonality because sparse B cells trafficking through the skin can lead to false positive results regarding the diagnosis of CBCL. However, by adopting the strategies developed in this study, the clonality of most cutaneous B cell infiltrates can be interpreted correctly. In addition, our findings provide a context for future molecular biological characterization of SALT B cells.
Figure 1.

Diagramatic representation of various regions of the immunoglobulin heavy chain (IgH) gene. The various framework regions (FR) within the variable region of the IgH gene are shown along with the positions of the oligonucleotide primers used in the different PCR assays.
Materials and Methods
Tissue Specimens and Cell Lines
Twenty-five cases of B cell lymphoma (9 primary CBCL skin specimens, 3 secondary CBCL skin specimens, 6 primary lymph node specimens, and 7 neoplastic B cell lines) and 23 controls (4 reactive tonsils, 3 normal bloods, 1 T cell lymphoma line (Jurkat), and 15 non-CBCL skin specimens including 1 lymphoid hyperplasia, 1 mycosis fungoides erythroderma, 1 natural killer cell large cell lymphoma, and 12 normal skins) were used in this study. All human tissues were obtained according to protocols approved by local institutional review boards.
DNA Extraction
DNA was extracted from fresh-frozen tissue by proteolysis followed by phenol-chloroform extraction. 1 This involved overnight incubation of minced tissues or cells with 50 μl of proteinase K (1 mg/ml) in a buffer containing 0.8× SSC, 0.2 mol/L NaCl, 0.5% sodium dodecyl sulfate, and 1 mmol/L dithiothreitol at 37°C. This was followed by phenol-chloroform extraction, precipitation of DNA with 95% cold ethanol, subsequent washing with 80% ethanol, vacuum drying, and resuspension of DNA pellets overnight in 1 mmol/L Tris-HCl, 1 mmol/L NaCl, and 1 mmol/L EDTA.
FR1 IgH PCR
This method used a nested, multiplex PCR approach (see Table 1 ). The first round used a mixture of the consensus primers from the framework 1 region (HuVH 1/5, 2, 3, 4, and 6) and the joining region primer LJH. The second round used the FR2A and VLJH primers to amplify a dilution of the first-round products. 2, 3, 4, 5 The reaction was performed in a total volume of 100 μl and the final concentrations of the reagents for the first round were 50 mmol/L KCl, 10 mmol/L Tris-Cl, pH 8.3, 200 μmol/L each dNTP, 2.5 mmol/L MgCl2, 300 ng FR 1 primers (50 ng of each HuVH primer), 75 ng LJH primer, 1 μg DNA template, and 2.5 U Taq polymerase. Cycle conditions for round one were 95°C for 15 seconds, 63°C for 30 seconds, and 72°C for 30 seconds for the first 5 cycles and thereafter 35 cycles at 96°C for 15 seconds, 57°C for 30 seconds, and 72°C for 30 seconds. Round two of the PCR used 50 mmol/L KCl, 10 mmol/L Tris-Cl pH 8.3, 200 μmol/L each dNTP, 1.5 mmol/L MgCl2, 200 ng FR2A primer, 400 ng VLJH primer, 1/100 of first-round product, and 2.5 U Taq polymerase. PCR conditions for this round were 95°C for 15 seconds, 63°C for 30 seconds, and 72°C for 30 seconds for 40 cycles. About 6 μl of PCR product was loaded onto an agarose TBE gel and bands were visualized by ethidium bromide staining. Expected band size was ∼240–260 bp.
Table 1.
IgH Upstream and Downstream Primers and Their Sequences and Product Sizes
| Method | Primer | Sequence | Band size |
|---|---|---|---|
| FR1 | FR2A | 5′-TGG A/GTC CGC/A CAG G/CCT/CT/CCN | ∼250 bp |
| LJH | 5′-TGA GGA GAC GGT GAC C-3′ | ||
| VLJH | 5′-GTG ACC AGG GTN CCT TGG CCC | ||
| HuVH1/5 | 5′-CAG GTG CAG CTG CAG CAG TCT | ||
| HuVH 2 | 5′-CAG GTG AAC CTG CAG CAG TCT | ||
| HuVH 3 | 5′-GAG GTG CAG CTG CAG CAG TCT | ||
| HuVH 4 | 5′-CAG GTG CAG CTG CAG GAG TCG | ||
| HuVH 6 | 5′-CAG GTA CAG GTG CAG CAG TCA | ||
| FR2 | FR2A | 5′-TGG A/GTC CGC/A CAG G/CCT/CT/CCN | ∼250 bp |
| LJH | 5′-TGA GGA GAC GGT GAC C-3′ | ||
| VLJH | 5′-GTG ACC AGG GTN CCT TGG CCC | ||
| FR3 | VH | 5′-CTG TCG ACA CGG CCG TGT ATT | |
| JH | 5′-AAC TGC AGA GGA GAC GGT GAC C- | ∼120 bp |
FR2 IgH PCR
This method used a seminested PCR approach involving a consensus primer for the VH region and 2 consensus JH region primers (see Table 1 ). The round first of PCR used the primer FR2A (a consensus VH primer designed from homologous sequences in the FR 2 region) and the LJH primer. 6 The second round of PCR used FR2A and the VLJH primer. VLJH is located just upstream to LJH. The components of the PCR mixture in a total volume of 25 μl were 10 μmol/L β-mercaptoethanol, 67 mmol/L Tris-Cl pH 8.8, 16 mmol/L (NH4)2SO4, 0.02% gelatin, 0.4 U Taq polymerase, 1 mmol/L each dNTP, 4.5 mmol/L MgCl2, 0.5 μg of each 5′ and 3′primers, and 1 μg DNA template. The second round of the PCR also used the same reaction mixture with the only differences in the concentrations of a few reactants: 0.24 mmol/L each dNTP, 2.0 mmol/L MgCl2, 0.05 μg of each 5′ and 3′ primer, and a 1/5000 dilution of first-round product. Cycle conditions used were 94°C for 5 minutes, followed by 2 minutes each at 94°C, 50°C, and 72°C for 40 rounds and another 20-minute extension at 72°C. PCR product was analyzed on a 3% agarose TBE gel. Expected band size was ∼240–260 bp.
FR3 IgH PCR
This method involved a one-step PCR, using a universal VH primer and a consensus JH primer (Table 1) . The sequence of the VH primer is based on the 3′ end of the FR3 region. 7 The final concentrations of the reaction mixture were: 200 μmol/L each dNTP, 50 mmol/L KCl, 10 mmol/L Tris-Cl pH 9.0, 1.5 mmol/L MgCl2, 100 μg/ml bovine serum albumin, 2.5 U Taq polymerase, 0.45 μg (∼68 pmole) of each 5′ and 3′ primer, and 2 μg DNA template in a total volume of 100 μl. PCR consisted of 40 cycles of 1 minute each at 93°C, 56°C, and 73°C and a 7-minute extension cycle at 73°C for complete extension and annealing of PCR products. Seven microliters of PCR product were loaded onto a 3% agarose TBE gel and run at 120 V for 2 hours. Bands were visualized by ethidium bromide staining. Expected band size was ∼120 bp.
Radiolabeled Sequencing Gel Electrophoresis
To achieve greater band resolution, IgH PCR products were also radiolabeled by 33P ATP kinasing and then electrophoresed in 6% denaturing polyacrylamide gels. The upstream primer was radiolabeled using T4 polynucleotide kinase (2 μl), 10× kinase buffer (2 μl), and 40 μCi 33P ATP in a total reaction volume of 20 μl. The PCR products were electrophoresed at 60 W for 3 hours. The gel was vacuum-dried at 80°C and then autoradiographed overnight at −70°C.
Immunoperoxidase Methods
Tissue specimens were snap-frozen in isopentane/dry ice, stored at −70°C, cryostat-sectioned, and stained with a three-stage monoclonal antibody/biotin/avidin-horseradish peroxidase immunolabeling method as described previously. 13 The monoclonal antibody panel included CD3 (T cells), CD20 (B cells), and CD38 (plasma cells). Controls included isotype-matched first stage antibodies of irrelevant specificity and staining with various stages deleted.
Results
Technical Characteristics of the IgH PCR Assays
In initial experiments using positive control B cell lines and B cell lymphoma tissue samples, the FR1 and FR3 assays yielded reproducible results, whereas the FR2 assay produced inconsistent results in terms of both the amount of PCR products and their band patterns. Therefore, the FR2 assay was abandoned and only the other two methods were used for the remainder of the study. The PCR products of monoclonal B cell lines gave rise to one or two discrete bands when electrophoresed in either agarose or sequencing gels. Resolution was better in sequencing gels but agarose gels were generally adequate for interpreting results (Figures 2 3 4 ). In contrast, the PCR products of samples rich in polyclonal B cells, such as tonsils, produced a diffuse smear in agarose gels and a dense ladder of bands in sequencing gels. Analysis of samples lacking IgH gene rearrangements, such as the Jurkat acute lymphoblastic leukemia T cell line and the SCC-13 squamous cell carcinoma line, lacked any detectable IgH PCR products.
Figure 2.

Agarose gels showing positive and negative results for B-cell clonality in a variety of samples using three different IgH PCR assays whose upstream primers are targeted to consensus sequences in the IgH gene variable region known as FR1, FR2, and FR3. Lanes containing a dominant clonal IgH gene rearrangement exhibit a discreet band (lanes marked +), whereas lanes containing only polyclonal IgH gene rearrangements show only a diffuse smear (lanes marked −). B, blank; P, positive control B cell lines; C, carry-over negative control; J, Jurkat T cell line negative control; T, tonsil polyclonal control; S, normal skin control; CBCL, cutaneous B-cell lymphoma; NBCL, nodal B-cell lymphoma; M, marker.
Figure 3.
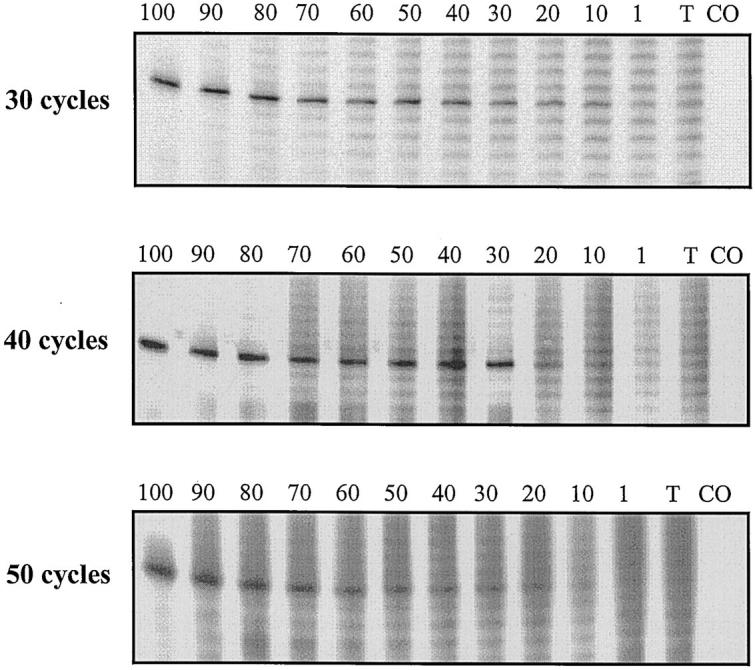
The impact of the number of PCR cycles on the detection of dominant clonality. The B cell lymphoma cell line LTR228 was diluted in reactive tonsil. The FR3 assay was used. Each lane contains 6 μl of radiolabeled PCR product. The proportion of LTR228 DNA is listed as a percentage above each lane. The three panels represent 30, 40, and 50 PCR cycles.
Figure 4.

Detection of restricted IgH gene rearrangements in normal skin. Triplicate analyses of three normal skin samples (A-C) are shown using the FR1 assay. The lanes marked “mix” contain pooled PCR products from the three preceding individual PCR reactions. Each lane contains 6 μl of radiolabeled PCR product. Daudi is a positive control cell line (one band). Tonsil and blood are polyclonal B cell controls that show a complex smeared ladder of many bands. CO is the carry-over lane that contains all reagents except DNA. The pseudo-monoclonal band patterns seen in some lanes (one or two bands) are converted to a polyclonal complex band pattern in the lanes containing the triplicate mixes.
In titration experiments using 40 PCR cycles, the clonal detection thresholds of the FR1 and FR3 assays differed from each other and also varied with the proportion of polyclonal IgH gene rearrangements present in the template DNA mixture. For example, when various monoclonal B cell lines were diluted in SCC-13 DNA, which lacks any polyclonal IgH gene rearrangements, the clonal detection threshold was 0.25 to 1% for the FR1 assay (Daudi, Raji, MC/CAR, and ST486 lines in sequencing gels) and 0.1% for the FR3 assay (LTR228, MC/CAR, and ST486 lines in agarose gels). The particular B cell line used in these studies had some effect on the clonal detection threshold, probably because the consensus IgH primers do not amplify all IgH gene rearrangements with equal efficiency.
In contrast, when the same experiments using 40 PCR cycles were conducted with reactive tonsil DNA as diluent, the clonal detection thresholds of the FR1 assay (Daudi, Raji, MC/CAR, and CA46 in agarose gels) and the FR3 assay (LTR228, Ramos, and ST486 in sequencing gels) were changed to the much less sensitive levels of 90 to 100% and 30 to 40%, respectively. LTR228 results are shown in Figure 3 . These findings indicate that even small proportions of polyclonal B cells can interfere with detection of the dominant B cell clone.
In support of this view, an intermediate threshold of 10 to 20% for the 40-cycle FR3 assay in sequencing gels was obtained when the LTR228 and MC/CAR monoclonal B cell lines were titrated in 10% tonsil DNA mixed with SCC-13 DNA. Similar titration experiments using the FR1 assay in agarose gels could achieve a sensitivity threshold of no better than 90% for the Daudi, Raji, and MC/CAR lines. These findings indicate that the FR3 assay has a significantly better sensitivity threshold than the FR1 assay, probably because it is less affected by background polyclonal IgH gene rearrangements.
Altering the number of PCR cycles also affected the clonal detection threshold. For the LTR228 cell line diluted in tonsil, the greatest sensitivity (10%) was achieved using 30 cycles. Representative titration results are shown in Figure 3 .
Sensitivity of the IgH PCR Assays
To determine the sensitivity of the FR1 and FR3 assays, 25 B cell neoplasms were analyzed using both agarose and sequencing gels as detailed in Table 2 . The same final result (dominant clonal versus polyclonal) was obtained in most cases when analyzed by either agarose or sequencing gel methods; however, band resolution was superior in sequencing gels. This lead to a revised interpretations in some cases: from FR1+ (agarose) to FR1− (sequencing) in two samples and from FR3− (agarose) to FR3+ (sequencing) in five samples. Therefore, use of sequencing gels is recommended because of their enhanced band resolution. Based on the results of sequencing gels, there were 13 FR1+ samples (52%); all of these were also FR3+. There were 21 FR3+ samples, including eight FR1−/FR3+, yielding an overall sensitivity of 84%.
Table 2.
Sensitivity of FR1 and FR3 IgH PCR Assays for Detecting Dominant B Cell Clonality in 25 B Cell Neoplasms
| B cell neoplasms | IgH PCR assays | |||
|---|---|---|---|---|
| CBCL | NBCL | B cell lines | FR1 | FR3 |
| 5 | 1 | 7 | + | + |
| 0 | 0 | 0 | + | − |
| 6 | 2 | 0 | − | + |
| 1 | 3 | 0 | − | − |
| Sensitivity | 52% | 84% | ||
Includes 12 cutaneous B cell lymphomas, 6 nodal B cell lymphomas, and 7 neoplastic B-cell lines. CBCL, cutaneous B cell lymphoma. NBCL, nodal B-cell lymphoma.
Specificity of the IgH PCR Assays
It was evident from the experiments described above that the FR1 and FR3 assays were able to distinguish B cell lymphoma samples containing monoclonal IgH gene rearrangements from samples rich in polyclonal IgH gene rearrangements or lacking such rearrangements altogether. However, our focus was on methods suitable for recognizing B cell lymphomas in extranodal sites such as the skin. Therefore, we studied the band patterns produced by these assays in samples containing a variable proportion of reactive B cells ranging from absent or very sparse, as in clinically normal skin, to more abundant, as in various non-CBCL lymphoid infiltrates. In sequencing gels, normal skin showed either no IgH PCR products, a polyclonal ladder of bands, or a clonally restricted pattern of one or a few bands. Non-CBCL lymphoid infiltrates showed one of the two latter patterns. When the PCR findings were correlated with tissue section immunoperoxidase staining for B cell antigens, it was apparent that lymphoid infiltrates containing small numbers of CD20+ B cells or CD38+ plasma cells were the ones most likely to yield a clonally restricted IgH band pattern. This included the normal skin specimens that sometimes contained rare perivascular CD20+ or CD38+ B-lineage cells. In some instances the restricted IgH band pattern contained only one or two bands and, therefore, could be interpreted as a false positive result that could be mistaken for evidence of a monoclonal B cell lymphoma. Representative findings are shown in Figure 4 . Proof that this type of false positive band pattern could be created by sparse polyclonal B cells was obtained by diluting normal blood with the SCC-13 cell line. As shown in Figure 5 , at titers of 1% or less lymphoid DNA, restricted IgH band patterns emerged in sequencing gels and mimicked monoclonal IgH gene rearrangements.
Figure 5.

Titration of normal blood in the squamous cell carcinoma cell line SCC 13. The pattern of IgH gene rearrangements using the FR1 assay is shown at various concentrations of blood. Each lane has 6 μl of radiolabeled PCR product. At lower percentages of blood corresponding to sparse B cells, a pseudo-monoclonal band pattern emerges.
When separate PCR products from multiple amplifications of the same pseudoclonal specimen were electrophoresed side by side, it was apparent that the band pattern varied. This was consistent with amplification of different IgH gene rearrangements that randomly gained an advantage in early cycles of different PCR reactions. When these products were pooled and electrophoresed, they exhibited an additive complex band pattern that contrasted with the truly monoclonal samples that consistently produced the same clonal band pattern (Figure 4) .
Discussion
In the current study, we have modified and thoroughly tested PCR methods that afford improved resolution of discrete IgH gene rearrangements and detect dominant clonality in approximately 84% of B cell neoplasms including primary CBCLs. The detection of clonal IgH gene rearrangements in all seven B cell lines tested suggests that the failure to detect clonality in some biopsy specimens was due to competition from background polyclonal B cells rather than failure of the PCR primers to amplify the tumor-specific IgH gene rearrangements. However, the latter possibility cannot be completely excluded. Although separation of PCR products in agarose gels was adequate in most cases, there were some instances where false negative or false positive results were seen in agarose gels. Therefore, sequencing gels are preferred. The enhanced resolution provided by sequencing gels is also advantageous in certain other circumstances. These include documenting the same clonal rearrangement in multiple specimens from the same patient during lymphoma staging, monitoring therapeutic response or detecting early relapse.
Although there were no FR1+/FR3− cases in our current series, it is entirely possible that such cases will be encountered. Therefore, use of both the FR1 and FR3 assays is advised to maximize the detection of dominant B cell clones. Overall, the FR3 assay proved to have a more sensitive clonal detection threshold ranging from about 0.1 to 30% when the background content of polyclonal B cells ranged from about 0 to 50%, respectively. Although the titration studies performed using neoplastic B cell lines provide a rough indication of the clonal detection threshold of these PCR assays, results may differ for individual B cell lymphomas because certain IgH gene rearrangements may be amplified better than others. These IgH gene rearrangements may be more complementary to the IgH consensus primers.
We have also shown that sparse reactive B cells in extranodal tissues such as the skin can result in clonally restricted band patterns that can appear as false positives mimicking the true positive pattern produced by B cell neoplasms. This observation underscores the importance of using negative controls relevant to the tissue of interest. Whereas reactive tonsils or lymph nodes are useful polyclonal controls for nodal lymphomas, normal skin and inflammatory dermatoses are more appropriate polyclonal controls for cutaneous lymphomas. This important point has not been highlighted in prior studies of B cell clonality employing PCR methods to detect IgH gene rearrangements. 2, 3, 4, 5, 6, 7, 8, 9, 10, 11, 12, 14, 15
The false-positive pitfall inherent in analysis of skin lesions can be avoided by an algorithmic approach that combines immunopathology with gene rearrangement analysis (Figure 6) . If immunopathological analysis demonstrates many B cells or plasma cells, then IgH PCR is unlikely to produce a false positive pattern due to restricted IgH gene rearrangements arising from sparse B cells. In tissue samples with sparse B-lineage cells, IgH PCR analysis must be interpreted with great caution. Based on our findings that showed emergence of a pseudoclonal IgH band pattern at a titer of about 0.5% polyclonal B cells (see Figure 5 ), we set this limit conservatively at about 5%. Without other supportive findings, a monoclonal pattern observed in this setting should not be used as evidence for B cell neoplasia. In these cases, electrophoresis of pooled products from three or more PCR amplifications of the same sample can be helpful because the random pseudoclonal band patterns will be additive creating a complex band pattern while the true clonal band pattern will be consistent (see Figure 4 ). This has particular relevance for diagnosing so-called “T-cell-rich B cell lymphomas” including lymphomatoid granulomatosis. It is also relevant to the question of how frequently IgH gene rearrangements occur in unequivocal T cell lymphomas and leukemias, samples of which might contain sparse non-neoplastic B cells. Although this study has focused on the skin, it is apparent that a similar approach is required for the analysis of B cell clonality in other extranodal sites that normally contain few or no B cells.
Figure 6.

Combined immunopathological/molecular biological algorithm for the analysis of IgH gene rearrangements in extranodal tissues such as the skin. This approach should help avoid false positive results secondary to sparse B cells.
Although it is possible that circulating B cells trapped in the blood vessels of biopsy specimens may have contributed to the clonally restricted B cells detected in some samples of normal skin, they were unlikely to be the sole explanation for this phenomenon because some normal skin samples lacked any detectable IgH PCR products whatsoever. We believe that this clonally restricted B cell pattern is molecular evidence for a B cell component of the skin-associated lymphoid tissue (SALT). 16 Presumably, these B cells traffic from the blood vessels to the lymphatics via the extracellular dermal compartment and thus could be present in each of these microenvironments at the time of skin biopsy. This view is consistent with our immunopathological studies demonstrating occasional extravascular B cells in the dermis of normal skin and with prior reports showing that 3 to 5% of tumor-infiltrating lymphocytes in primary cutaneous melanomas and squamous cell carcinomas, as well as in cutaneous metastases, are CD20+ B cells. 17 It is also supported by recent studies showing that approximately 0.5% of the lymphoid cells in the lymph draining normal human skin are, in fact, B cells. 18 These observations are exciting because they identify the IgH gene rearrangements of a B cell subset that is the most likely candidate for the origin of cutaneous B cell lymphoid hyperplasia and CBCLs. Future studies aimed at the isolation and characterization of these putative SALT B cells may help to elucidate the pathogenesis of cutaneous B cell lymphoproliferative disorders.
Address reprint requests to Gary S. Wood, M.D., Chief, Dermatology Service 11-G(W), Louis Stokes Cleveland VA Medical Center, 10701 East Blvd., Cleveland, OH 44106.
Footnotes
Supported by a grant from the Dermatology Foundation, National Institutes of Health grants P30-AR39750 and R21-CA75201, and Merit Review funding from the Medical Research Service of the Department of Veterans Affairs.
References
- 1.Myers RM, Maniatis T, Lerman LS: Detection and localization of single base changes by denaturing gel electrophoresis. Methods Enzymol 1987, 155:501-527 [DOI] [PubMed] [Google Scholar]
- 2.Hummel M, Ziemann K, Lammert H, Pileri S, Sabattini E, Stein H: Hodgkin’s disease with monoclonal and polyclonal populations of Reed-Sternberg cells. N Engl J Med 1995, 333:901-906 [DOI] [PubMed] [Google Scholar]
- 3.Marks JD, Tristem M, Karpas A, Winter G: Oligonucleotide primers for polymerase chain reaction amplification of human immunoglobulin variable genes and design of family-specific oligonucleotide probes. Eur J Immunol 1991, 21:985-991 [DOI] [PubMed] [Google Scholar]
- 4.Hummel M, Tamaru J, Kalvelage B, Stein H: Mantle cell (previously centrocytic) lymphomas express VH genes with no or very little somatic mutations like the physiologic cells of the follicle mantle. Blood 1994, 84:403-407 [PubMed] [Google Scholar]
- 5.Tamaru J, Hummel M, Zemlin M, Kalvelage B, Stein H: Hodgkin’s disease with a B-cell phenotype often shows a VDJ rearrangement and somatic mutations in the VH genes. Blood 1994, 84:708-715 [PubMed] [Google Scholar]
- 6.Ramasamy I, Brisco M, Morley A: Improved PCR method for detecting monoclonal immunoglobulin heavy chain rearrangement in B cell neoplasms. J Clin Pathol 1992, 45:770-775 [DOI] [PMC free article] [PubMed] [Google Scholar]
- 7.Slack DN, McCarthy KP, Wiedemann LM, Sloane JP: Evaluation of sensitivity, specificity, and reproducibility of an optimized method for detecting clonal rearrangements of immunoglobulin and T-cell receptor genes in formalin-fixed, paraffin-embedded sections. Diag Mol Pathol 1993, 2:223-232 [PubMed] [Google Scholar]
- 8.McCarthy KP, Sloane JP, Wiedemann LM: Rapid method for distinguishing clonal from polyclonal B cell populations in surgical biopsy specimens. J Clin Pathol 1990, 43:429-432 [DOI] [PMC free article] [PubMed] [Google Scholar]
- 9.Berman JE, Mellis SJ, Pollock R, Smith CL, Suh H, Heinke B, Kowal C, Surti U, Chess L, Cantor CR, Alt FW: Content and organisation of the human Ig VH locus: definition of three new VH families and linkage to Ig CH locus. EMBO J 1988, 7:727-738 [DOI] [PMC free article] [PubMed] [Google Scholar]
- 10.Cole-Sinclair M, Foroni L, Wright F, Mehta A, Prentice HG, Hoffbrand AV: Minimal residual disease in acute lymphoblastic leukaemia-PCR analysis of immunoglobulin gene rearrangements. Leuk Lymphoma 1993, 11(suppl 2):49-58 [DOI] [PubMed] [Google Scholar]
- 11.Deane M, Norton JD: Immunoglobulin gene “fingerprinting”: an approach to analysis of B lymphoid clonality in lymphoproliferative disorder. Br J Haematol 1991, 77:274-281 [DOI] [PubMed] [Google Scholar]
- 12.Deane M, Norton JD: Detection of immunoglobulin gene monoclonal rearrangement in B lymphoid malignancies by polymerase chain reaction gene amplification. Br J Haematol 1990, 74:251-256 [DOI] [PubMed] [Google Scholar]
- 13.Wood GS, Warnke R: The immunophenotyping of bone marrow biopsies and aspirates: frozen section techniques. Blood 1982, 59:913-922 [PubMed] [Google Scholar]
- 14.Brady SP, Magro CM, Diaz-Cano SJ, Wolfe HJ: Analysis of clonality of atypical cutaneous lymphoid infiltrates associated with drug therapy by PCR/DGGE. Hum Pathol 1999, 30:130-136 [DOI] [PubMed] [Google Scholar]
- 15.Bouloc A, Delfau-Larue MH, Lenormand B, Meunier F, Wechsler J, Thomine E, Revuz J, Farcet JP, Joly P, Bagot M: Polymerase chain reaction analysis of immunoglobulin gene rearrangements in cutaneous lymphoid hyperplasia. Arch Dermatol 1999, 135:168-172 [DOI] [PubMed] [Google Scholar]
- 16.Bos JD: Skin Immune System. 1990:pp 90-98 CRC Press, Boca Raton, FL,
- 17.Gelb AB, Smoller BR, Warnke RA, Picker LJ: Lymphocytes infiltrating primary cutaneous neoplasms selectively express the cutaneous lymphocyte-associated antigen (CLA). Am J Pathol 1993, 142:1556-1564 [PMC free article] [PubMed] [Google Scholar]
- 18.Yawalkar N, Hunger RE, Pichler WJ, Braathen LR, Brand CU: Human afferent lymph from normal skin contains an increased number of mainly memory/effector CD+4 T cells, expressing activation, adhesion and costimulatory molecules. Eur J Immunol (In press) [DOI] [PubMed]