

Abstract
We report on a generally useful, partially automated, human mutation detection method based upon printing moderate density oligonucleotide arrays using a biorobot on activated nylon membranes. The Beckman Biomek 2000 was adapted to this task through fabrication of aluminum membrane filter holders and the development of an addressable Tool Command Language (Tcl) program, which can be invoked through BioScript. During program execution, a robot arm is moved along the x, y, and z axes to expel liquid, without dripping, from disposable barrier pipette tips and then to touch the drops on preactivated membranes. Printed arrays consist of alternating rows of oligonucleotides containing normal and mutant sequences. Hybridization of biotin labeled polymerase chain reaction products derived from human patient genomic DNA samples are visualized using chemiluminescent or chromogenic indicators. This technique allows unequivocal genotyping of 32 mutations at the β-thalassemia locus (11p15.5) and of 34 mutations and one polymorphism at the cystic fibrosis transconductance membrane regulator locus (7p35).
Reverse dot blot (RDB) or reverse allele specific oligonucleotide (Reverse ASO) hybridization is an important method for genotyping common human mutations. 1, 2, 3 It is especially commonly used in providing diagnostic genotypes in a high mutation spectrum, medium or high frequency disorders such as cystic fibrosis, or in the diagnosis or carrier status assessment of hemoglobin C (HbC), hemoglobin E (HbE), hemoglobin S (HbS), and β-thalassemias. 4, 5, 6, 7, 8, 9, 10, 11, 12 In an RDB procedure, exons (or other regions of interest) are amplified by the polymerase chain reaction (PCR) using labeled oligonucleotide primers. 2 In all of our work, we have used a 5′ biotin label on our PCR primers 13 since we have found that this does not affect the integrity of the amplification reaction. 14 Amplification products (amplicons) are then denatured and allowed to hybridize with mutation specific DNA probes, covalently bound to solid supports. Subsequent to hybridization and washing, bound nucleic acids are incubated with an enzyme conjugated to streptavidin. The bound enzyme-conjugated, streptavidin-biotin-nucleic acid complex is then washed and incubated with a chromogenic or luminogenic substrate, which allows visualization of hybridized spots. Using this method, we can rapidly determine patient genotypes through a systematic examination of signals detected in an array.
We were motivated to automate the production of RDB strips when we observed that array printing constrains the throughput of reverse ASO analytic procedures and that manufacture is relatively slow, tedious, and error prone. Because the position of each probe “dot” in the array is critical for correct genotype assignment, even a small inadvertent error caused by mistaken manual spotting can cause inaccurate genotype assignment. On the other hand, automated printing of the reverse ASO matrix considerably speeds the genotyping process, allows greater quality assurance (QA) and quality control (QC) over required reagents and greatly diminishes the likelihood of human error in diagnostic genotyping.
In this report, we describe a robot-based method for spotting oligonucleotide hybridization probes on solid membrane supports. The spotting is accomplished by programming a Beckman Biomek 2000 robot capable of x, y, and z axis translation to deposit approximately one microliter aliquots of oligonucleotide at each position on a membrane array. The deposit is followed by hybridization with labeled PCR products that can be visualized using chemiluminescent or colorimetric secondary indicators.
Materials and Methods
Specimen Preparation
Total genomic DNA was extracted from peripheral blood leukocytes using a proprietary method (Gentra Generation Capture Column Kit, Minneapolis, MN), according to the manufacturer’s instructions. Amniotic fluid cells or chorionic villi were extracted using salt precipitation (Puregene Kit, Gentra Systems, Minneapolis, MN). After purification, DNA was stored in a buffer containing 10 mmol/L Tris-HCl, 1 mmol/L disodium EDTA, pH 8.0 at 4°C.
Oligonucleotide probes were synthesized using a C6-amino-link phosphoramidite as the final ligand. As a result, the amino moiety was present on the 5′ end of the product. Subsequent to synthesis, oligonucleotide probes were deprotected, purified, spectrophotometrically quantified, and dissolved into a spotting buffer containing 0.5M sodium bicarbonate pH 8.4, 10 mg/ml phenol red, and 0.1% v/v Tween 20. Oligonucleotide stocks were aliquoted and sealed into U-bottom microtiter plates (containing 250 μl of each probe solution) and/or 2 ml deep-well plates. Probes are stored frozen at −20°C. Human β-globin and CFTR probe sequences are detailed in Table 1. An indicator spotwasproduced using 5% v/v black India ink suspension in spotting buffer.
Table 1A.
Human β-Globin Primers
| Primer set | β-Globin primer name | β-Globin primer sequence | Final PCR mix concentration (nmol/L) |
|---|---|---|---|
| Set 1 | CH01 (forward) | 5′-Biotin-GTACGGCTGTCATCACTTAGACCTCA-3′ | 500 |
| PC05 (reverse) | 5′-Biotin-GCTAGTGAACACAGTTGTGT-3′ | 500 | |
| Set 2 | PC03 (forward) | 5′-Biotin-ACACAACTGTGTTCACTAGC-3′ | 500 |
| PC06 (reverse) | 5′-Biotin-TCATTCGTCTGTTTCCCATT-3′ | 500 | |
| Set 3 | CH03 (forward) | 5′-Biotin-GTGTACACATATTGACCAAA-3′ | 500 |
| CH04 (reverse) | 5′-Biotin-AGCACACAGACCAGCACGTT-3′ | 500 |
Table 1B.
Human β-Globin Probes
| Probe name | Location in the β-globin gene | β-globin probe sequence | Final spotting concentration (μmol/L) |
|---|---|---|---|
| −88 (C→T)/−87 (C→G) normal | 5′ UTR | 5′-NH2-GGAGCCACACCCTAG-3′ | 1.0 |
| −88 (C→T) mutation | 5′ UTR | 5′-NH2-ACCCTAGGATGTGGCT-3′ | 0.4 |
| −87 (C→G) mutation | 5′ UTR | 5′-NH2-ACCCTAGCGTGTGGC-3′ | 0.8 |
| −30 (T→C)/−29 (A→G)/−28 (A→G) normal | 5′ UTR | 5′-NH2-GGGCATAAAAGTCAGG-3′ | 1.6 |
| −30 (T→C) mutation | 5′ UTR | 5′-NH2-TGACTTTTGTGCCCAG-3′ | 0.4 |
| −29 (A→G) mutation | 5′ UTR | 5′-NH2-TGACTTTCATGCCCAG-3′ | 0.4 |
| −28 (A→G) mutation | 5′ UTR | 5′-NH2-CCCTGACTTCTATGCCC-3′ | 1.6 |
| Initiation codon (T→G) normal | Initiation codon | 5′-NH2-GGAGCCACACCCTAG-3′ | 1.0 |
| Initiation codon (T→G) mutation | Initiation codon | 5′-NH2-ACAGACACCATGGTGCA-3′ | 1.0 |
| Codon 6 normal | Exon 1 | 5′-NH2-TGACTCCTGAGGAGAAGT-3′ | 0.8 |
| Codon 6 (G→A) HbC (AAG) mutation | Exon 1 | 5′-NH2-CAGACTTCTCCTTAGGAG-3′ | 0.2 |
| Codon 6 (A→T) HbS (GTG) mutation | Exon 1 | 5′-NH2-CAGACTTCTCCACAGGA-3′ | 0.4 |
| Codon 6 delA mutation | Exon 1 | 5′-NH2-AGACTTCTCCCAGGAGT-3′ | 0.1 |
| Codon 8/9 insG normal | Exon 1 | 5′-NH2-AGGAGAAGTCTGCCGTT-3′ | 1.0 |
| Codon 8/9 insG mutation | Exon 1 | 5′-NH2-CGGCAGACCTTCTCCT-3′ | 1.0 |
| Codon 14/15 insG/codon 15(G→A) normal | Exon 1 | 5′-NH2-CTGTGGGGCAAGGTGA-3′ | 0.8 |
| Codon 14/15 insG mutation | Exon 1 | 5′-NH2-CCTGGTGGGGCAAGG-3′ | 1.6 |
| Codon 15 (G→A) mutation | Exon 1 | 5′-NH2-CCTGTAGGGCAAGGTGA-3′ | 1.0 |
| Codon 17 (A→T)/codon 19 (A→G) normal | Exon 1 | 5′-NH2-GTGGGGCAAGGTGAAC-3′ | 1.4 |
| Codon 17 (A→T) mutation | Exon 1 | 5′-NH2-GGGCTAGGTGAACGTG-3′ | 0.6 |
| Codon 19 (A→G) mutation | Exon 1 | 5′-NH2-GGTGAGCGTGGATGA-3′ | 0.4 |
| Codon 24 (T→A) normal | Exon 1 | 5′-NH2-ACCACCAACTTCATCCA-3′ | 0.6 |
| Codon 24 (T→A) mutation | Exon 1 | 5′-NH2-ACCTCCAACTTCATCCA-3′ | 0.4 |
| Codon 26 (G→A)/codon 27/28 insC normal | Exon 1 | 5′-NH2-TGGTGAGGCCCTGG-3′ | 0.4 |
| Codon 26 (G→A) HbE mutation | Exon 1 | 5′-NH2-TTGGTGGTAAGGCCCT-3′ | 0.4 |
| Codon 27/28 insC mutation | Exon 1 | 5′-NH2-GGTGAGGCCCCTGG-3′ | 0.4 |
| IVS 1,1 (G→T) normal | IVS 1 | 5′-NH2-ATACCAACCTGCCCAG-3′ | 0.8 |
| IVS 1,1 (G→T) mutation | IVS 1 | 5′-NH2-CTGGGCAGTTTGGTAT-3′ | 0.6 |
| IVS 1,5 (G→C)/IVS1,6 (T→C) normal | IVS 1 consensus site | 5′-NH2-CCTTGATACCAACCTGC-3′ | 0.8 |
| IVS 1,5 (G→C) mutation | IVS 1 consensus site | 5′-NH2-GCAGGTTGCTATCAAG-3′ | 2.4 |
| IVS 1,6 (T→C) mutation | IVS 1 consensus site | 5′-NH2-CAG GTTGGCATCAAGGT-3′ | 2.4 |
| IVS 1,110 (G→A) normal | IVS 1 | 5′-NH2-GAAAATAGACCAATAGGCAGA-3′ | 1.4 |
| IVS 1,110 (G→A) mutation | IVS 1 | 5′-NH2-CTGCCTATTAGTCTATTTTC-3′ | 1.2 |
| Codon 35 (C→A)/codon 35 delC normal | Exon 2 | 5′-NH2-GGTGGTCTACCCTTGG-3′ | 0.8 |
| Codon 35 (C→A) mutation | Exon 2 | 5′-NH2-GGTCCAAGGTTAGACCA-3′ | 1.2 |
| Codon 35 delC mutation | Exon 2 | 5′-NH2-GGGTCCAAGGTAGACC-3′ | 0.8 |
| Codon 39 (C→T) normal | Exon 2 | 5′-NH2-CTTGGACCCAGAGGTTCTT-3′ | 0.8 |
| Codon 39 (C→T) mutation | Exon 2 | 5′-NH2-AGAACCTCTAGGTCCAAGG-3′ | 0.8 |
| Codon 41/42 delTCCT/codon 43(G→T) normal | Exon 2 | 5′-NH2-CAGAGGTTCTTTGAGTCCTT-3′ | 0.8 |
| Codon 41/42 delTCCT mutation | Exon 2 | 5′-NH2-CAAAGGACTCAACCTCTGG-3′ | 0.8 |
| Codon 43 (G→T) mutation | Exon 2 | 5′-NH2-CCCAGAGGTTCTTTTAGTC-3′ | 0.4 |
| Codon 71/72 insA normal | Exon 2 | 5′-NH2-TCGGTGCCTTTAGTGAT-3′ | 1.0 |
| Codon 71/72 insA mutation | Exon 2 | 5′-NH2-GGTGCCTTTAAGTGATG-3′ | 1.0 |
| IVS 2,1 (G→A) normal | IVS 2 splice junction | 5′-NH2-AACTTCAGGGTGAGTCTAT-3′ | 0.4 |
| IVS 2,1 (G→A) mutation | IVS 2 splice junction | 5′-NH2-CTTCAGGATGAGTCTATGG-3′ | 0.4 |
| IVS 2,654 (C→T) normal | IVS 2 | 5′-NH2-GGGTTAAGGCAATAGCAAT-3′ | 0.4 |
| IVS 2,654 (C→T) mutation | IVS 2 | 5′-NH2-ATTGCTATTACCTTAACCC-3′ | 0.6 |
| IVS 2,745 (C→G) normal | IVS 2 | 5′-NH2-CAATCCAGCTACCATTC-3′ | 1.6 |
| IVS 2,745 (C>G) mutation | IVS 2 | 5′-NH2-GAATGGTACCTGGATTG-3′ | 1.6 |
| IVS 2,848 (C→A)/IVS 2,849 (A→G) normal | IVS 2 consensus site/splice junction | 5′-NH2-GGAGCTGTGGGAGGA-3′ | 0.8 |
| IVS 2,848 (C→A) mutation | IVS 2 consensus site | 5′-NH2-CTCCCAAAGCTCCTGG-3′ | 0.6 |
| IVS 2,849 (A→G) mutation | IVS 2 splice junction | 5′-NH2-CTCCCACGGCTCCTG-3′ | 0.3 |
Table 1C.
Human Cystic Fibrosis Transconductance Regulator Primers
| Multiplex number | Cystic fibrosis mutations tested | Cystic fibrosis primer name | Cystic fibrosis primer sequence | Final PCR mix concentration (nmol/L) |
|---|---|---|---|---|
| Multiplex II | G85E, G91R, P67L | CF3-F | 5′-Biotin-CTTGGGTTAATCTCCTTGGA-3′ | 200 |
| CF3-R | 5′-Biotin-ATTCACCAGATTTCGTAGTC-3′ | 200 | ||
| Multiplex I | Y122X,R117H, 621+1 | CF4-F | 5′-Biotin-TCACATATGGTATGACCCTC-3′ | 200 |
| CF4-R | 5′-Biotin-TTGTACCAGCTCACTACCTA-3′ | 200 | ||
| Multiplex II | Y122X, R117H, 621+1 | CF4S-F | 5′-Biotin-GTGAGGACACTGCTCCTACA C-3′ | 200 |
| CF4S-R | 5′-Biotin-TTGTACCAGCTCACTACCTA-3′ | 200 | ||
| Multiplex II | 711+1 | CF5-F | 5′-Biotin-ATTTCTGCCTAGATGCTGGG-3′ | 200 |
| CF5-R | 5′-Biotin-AACTCCGCCTTTCCAGTTGT-3′ | 200 | ||
| Multiplex I, Multiplex II | R334W, R347P, R347H, R347L | CF7-F | 5′-Biotin-AGACCATGCTCAGATCTTCCAT-3′ | 200 |
| CF7-R | 5′-Biotin-GCAAAGTTCATTAGAACTGATC-3′ | 200 | ||
| Multiplex III | A455E | CF9-F | 5′-Biotin-TAATGGATCATGGGCCATGT-3′ | 200 |
| CF9-R | 5′-Biotin-ACAGTGTTGAATGTGGTGCA-3′ | 200 | ||
| Multiplex III | ΔF508, 508C, ΔI507, Q493X, V520F | CF10-F | 5′-Biotin-GCAGAGTACCTGAAACAGGA-3′ | 200 |
| CF10-R | 5′-Biotin-CATTCACAGTAGCTTACCCA-3′ | 200 | ||
| Multiplex I | G542X, R553X, G551D, 1717-1, R560T, S549R, S549N, G551S | CF11-F | 5′-Biotin-CAACTGTGGTTAAAGCAATAGTGT-3′ | 200 |
| CF11-R | 5′-Biotin-GCACAGATTCTGAGTAACCATAAT-3′ | 200 | ||
| Multiplex I | 1898+1 | CF12-F | 5′-Biotin-GTGAATCGATGTGGTGACCA-3′ | 200 |
| CF12-R | 5′-Biotin-CTGGTTTAGCATGAGGCGGT-3′ | 200 | ||
| Multiplex II | 2789+5 | CF14B-F | 5′-Biotin-GGGAGGAATAGGTGAAGATG-3′ | 200 |
| CF14B-R | 5′-Biotin-CCACTACCATAATGCTTGGG-3′ | 200 | ||
| Multiplex I | 3659 del C, R1162X | CF19-F | 5′-Biotin-GCCCGACAAATAACCAAGTGA-3′ | 200 |
| CF19-R | 5′-Biotin-GCTAACACATTGCTTCAGGCT-3′ | 200 | ||
| Multiplex II | W1282X, 3905 insT, D1270N, S1255X | CF20-F | 5′-Biotin-TGGGCCTCTTGGGAAGAACT-3′ | 200 |
| CF20-R | 5′-Biotin-CTCACCTGTGGTATCACTCC-3′ | 200 | ||
| Multiplex II | N1303K | CF21-F | 5′-Biotin-GGTAAGTACATGGGTGTTTC-3′ | 200 |
| CF21-R | 5′-Biotin-CAAAAGTACCTGTTGCTCCA-3′ | 200 | ||
| Multiplex II | 3849+10 kb | CF19i-F | 5′-Biotin-AGGCTTCTCAGTGATCTGTTG-3′ | 200 |
| CF19i-R | 5′-Biotin-GAATCATTCAGTGGGTATAAGCA-3′ | 200 |
Table 1D.
Human Cystic Fibrosis Transconductance Regulator Probes
| Probe name | Location in the CFTR gene | CFTR probe sequence | Final spotting concentration (μmol/L) |
|---|---|---|---|
| ΔF508-N | Exon 10 | 5′-NH2-GAAACACCAAAGATGATA-3′ | 5.0 |
| ΔF508-MUT | Exon 10 | 5′-NH2-GGAAACACCAATGATATT-3′ | 5.0 |
| F508C-MUT | Exon 10 | 5′-NH2-GGAAACACCACAGATGATA-3′ | 5.0 |
| ΔI507-MUT | Exon 10 | 5′-NH2-AACACCAAAGATATTTTCT-3′ | 5.0 |
| G542X-N | Exon 11 | 5′-NH2-TATAGTTCTTGGAGAAGGTG-3′ | 5.0 |
| G542X-MUT | Exon 11 | 5′-NH2-TATAGTTCTTTGAGAAGGTG-3′ | 5.0 |
| R553X-N | Exon 11 | 5′-NH2-GAGGTCAACGAGCAAG-3′ | 5.0 |
| R553X-MUT | Exon 11 | 5′-NH2-TCTTGCTCATTGACCTC-3′ | 5.0 |
| 1717-1-N | Exon 11 | 5′-NH2-TGGTAATAGGACATCTC-3′ | 6.7 |
| 1717-1-MUT | Exon 11 | 5′-NH2-TG GAG ATG TCT TAT TAC-3′ | 6.7 |
| R560T-N | Exon 11 | 5′-NH2-TCTTTAGCAAGGTGAATAA-3′ | 5.0 |
| R560T-MUT | Exon 11 | 5′-NH2-AGTTATTCACGTTGCTAA-3′ | 5.0 |
| S549N-N | Exon 11 | 5′-NH2-GTTGACCTCCACTCAG-3′ | 5.0 |
| S549N-MUT | Exon 11 | 5′-NH2-TCACACTGAATGGAGG-3′ | 5.0 |
| W1282X-N | Exon 20 | 5′-NH2-GCTTTCCTCCACTGTTG-3′ | 3.3 |
| W1282X-MUT | Exon 20 | 5′-NH2-CAACAGTGAAGGAAAGC-3′ | 3.3 |
| R334W-N | Exon 7 | 5′-NH2-ATCATCCTCCGGAAAAT-3′ | 7.7 |
| R334W-MUT | Exon 7 | 5′-NH2-ATTTTCCAGAGGATGATT-3′ | 7.7 |
| R1162X-N | Exon 19 | 5′-NH2-TTAAAGACTCGGCTCA-3′ | 3.7 |
| R1162X-MUT | Exon 19 | 5′-NH2-TAAAGACTCAGCTCACA-3′ | 5.0 |
| 3659DC-N | Exon 19 | 5′-NH2-TGACTTGGTAGGTTTAC-3′ | 3.7 |
| 3659DC-MUT | Exon 19 | 5′-NH2-TGACTTGTAGGTTTACC-3′ | 5.0 |
| N1303K-N | Exon 21 | 5′-NH2-AGAAAAAACTTGGATCC-3′ | 7.5 |
| N1303K-MUT | Exon 21 | 5′-NH2-GGGATCCAACTTTTTTCT-3′ | 7.5 |
| 621+1-N | Exon 4 | 5′-NH2-TTATAAGAAGGTAATACTTCC-3′ | 1.1 |
| 621+1-MUT | Exon 4 | 5′-NH2-AGGAAGTATTAACTTCTTATAA-3′ | 1.5 |
| R117H-N | Exon 4 | 5′-NH2-ATAGAGCGTTCCTCCT-3′ | 4.3 |
| R117H-MUT | Exon 4 | 5′-NH2-ATAGAGTGTTCCTCCTT-3′ | 5.9 |
| Y122X-N | Exon 4 | 5′-NH2-TATCGCGATTTATCTAGG-3′ | 10 |
| Y122X-MUT | Exon 4 | 5′-NH2-ATGCCTAGTTAAATCGCG-3′ | 10 |
| Y122X-MUT+2 bases | Exon 4 | 5′-NH2-TATGCCTAGTTAAATCGCGA-3′ | 10 |
| 2789+5-N | Exon 14b | 5′-NH2-ACATGGAATACTCACTTT-3′ | 5.0 |
| 2789+5-MUT | Exon 14b | 5′-NH2-CTTGGAAAGTGAATATTC-3′ | 5.0 |
| 1898+1-N | Exon 12 | 5′-NH2-TTCAAAGAACATACCTTTC-3′ | 7.5 |
| 1898+1-MUT | Exon 12 | 5′-NH2-TATTTGAAAGATATGTTCTT-3′ | 6.7 |
| G85E-N | Exon 3 | 5′-NH2-AAAAGATTCCATAGAACAT-3′ | 7.5 |
| G85E-MUT | Exon 3 | 5′-NH2-TATGTTCTATGAAATCTTTT-3′ | 7.5 |
| Q493X-N | Exon 10 | 5′-NH2-TCTGTTCTCAGTTTTCC-3′ | 10.0 |
| Q493X-MUT | Exon 10 | 5′-NH2-CAGGAAAACTAAGAACAGAAT-3′ | 5.0 |
| G91R-N | Exon 3 | 5′-NH2-TTATATTTAGGGGTAAGGA-3′ | 10.0 |
| G91R-MUT | Exon 3 | 5′-NH2-TTTATATTTAAGGGTAAGGA-3′ | 7.5 |
| P67L-N | Exon 3 | 5′-NH2-AAGAAAAATCCTAAACTCAT-3′ | 2.9 |
| P67L-MUT | Exon 3 | 5′-NH2-AAGAAAAATCTTAAACTCATT-3′ | 4.2 |
| 711+1-N | Exon 5 | 5′-NH2-AATTTGATGAAGTATGTACC-3′ | 2.9 |
| 711+1-MUT | Exon 5 | 5′-NH2-AGGTACATAATTCATCAAAT-3′ | 2.9 |
| R347P-N | Exon 7 | 5′-NH2-ATTGTTCTGCGCATGG-3′ | 5.0 |
| R347P-MUT | Exon 7 | 5′-NH2-CATTGTTCTGCCCATGGC-3′ | 5.0 |
| R347H-MUT | Exon 7 | 5′-NH2-CATTGTTCTGCACATGGC-3′ | 3.3 |
| R347L-MUT | Exon 7 | 5′-NH2-TGTTCTGCTCATGGCG-3′ | 5.0 |
| A455E-N | Exon 9 | 5′-NH2-AGTTGTTGGCGGTTGCT-3′ | 5.0 |
| A455E-MUT | Exon 9 | 5′-NH2-CAGCAACCTCCAACAAC-3′ | 5.0 |
| V520F-N | Exon 10 | 5′-NH2-TACAGAAGCGTCATCAA-3′ | 3.1 |
| V520F-MUT | Exon 10 | 5′-NH2-GCTTTGATGAAGCTTCT-3′ | 5.0 |
| G551D-N | Exon 11 | 5′-NH2-TCGTTGACCTCCACT-3′ | 14.2 |
| G551D-MUT | Exon 11 | 5′-NH2-ACTGAGTGGAGATCAA-3′ | 6.7 |
| G551S-N | Exon 11 | 5′-NH2-GAGTGGAGGTCAACGA-3′ | 6.7 |
| G551S-MUT | Exon 11 | 5′-NH2-GAGTGGAAGTCAACGAG-3′ | 5.0 |
| S549R-MUT | Exon 11 | 5′-NH2-TTGACCTCCCCTCAGT-3′ | 5.0 |
| 3849+10kb-N | Intron 19 | 5′-NH2-ATAAAATGGCGAGTAAGA-3′ | 16.7 |
| 3849+10kb-MUT | Intron 19 | 5′-NH2-TGTCTTACTCACCATTTTAT-3′ | 10.0 |
| D1270N-N | Exon 20 | 5′-NH2-CCAGATCGATGGTGTG-3′ | 2.1 |
| D1270N-MUT | Exon 20 | 5′-NH2-TCCAGATCAATGGTGTG-3′ | 3.3 |
| S1255X-N | Exon 20 | 5′-NH2-CTTTGTTATCAGCTTTTTT-3′ | 5.0 |
| S1255X-MUT | Exon 20 | 5′-NH2-ACTTTGTTATAAGCTTTTTT-3′ | 2.5 |
| 3905insT-N | Exon 20 | 5′-NH2-AGTAGTCTCAAAAAAGCT-3′ | 3.3 |
| 3905insT-MUT | Exon 20 | 5′-NH2-ATCAGCTTTTTTTGAGAC-3′ | 3.3 |
Membrane Washing Procedure
Preactivated, 8.5 x 11-inch, 0.45-μm nylon, Immunodyne ABC membrane was obtained from Pall Corporation (East Hills, NY) (Part No. BC045H2721). Subsequent to spotting, membranes were air dried and then immersed in excess 0.1N NaOH with agitation for twenty minutes. The membranes were then washed three times for 5 minutes each in reagent grade water. They were then permitted to air dry before being trimmed for use. Strips were stored desiccated for up to 6 months at −10°C before use.
CFTR amplifications took place in 50-μl reactions containing 1 × Stoffel buffer (10 mmol/L KCl, 10 mmol/L Tris-HCl, pH 8.3), 5 mmol/L MgCl2 (Multiplex I) and 6 mmol/L MgCl2 (Multiplex II and Multiplex III), 200 μmol/L each of dNTP, 10 pmol of each primer, 0.9 μl Taq Start antibody and 6.6 units of AmpliTaq DNA polymerase, Stoffel fragment. PCR primers for the three cystic fibrosis multiplex reactions are detailed in Table 1 .
Thermocycling conditions were uniform for the three multiplexes and include an initial denaturation step at 94°C for 7 minutes, followed by 35 cycles of denaturation at 94°C for 30 seconds, annealing at 57°C for 30 seconds and polymerization at 72°C for 1 minute. Cycling culminated with a final extension at 72°C for 10 minutes.
β-Globin gene amplifications took place in 25-μl reactions containing: 1X PCR buffer B; (15 mmol/L (NH4)2SO4, 2 mmol/L MgCl2, 60 mmol/L Tris-HCl pH 8.5), 200 μmol/L each dNTP, 0.125 μg each primer, and 0.5 units of Taq polymerase. PCR primers for the three β-thalassemia PCR reactions are detailed in Table 1 . Thermocycling conditions were identical for the three primer pair sets and included an initial denaturation step at 94°C for 5 minutes, followed by 35 cycles of denaturation at 95°C for 15 seconds, annealing at 55°C for 30 seconds, and polymerization at 72°C for 45 seconds. Cycling culminated with a final extension at 72°C for 10 minutes.
CFTR Genotyping, Hybridization, and Visualization
Pooled amplicons from the three multiplex PCRs were added to membranes pre-wet with hybridization buffer (2X saline sodium citrate (SSC), 0.1% sodium dodecyl sulfate (SDS) at 42°C. The amplicons and membranes were boiled and permitted to hybridize for at least 3 hours at 42°C. Hybridization solutions were poured off and membranes were washed twice in an excess of wash buffer (0.75 × SSC, 0.1% SDS). Membranes were then agitated in a freshly prepared conjugate solution (1:4000 dilution of streptavidin-horseradish peroxidase conjugate,Boehringer Mannheim, Part No. 1089153, in 0.5X SSC, 0.1% SDS) for 30 minutes at room temperature. At the end of the incubation, membranes were washed three times for 3 minutes each with 0.5X SSC, 0.1% SDS; then twice for three minutes each with 0.1 mol/L sodium citrate, pH 5.0. The strips were then exposed to 0.01% w/v tetramethylbenzidine dihydrochloride (TMB) substrate (Sigma T-8768) in a freshly prepared, very dilute solution of hydrogen peroxide (0.00225% v/v) in 0.1M sodium citrate pH 5.0 with agitation for 10 to 20 minutes in the dark. Color development was stopped by rinsing the strips four times with deionized water for 3 minutes each. Results were recorded photographically while the strips were wet.
β-Globin Genotyping, Hybridization, and Visualization
Pooled amplicons from the three β-globin PCR sets were added to membranes pre-wet with hybridization buffer (2 × SSC, 0.1% SDS) at 42.3°C. The amplicons and membranes were boiled and permitted to hybridize for one hour at 42.3°C in a shaking water bath. Amplicon containing hybridization solution was poured off and membranes were washed twice for 5 minutes each in an excess of hybridization buffer, followed by two final washes for 10 minutes each in 0.5 × SSC, 0.1% SDS at 42.3°C in a shaking water bath. Strips were then agitated in a blocking buffer (17 mmol/L Na2HPO4, 8 mmol/L NaH2PO4,125 mmol/L NaCl, 5% SDS, pH 7.2) for 10 minutes at ambient temperature. This was followed by an incubation with a freshly prepared streptavidin-alkaline phosphatase conjugate solution (1:2000 dilution of streptavidin-alkaline phosphatase conjugate [New England Biolabs, CDP Star Kit] in blocking buffer) for 5 minutes at room temperature. At the end of the incubation, membranes were washed three times in 100 mmol/L NaCl, 10 mmol/L MgCl2, and 100 mmol/L Tris-HCl, pH 9.5 for five minutes each. The remainder of luminescent detection was done in accordance with the CDP Star Kit manufacturer’s instructions.
The Beckman Biomek 2000 was purchased from Beckman Instruments Corporation (Fullerton, CA). Included in the purchase were: a P20 single-tip pipette tool, an MP20 eight-tip pipette tool, a P200L single-tip pipette tool, an MP200 eight-tip pipette tool, and a P1000L single-tip pipette tool. Also purchased were the left and right side modules, a systems controller computer, the tip disposal optional software and Bioworks operating system.
Membrane holders were fabricated from 0.100- and 0.150-inch thick milled aluminum, as described in the text. Pipette tips were purchased from Beckman and were prepared for spotting by removing and discarding seven tips from the ninth row of the tip container. The programs described in this manuscript have been deposited in the Indiana University Bioarchive ftp site indexed at http://iubio.bio.indiana.edu/. The Beckman Biomek was programmed using Tool Command Language (Tcl) 15 containing some Biomek-specific machine commands.
Image analysis was conducted using 16-bit TIFF files obtained through high resolution (600 pixels) scanning of photographs of stained membranes. These were saved as grayscale images and adjusted to 640 pixels horizontal to prepare them for the Scion Image version of NIH Image. Further information about this freely distributed program is available at http://rsb.info.nih.gov/nih-image/. Ninety manual and 90 automated spots were imaged and measured using a Look Up Table (LUT) which ranged from 0 (no color) to 255 (black). Five unhybridized regions were analyzed and averaged to provide a background for each blot. Differences between background and LUT values were calculated and summed to provide the statistics in Table 2 . Size measurements were done by micrometer measurement directly against spotted, developed nylon strips.
Table 2.
Cystic Fibrosis Spot Diameter and Intensity Comparison
| Manually spotted | Robotically spotted | ||
|---|---|---|---|
| Mean pixels | C.V. (%) | Mean pixels | C.V. (%) |
| 65.3 | 54 | 62.6 | 42 |
| Mean diameter (mm) | C.V. % | Mean diameter (mm) | C.V. % |
|---|---|---|---|
| 3.3 | 14 | 4.5 | 11 |
Ninety cystic fibrosis spots of each type were measured via micrometer and using the Look Up Table of the Scion Image version of the NIH Image program to derive the spot intensity comparisons described above.
Results
Aluminum membrane holders were fabricated with machine holes that match pinions at specific positions within microwell plate stations on the deck of the biorobot work surface. The machine hole and pinion placements allow 8.5 x 11-inch preactivated sheets of Immunodyne ABC membrane to fit securely on the work surface. A washable rubber mat lies beneath the activated nylon membrane sheet during printing. Photographs and schematic diagrams of the fabricated membrane holders are shown in Figure 1 . In Figure 1A , the membrane holder originally machined for the 64 β-thalassemia RDB array is shown. Figure 1B shows the membrane holder fabricated to accommodate an array that interrogates 34 CFTR mutations and one polymorphism. After several weeks of operation, we observed warping of the relatively thin aluminum used for fabrication of the β-thalassemia RDB array (approximately 0.100 inch). This convinced us that a thicker grating would be required in the fabrication of future membrane holders. As a consequence, the CF membrane holder was milled to a thickness of 0.150 inch. This has mitigated the warping problem observed with the β-thalassemia strip membrane holder. Detailed blueprints with dimensions for the membrane holder tools are provided in Figure 1C , for the CFTR RDB array; and in Figure 1D , for the β-thalassemia RDB array.
Figure 1.

Blueprints and photographs of custom fabricated aluminum membrane holders. A: The membrane holder for the β-thalassemia printing array has three chambers, each with enough area to print eight arrays, each screening for 32 mutations. In sum, RDB arrays representing 24 patients are printed per 8.5 x 11-inch sheet of Immunodyne ABC. B: This is the membrane holder for the cystic fibrosis assay; note the two chambers, each capable of hosting 10 CF arrays. One 8.5 x 11-inch sheet can therefore supply arrays sufficient to genotype 20 patients at the CFTR locus. C: Blueprint of the original β-thalassemia membrane holder tool, compatible with the Biomek 2000. This was fabricated from approximately 0.100“ aluminum at Beckman Instruments, Inc., in Fullerton, CA. After a short period of use, we noticed that some warping had occurred as a consequence of the relatively thin aluminum used; therefore, a new cystic fibrosis membrane holder (blueprint at D) was fabricated from thicker aluminum, milled to 0.150 inch.
Figure 2provides an overview of the Biomek in the process of printing β-thalassemia arrays. The MP200 pipette tool on the robot allows mounting eight pipette tips simultaneously. After the preactivated Immunodyne ABC membrane is manually placed within the membrane holder, the Bioworks program can be initiated. The Tcl program, called from BioScript, first prints eight equidistant spots; the program then re-aligns the eight-channel mechanical pipettor so that the subsequent eight spots are pipetted between the previous set of eight spots. The program continues as described in the legends to Figures 2 and 3 .
Figure 2.

Photograph of the Biomek 2000 printing β-thalassemia arrays. The MP200’s largest pipetting tool on the Biomek allows mounting eight tips simultaneously and pipetting these repetitively. After mounting the preactivated Immunodyne ABC membrane within the membrane holder borders, the Tcl program first prints eight equidistant spots; the program then re-aligns the eight-channel mechanical pipettor. The subsequent eight spots are pipetted between the previous set of eight spots. The pipettor is then reset to an incremented initial orientation, one row further down the array, so that the next eight-spot row will appear adjacent to, but clearly demarcated from, the initial eight-spot row. Interspersing of spots between the next row of eight spots is again achieved as noted above. This procedure is repeated for two subsequent rows of spots. Each array consists of four rows, where normal and mutant oligonucleotides in the array alternate.
Figure 3.
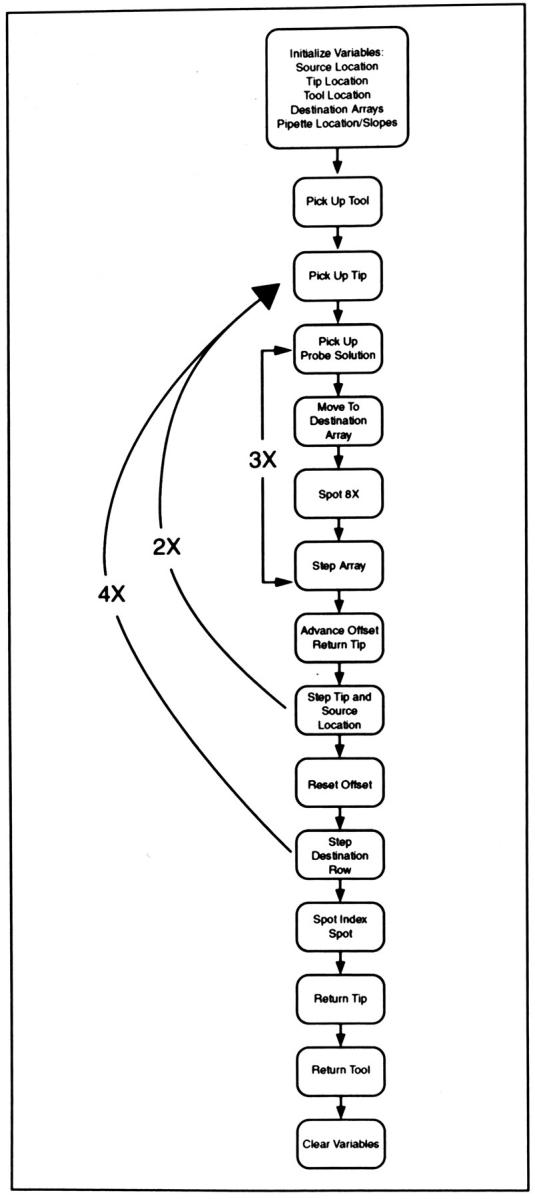
Flow chart for RDB spotting Tcl script. After initialization, the core of the program consists of three nested loops which are recursively executed. As illustrated in this diagram, tip pick-up, the move to probe solution, and the move to the destination array are the essential steps for printing; these are followed by a reorientation step, an incremental advance in orientation, and a repeated tip pick-up and printing procedure. Finally, when array printing is complete, an index spot, consisting of India ink, is printed, as described in Materials and Methods. This index spot allows for orientation of the RDBs after an NaOH wash and air drying.
The flow chart shown in Figure 3 provides a representation of robot activity during the spotting procedure. At initialization, the robot arm is oriented at origin and source location, tip location, tool location, destination array locations, and pipette locations with the slopes required to provide pick-up specified. The robotic arm then mounts the eight-tip tool and sufficient barrier tips to pipette adequate solution for the spotting of one row of strips in the 8.5 x 11-inch array. The mechanical arm then moves to the destination coordinates and dispenses a small amount (approximately 1 μl of solution) onto the tip of the pipette, which is then lowered exactly onto the membrane and then rapidly raised. The destination of the robot arm is then directed to the next corral. x-y axis movement resumes after reloading oligonucleotides. Reorientation to a new corral occurs twice in the β-thalassemia procedure, but only once in the CF printing procedure, consistent with the number of chambers in each membrane holder tool.
Patient specimens presented for cystic fibrosis genotyping at Quest Diagnostics (Los Angeles, CA) until mid-2000 were routinely evaluated for 34 mutations and one polymorphism. From 1996 to 1999, this was done using three reverse dot blot strips that were manually prepared in a three-strip array, the schematic of which is shown in Figure 4 (C, schematic of the three manual strips). The PCR reactions are highly, though not completely, multiplexed so that one patient’s CF gene can be evaluated in three separate PCR reaction tubes. Our efforts to completely multiplex the PCR reactions were not successful. Amplicons are then pooled and denatured before hybridizing to the three reverse dot blot strips, as shown in Figure 4A . This panel contains one patient set of three reverse dot blot strips. This manually printed reverse dot blot has been determined to be that of a G542X/normal heterozygote. The comparable machine printed RDB strip is shown in Figure 4B .
Figure 4.

Photographs and schematics of cystic fibrosis genotyping colorimetric RDB strips. Specimens undergoing cystic fibrosis genotyping at Quest Diagnostics are routinely evaluated for 34 mutations and one polymorphism. In the past, this was accomplished using a three strip array of manually prepared reverse dot blot strips, the schematic of which is shown in C. The PCR reactions are highly, though not completely, multiplexed so that one patient’s CF gene can be evaluated by three separate PCR reactions. In both the old and new procedures, amplicons are pooled and denatured before hybridizing to reverse dot blot strips as described in Materials and Methods. A contains one patient set of three manually printed reverse dot blot strips. The patient shown is a G542X/normal heterozygote. B shows the comparable machine printed RDB strip. C and D provide layout maps of the array for the three manually printed strips and for the single, robot printed strip, respectively.
Automated printing provided an opportunity to simplify layout of the CF RDB strips. This involved a rearrangement of the 35 probed loci into alternating normal and mutant rows respectively. Normal RDBs were not repetitively spotted on automated, printed strips, so that the hybridization signal would not be reduced by the presence of different amounts of normal amplicon as the hybridization proceeded (Figure 4D is a schematic of the new RDB array for CF with duplicated normal spots removed; entirely blackened dots represent regions where no DNA was spotted). As can be seen from the automated printing of the CF reverse dot blot strip, in Figure 4B , as compared with Figure 4A , spots are now more uniform. Less volume is used for machine versus manual spotting, thereby representing an economy of oligonucleotide probe achieved through use of the automated process. In addition, batch sizes of strips are larger and more accurate than can be manually produced.
Spot-to-spot variability was measured using two different techniques. The first was to measure spot diameter, using a micrometer, as this is proportional to the amount of each nucleotide spotted. 16 Diameter measurements resulted in a coefficient of variation of 14% for the manual spots and 11% for the Biomek spots. The NIH Image Analysis program was also used to judge differences in spot intensity between manual and machine manufactured arrays. This method demonstrated greater consistency in average image density using the Biomek (Table 2) .
Biomek barrier tips are prepared for printing by removing the lower seven tips in the tenth row. This provides a way for the (normally) eight tip-based MP20 tool, to print the single India ink orientation or index spot. If the tips were not removed, a tool change to a single tip tool or a risk of confounding the clean strip preparation with microwell plate-bound contaminants might exist.
Included in the bicarbonate buffered oligonucleotide spotting mix is a phenol red indicator. The presence of indicator allows the robot operator a rapid method to monitor missed or incorrectly oriented oligonucleotide spots. Missed spots are not a frequent occurrence. When these do occur, however, they can be manually corrected because the phenol red marks missed positions in the array. On one occasion, we observed incorrectly oriented angular arrays with overlapping spots. These proved to be an indication of wear on one robot cable, which was constraining free movement of the robot arm. Although an error correcting feedback loop might have prevented this problem, our troubleshooting revealed that the error correction system does not function while running a Tcl script. Thus, the indicator dye is useful because it allows direct observation of array symmetry and an early warning of problem print runs.
Each strip requires an index or orientation spot because of its symmetry. Otherwise, the array could be mistakenly oriented and mutant miscalls could result. The problem of an index spot has been solved by using a dilute suspension of India ink in spotting buffer. This allows printing an index spot which survives subsequent washing and visualization steps in both the chemiluminescent and the colorimetric procedures.
A 9-pin serial port connection between the Beckman BioRobot and the controlling computer allows each step in the spotting process to be monitored. The robot microprocessor, located on semiconductor panels within the Biomek, records command completion and issues acknowledgment to the controller computer, using a 9600-band serial port. Thus, robot action can be monitored in a terminal emulator program window in the controller computer screen.
Increasing Amounts of Probe Allow Increases in Signal Intensity
From the outset of engineering the reverse dot blot, two approaches were conceived to improve signal strength from refractory hybridization of multiplex PCR products at a given ionic strength. The first approach, taken in perfecting manually spotted strips, is to alter the amino-conjugated probe sequence to provide improved hybridization between these and interrogated, labeled PCR products. The second approach is to seek improved saturation of probe coating on the solid-support and thereby use the law of mass action to improve the signal strength. As can be seen in Figure 5 , an experiment aimed at titrating probe attached to a solid support against uniform amounts of single amplicon was successful. Amino-link conjugated oligonucleotides spotted at 1, 3.3, 5, 20, 50, and 100 μmol/L show an increasingly strong signal. This demonstrated the feasibility of using increasing concentrations of a single probe to improve signal strength. Experiments were then carried out which were intended to optimize signal strength for each probe.
Figure 5.

Titration of Y122X probe against normal amplicon. Amplicons were prepared from patient DNA known to be normal at the Y122X cystic fibrosis locus. These were hybridized against a handmade strip, spotted with increasing concentrations of complementary probes, the mutant probe differing by one bp from the normal reverse complement. The Y122X-M + 2 probe differs from the normal by two additional nucleotides, one at each of its ends. Sequences are provided in Table 1 . As can be observed in the figure, signal response is proportional to probe concentration for the normal (upper) probe, up to a concentration of 50 μmol/L. Separate experiments have shown that phosphate buffer is an obligate requirement for amino-conjugated oligonucleotide binding to Immunodyne ABC (data not shown). The authors chose a concentration of 10 μmol/L to optimize the signal-to-noise ratio at the Y122X locus, though some oligonucleotide batch variation has been observed.
As indicated in Figures 2 and 6 , β-thalassemia RDB matrices are spotted on a large activated membrane. Three columns of eight membranes (each with 64 probes, for a total of 32 mutable sites interrogated) are spotted on 8.5 x 11-inch sheets. We print a black index spot to reference the relative position of each strip. The black spot appears as an unexposed region when the film is developed after exposure to chemiluminescent substrate. Sample β-thalassemia reverse dot blot arrays are shown in Figure 6 . Because of the complexity of the array, manual spotting, though achievable, is less accurate than the mechanized method demonstrated here. Thirty-two mutations are analyzed in this reverse dot blot method, which provides a 95% worldwide detection rate for β-thalassemia. The developed strips in Figure 6 , A and B, are from the same ivs 2,1/negative heterozygote. The strips in Figures 6A and 6C were manually spotted, while those in Figures 6B and D were printed by the robot. Figure 6C and D, strips were each hybridized with amplification products from the same patient who is affected with sickle cell disease.
Figure 6.

Comparison of manually and robot printed β-thalassemia reverse dot blot strips. Four developed strips resulting from chemiluminescent visualization of β-thalassemia RDBs are shown. Two of these, A and C, were printed manually, while B and D were printed using the Biomek biorobot as discussed in the text. In addition, E is a schematic map which provides reference for the locations of probes printed within the array. A and B resulted from hybridizing amplicons from an ivs 2,1 G > A/normal heterozygous patient; C and D resulted from hybridization against amplifications primed with DNA from an HbS homozygous patient. Note the unexposed reference spot visible in the bottom right corner of B and D.
Discussion
Inspiration for automating the printing of RDB arrays was a result of the requirement to provide definitive genotype assignments for the patients. These assignments must be accurate, reproducible and relatively inexpensive. Automating the most tedious and critical part of the process, the printing of the RDB arrays, appeared to us the most expeditious way to accomplish the objective of mechanizing genotype assignments generally.
In the course of refining the process for automated RDB printing, we encountered several technique simplifications that improved the readability of our array. Among these are inclusion of a low concentration of non-ionic detergent in our spotting mixture to improve oligonucleotide distribution on the membrane; programming the deposit of 1 μl drop of liquid on the pipette tip before touch-down to spot; and providing a diluted India ink index spot to orient the membrane or autoradiograph subsequent to visualization.
A method of dispensing a small amount of liquid onto the pipette tips followed by touch-down onto the membrane allowed a more regular distribution of oligonucleotide on the membrane. Initially the program was designed to bring the tool directly onto the surface of the membrane, with a minimum tolerance between membrane and pipette tip, and eject the oligonucleotide-containing buffer directly onto the membrane. However, this technique gave rise to three problems: variability in the tautness of the membrane sitting within the holder yielded a lack of uniformity in spot diameter; occasionally, the presence of the tip tool caused indentations in the membrane; and we observed a halo effect in developed reverse dot blots, which we believe resulted from uneven distribution of oligonucleotide on the membrane. Each of these problems was ameliorated or completely resolved by a combination of adding Tween 20 detergent to the oligonucleotide mixture and re-writing the program so that a small amount of liquid was extruded and left hanging at the lower end of the tips, followed by a gentle touch-down and rapid pull away from the membrane by the robot tip holder. This method was called touch-down pipetting. As a result, strips with the clarity of those shown in Figure 4B and 6B and 6D are routinely produced.
We believe that the array printing method described here can be generally applied to the reproducible detection of any point mutation or small deletion or insertion in any amplified genomic sample. The general utility of this RDB printing method might allow mechanized production of screening strips for aldolase B mutations (which cause hereditary fructose intolerance), 17 non-deletion α-thalassemia, 18 or adult onset mitochondria disorders such as Leber’s hereditary optic neuropathy. 19 This assay is flexible, inexpensive to implement, and uses off-the-shelf commercially available hardware, reagents, and software. While RDB assays generally are limited by an inability to detect large or quantitative deletions and an inability to characterize all but modest expanded repeat sequences, where ascertaining of individual base pair changes can lead to molecular diagnosis, these strips can provide a means of accurate and reproducible genotype assignments. Automated spotting of reverse dot blot strips allows us to print 80 to 100 strips in one hour with a minimum of operator intervention. Automation has also allowed us to make higher density strips more accurately than by hand. In the case of the cystic fibrosis genotyping test, it has permitted us to array all of the probes required for a complete test on a single strip. This single-strip array increases the efficiency of processing the strips for colorimetric visualization and reporting results on individual patients.
One recent report which created excitement in the molecular diagnostics community is the observation that the Biomek can be used for printing PCR product microarrays onto glass slides. 20 However, in the past, immobilized amplicons have been noted to provide less even results than RDB arrays. 1 This is because immobilized amplification products are generally longer and more subject to steric hindrance during hybridization than is an immobilized oligonucleotide on a reverse dot blot. In addition, amplification product immobilization efficiency in a forward ASO test depends on amplification success. A compilation of information from multiple forward ASOs would be required for equivalent CF or β-thalassemia genotype assignments to those presented here. We therefore think it likely that RDBs will remain a significant tool for human mutation testing for years to come.
Acknowledgments
The authors thank Drs. C.S. Chiang, Jean Amos, Wayne Wecksler, and Peter Noce for their support. In addition, we wish to acknowledge that Dr. Mark Rabin, Jessica Novak, and Adalbert Kowalski contributed to early versions of the work described here. Also, Dave Helphrey and Dr. John Fawcett of Beckman/Coulter provided the initial ideas and introductions that made this work possible. A preliminary report on some of the data contained in this publication was presented at a poster session of the 1998 American Association of Clinical Chemists meeting in Chicago, Illinois. The abstract accompanying that presentation was printed in Clinical Chemistry, vol. 44, no. 6, supplement.21
Address reprint requests to Bert Gold, Laboratory of Genomic Diversity, Human Genetics Section, National Cancer Institute at Frederick, Frederick, MD 21702. E-mail: goldb@ncifcrf.gov.
Footnotes
Biomek and BioWorks are registered trademarks of Beckman/Coulter, Inc.
Stephen Lappin’s current address is Amgen, 1 Amgen Center Drive, Thousand Oaks, CA 91320.
Jeff Cahlik’s current address is ACME-Automation.com, Tustin, CA 92782.
References
- 1.Zhang Y, Coyne MY, Will SG, Levenson CH, Kawasaki ES: Single-base mutational analysis of cancer and genetic diseases using membrane bound modified oligonucleotides. Nucleic Acids Res 1991, 19:3929-3933 [DOI] [PMC free article] [PubMed] [Google Scholar]
- 2.Kawasaki E, Saiki R, Erlich H: Genetic analysis using polymerase chain reaction-amplified DNA and immobilized oligonucleotide probes: reverse dot blot typing. Methods Enzymol 1993, 218:369-381 [DOI] [PubMed] [Google Scholar]
- 3.Sutcharitchan P, Embury SH: Advances in molecular diagnosis of inherited hemoglobin disorders. Curr Opin Hematol 1996, 3:131-138 [DOI] [PubMed] [Google Scholar]
- 4.Cuppens H, Buyse I, Baens M, Marynen P, Cassiman JJ: Simultaneous screening for 11 mutations in the cystic fibrosis transmembrane conductance regulator gene by multiplex amplification and reverse dot-blot. Mol Cell Probes 1992, 6:33-39 [DOI] [PubMed] [Google Scholar]
- 5.Cuppens H, Marynen P, De Boeck C, Cassiman JJ: Detection of 98.5% of the mutations in 200 Belgian cystic fibrosis alleles by reverse dot-blot and sequencing of the complete coding region and exon/intron junctions of the CFTR gene. Genomics 1993, 18:693-697 [DOI] [PubMed] [Google Scholar]
- 6.Chehab FF, Wall J: Detection of multiple cystic fibrosis mutations by reverse dot blot hybridization: a technology for carrier screening. Hum Genet 1992, 89:163-168 [DOI] [PubMed] [Google Scholar]
- 7.Sutcharitchan P, Saiki R, Huisman TH, Kutlar A, McKie V, Erlich H, Embury SH: Reverse dot-blot detection of the African-American beta-thalassemia mutations. Blood 1995, 86:1580-1585 [PubMed] [Google Scholar]
- 8.Wall J, Cai S, Chehab FF: A 31-mutation assay for cystic fibrosis testing in the clinical molecular diagnostics laboratory. Hum Mutat 1995, 5:333-338 [DOI] [PubMed] [Google Scholar]
- 9.Grody WW, Dunkel-Schetter C, Tatsugawa ZH, Fox MA, Fang CY, Cantor RM, Novak JM, Bass HN, Crandall BF: PCR-based screening for cystic fibrosis carrier mutations in an ethnically diverse pregnant population. Am J Hum Genet 1997, 60:935-947 [PMC free article] [PubMed] [Google Scholar]
- 10.Rady MS, Baffico M, Khalifa AS, Heshmat NM, el-Moselhy S, Sciarratta GV, Hussein IR, Temtamy SA, Romeo G: Identification of Mediterranean beta-thalassemia mutations by reverse dot-blot in Italians and Egyptians. Hemoglobin 1997, 21:59-69 [DOI] [PubMed] [Google Scholar]
- 11.Villalobos-Torres C, Rojas-Martinez A, Villareal-Castellanos E, Cantu JM, Sanchez-Anzaldo FJ, Saiki RK, Barrera-Saldina HA: Analysis of 16 cystic fibrosis mutations in Mexican patients. Am J Med Genet 1997, 69:380-382 [DOI] [PubMed] [Google Scholar]
- 12.Winichagoon P, Saechan V, Sripanich R, Nopparanta C, Kanokpongsakdi S, Maggio A, Fucharoen S: Prenatal diagnosis of beta-thalassemia by reverse dot-blot hybridization. Prenat Diagn 1999, 19:428-435 [PubMed] [Google Scholar]
- 13.Syvanen AC, Bengtstron M, Tenhunen J, Soderlund H: Quantification of polymerase chain reaction products by affinity-based hybrid collection. Nucleic Acids Res 1988, 16:11327-11328 [DOI] [PMC free article] [PubMed] [Google Scholar]
- 14.Mitchell LG, Merril CR: Affinity generation of single-stranded DNA for dideoxy sequencing following the polymerase chain reaction. Anal Biochem 1989, 178:239-242 [DOI] [PubMed] [Google Scholar]
- 15.Ousterhout J: K Tcl and the Tk Toolkit. 1994. Addison-Wesley Professional Computing, Boston MA
- 16.Rose D: Microfluidic Technologies and Instrumentation for Printing DNA Microarrays in Microarray Biochip Technology. Edited by M Schena. Natick MA, Eaton Publishing, 2000, pp 19–38
- 17.Lau J, Tolan DR: Screening for hereditary fructose intolerance mutations by reverse dot-blot. Mol Cell Probes 1999, 13:35-40 [DOI] [PubMed] [Google Scholar]
- 18.Chan V, Yam I, Chen FE, Chan TK: A reverse dot-blot method for rapid detection of non-deletion alpha thalassaemia. Br J Haematol 1999, 104:513-515 [DOI] [PubMed] [Google Scholar]
- 19.Schollen E, Vandenberk P, Cassiman JJ, Matthijs G: Development of reverse dot-blot system for screening of mitochondrial DNA mutations associated with Leber hereditary optic atrophy. Clin Chem 1997, 43:18-23 [PubMed] [Google Scholar]
- 20.Macas J, Nouzova M, Galbraith DW: Adapting the Biomek laboratory automation workstation for printing DNA microarrays. Biotechniques 2000, 1998:25:106–110 [PubMed]
- 21.Lappin S, Novak J, Rabin M, Cahlik J, Gold B: Automated printing of reverse dot blot arrays for the detection of human b-globin mutations. Clin Chem 1998, 44(Suppl):A32 (Abstract)