

Abstract
The t(14;18) is the most common genetic alteration in follicular lymphoma, and is detectable in a subset of diffuse large B-cell lymphomas (DLBCL), resulting in over-expression of the anti-apoptotic protein BCL-2. Although the t(14;18)-induced over-expression of BCL-2 is an important step in lymphomagenesis, this aberration alone is not sufficient to produce malignant lymphoma. Further analysis of these tumors is needed to identify additional genes that might be involved in the genesis of follicular lymphoma and progression to DLBCL. To address this issue, we analyzed the gene expression profiles of four t(14;18)-positive cell lines and two t(11;14)-positive mantle-cell lymphoma cell lines using cDNA microarrays containing 4364 genes, and compared them to the genetic profile of phenotypically purified B-cells obtained from hyperplastic tonsils. A total of 137 genes were differentially expressed by approximately twofold or more in the t(14;18) cell lines relative to tonsillar B-cells. 68 genes were up-regulated, 69 genes were down-regulated, and approximately 20% of the differentially regulated genes had no known function. The up-regulated genes included a number of genes involved in the promotion of cellular proliferation and survival, as well as cell metabolism. Down-regulated genes included mediators of cell adhesion and negative regulators of cell activation and growth. Hierarchical clustering analysis separated the t(14;18) and mantle-cell lines into distinct groups based on their gene expression profiles. We confirmed the differential expression of approximately 80% of selected up- and down-regulated genes identified by microarray analysis by quantitative real-time fluorescence reverse trancriptase polymerase chain reaction (RT-PCR) analysis and/or immunoblotting. This study demonstrates the utility of cDNA microarray analysis for the assessment of global transcriptional changes that characterize t(14;18)-positive cell lines, and also for the identification of novel genes that could potentially contribute to the genesis and progression of non-Hodgkin’s lymphomas with this translocation.
The t(14;18) is a frequent chromosomal alteration in non-Hodgkin’s lymphomas (NHL), occurring in up to 90% of follicular lymphomas 1 and 20 to 30% of diffuse large B-cell lymphomas (DLBCL). 2, 3 This translocation is acquired early in B-cell development and results in juxtaposition of the bcl-2 gene on chromosome 18 with the immunoglobulin heavy-chain locus on chromosome 14, resulting deregulated expression of a structurally intact BCL-2 protein. 4, 5, 6, 7, 8 BCL-2 is located in the inner mitochondrial membrane and functions as an anti-apoptotic protein that inhibits programmed cell death, 9 resulting in accumulation of B-lymphocytes by virtue of increased cell survival. 9, 10, 11
Although the t(14;18)-induced over-expression of bcl-2 is an important step in lymphomagenesis, this alteration alone is not sufficient to produce malignant lymphoma. This has been demonstrated in in vitro gene transfer experiments using cell lines and transgenic mice studies in which forced over-expression of bcl-2 was insufficient to cause lymphoma. 12, 13 Indeed, low numbers of t(14;18)-carrying cells can be detected in benign lymphoid tissues such as follicular hyperplasias and the hyperplastic tonsils of young children. 14 These studies indicate that cumulative genetic and cellular alterations superimposed on the t(14;18) are necessary for the development of lymphoma and underscore the need for further analysis of t(14;18)-containing DLBCLs to identify additional genes involved in lymphomagenesis and progression.
cDNA microarray technology allows large scale parallel analyses of gene expression and permits simultaneous comparison of the relative gene expression levels of several thousand genes in different cell types. 15, 16 This approach has now been used successfully by a number of groups to identify distinct gene expression patterns in various tumors, tumor cell lines, and disease states. 17, 18, 19, 20, 21, 22, 23, 24 In this study, we use cDNA microarrays to examine the global transcriptional profiles of four t(14;18)-positive lymphoma-derived cell lines and demonstrate that they can be readily distinguished from two t(11;14)-positive mantle-cell lymphoma cell lines on the basis of their respective expression profiles. We also demonstrate the utility of real-time quantitative fluorescence RT-PCR for validation of microarray expression data and show how this approach may be used to identify differentially expressed genes that could be involved in the development of t(14;18)-positive NHLs.
Materials and Methods
Cell Lines
Stanford University diffuse histiocytic lymphoma (SUDHL) cell lines SUDHL-4 and SUDHL-6 25 were generously provided by Dr. Lynn Sorbara, National Cancer Institute, National Institutes of Health, Bethesda, MD. Karpas 422, 26 Ontario Cancer Institute (OCI)-LY1, 27 and NCEB-1 28 were kindly provided by Dr. Neil Berinstein, University of Toronto, Ontario, Canada. Granta 519 29 was obtained from the German Collection of Microorganisms and Cell Cultures (Braunschweig, Germany). Each of these cell lines has a complex karyotype that has previously been published. 26, 28, 29, 30, 31, 32 All cell lines were maintained in RPMI-1640 medium (Nova-Tech, Inc., Grand Island, NE) supplemented with 20% (v/v) heat-inactivated fetal calf serum and penicillin/streptomycin/amphotericin B solution (Antibiotic-Antimycotic, Life Technologies, Rockville, MD).
Tonsillar B-Cells
Isolation of phenotypically enriched tonsillar B-lymphocytes was performed as previously described. 33 Briefly, a routine tonsillectomy sample was obtained from a single patient (with informed consent) who underwent surgical extirpation for chronic tonsillitis. A single specimen was processed to minimize the heterogeneity of the purified B-cell population. Tonsillar tissue was finely minced and the resulting cell suspension was depleted of non-B-cells by plastic adherence and rosetting with sheep erythrocytes. This method routinely yields tonsillar B-lymphocytes at approximately 98% purity as determined by immunophenotypic analysis with CD3, CD19, CD20, and CD45 antibodies.
RNA Preparation
Total RNA was isolated from cell lines and purified tonsillar B-cells using TRIzol reagent (Life Technologies, Rockville, MD) according to the manufacturer’s instructions. Residual DNA was removed by treatment with RNase-free DNase in the presence of the ribonuclease inhibitor RNAsin. The RNA was phenol/chloroform-extracted, ethanol-precipitated, and then resuspended in DEPC-treated RNase-free distilled water. mRNA was purified from total RNA using the Qiagen Oligotex mRNA purification kit as described by the manufacturer (Qiagen, Valencia, CA).
DNA Microarray Analysis
Microarray analysis was performed in the Huntsman Cancer Institute Microarray Core Facility at the University of Utah using Molecular Dynamics/Amersham Pharmacia Biotech (Piscataway, NJ) instrumentation to print and scan the microarray slides. Microarray slides contained 4364 sequence-verified clones obtained from Research Genetics (Huntsville, AL). Differential gene expression was investigated using a simultaneous two-color hybridization scheme essentially as described by Schena et al. 15 Fluorescently labeled cDNA from each of the cell populations to be compared was prepared from mRNA samples by oligo dT-primed synthesis in a 20 μl reaction using SuperScript II reverse transcriptase (Life Technologies, Rockville, MD) in the presence of 50 μmol/L dGTP, dATP, dTTP, 5 μmol/L dCTP, and 12.5 μmol/L of either Cy3-dCTP (green fluorescence) or Cy5-dCTP (red fluorescence) (Amersham Pharmacia Biotech, Piscataway, NJ). After incubation at 42°C for 2.5 hours, the reaction was stopped by the addition of 1 μl of 5 mol/L NaOH and incubation at 37°C for 10 minutes. The resulting alkaline solution was partially neutralized with 2.5 μl of 2 mol/L Tris-HCL (pH 7.5) and 1 μl of 5 mol/L HCl, and unincorporated nucleotides were removed using the Qiagen PCR clean-up kit (Qiagen, Valencia, CA). The two fluorescent probes were mixed, vacuum-concentrated, resuspended in hybridization buffer, and then hybridized to the microarray slides. Hybridization patterns were captured electronically using a two-color confocal laser microscope. Analysis of array images was performed by both visual inspection and electronic quantitation of the fluorescence intensities of individual microarray spots.
Four separate hybridizations were performed for all samples. Expression data from replicate cDNA microarray hybridizations showed a high degree of reproducibility with correlation coefficients ranging from approximately 0.85 to 0.90 (data not shown). Our cDNA microarrays tended to show a lower dynamic range among over-expressed genes than under-expressed genes, resulting in identification of fewer differentially over-expressed genes than under-expressed genes at a given threshold of expression. Therefore, to identify sufficient genes for further analysis, differential expression of a gene was considered to be present between cell line and tonsillar B-cell samples when the Cy5/Cy3 ratio was greater than or equal to a 1.5-fold difference from the mean signal ratio of the entire microrray slide for over-expressed genes, and a twofold or more difference for under-expressed genes. In accordance with the recommendations of Lee et al, 34 gene expression patterns were considered reproducible only if they were maintained in least three replicate hybridizations (from a total of four hybridizations). Visual inspection of microarray images was accomplished with the assistance of ImageQuant NT software (Molecular Dynamics, Sunnyvale, CA). Electronic spot quantification was achieved using ArrayVision 4 software from Imaging Research (Ontario, Canada). This program permitted assignment of numerical values representative of the fluorescence intensities of the individual spots. Manipulation of raw fluorescence data were accomplished using GeneSpring software (Redwood City, CA).
Quantitative Fluorescence RT-PCR Analysis
Total RNA was isolated from cell lines and purified tonsillar B-cells using TRIzol reagent (Life Technologies, Rockville, MD) according to the manufacturer’s instructions. First-strand cDNA synthesis was performed using 1.0 μg of total RNA and SuperScript II RNase H-reverse transcriptase (Life Technologies, Rockville, MD) according to the manufacturer’s instructions. Fluorescence PCR analysis was performed using the LightCycler (Roche Molecular Biochemicals, Indianapolis, IN) and SYBR Green I (Molecular Probes, Eugene, OR) essentially as described. 35 Briefly, 1.0 μl of each first-strand cDNA reaction was amplified by primer pairs specific for the glyceraldehyde-3-phosphate dehydrogenase (GAPDH), stearoyl-CoA desaturase, v-myb, neurotrophic tyrosine kinase receptor-related 1, cyclin-dependent kinase 8, junB, junD, and fosB genes, and selected ESTs (summarized in Table 1 ) in a 10 μl reaction containing 1X PCR buffer (50 mmol/L Tris [pH 8.3], 250 μg/ml bovine serum albumin, 2% sucrose, 3.0 mmol/L MgCl2), dNTPs at 200 μmol each, 0.5 μmol of each primer, 0.4 units of TaqDNA polymerase (Promega, Madison, WI), 8.8 ng/μl TaqStart antibody (Clontech, Palo Alto, CA), and the double-stranded DNA binding dye SYBR Green I (1:30,000 dilution). Amplification reactions consisted of 40 to 50 cycles of denaturation at 94°C (0 seconds), annealing at 55°C (0 seconds), and extension at 72°C (15 seconds). Fluorescence signals were obtained once in each cycle by sequential fluorescence monitoring of each sample tube at the end of extension. A fractional cycle number or crossing threshold (CT) was determined from the exponential phase of the fluorescence amplification profiles using the second derivative maximum function of the Roche LightCycler software. The CT values so derived serve as indirect indicators of gene expression so that samples with high expression of a given gene exhibit lower CTs than samples showing low-level gene expression. Expression of the housekeeping gene GAPDH was used as a control for input cDNA in each LightCycler amplification reaction. Once the GAPDH CT was determined for each cDNA sample, it was used to normalize all other genes tested from the same cDNA samples. Calculation of fold increase or decrease in expression of selected genes relative to expression levels in tonsillar B-cells was accomplished using the following formula modified from Elenitoba-Johnson et al: 36
 |
Table 1.
Primers Used for Quantitative Fluorescence RT-PCR Analysis of Selected Genes
| Gene | Primer | Sequence |
|---|---|---|
| Glyceraldehyde-3-phosphate dehydrogenase | Forward | 5′-CGACCACTTTGTCAAGCTCA-3′ |
| Reverse | 5′-AGGGGAGATTCAGTGTGGTG-3′ | |
| Stearoyl-CoA desaturase (delta-9-desaturase) | Forward | 5′-CCCAGCTGTCAAAGAGAAGG-3′ |
| Reverse | 5′-CCACAGCATATCGCAAGAAA-3′ | |
| v-Myb | Forward | 5′-GTCCGAAACGTTGGTCTGTT-3′ |
| Reverse | 5′-TTCGTCCAGGCAGTAGCTTT-3′ | |
| Neurotrophic tyrosine kinase, receptor-related 1 | Forward | 5′-ACCTCGACACCACAGACACA-3′ |
| Reverse | 5′-GTGCGGTTGCCAATAAATCT-3′ | |
| Cyclin-dependent kinase 8 | Forward | 5′-GCAGATTTGGATCCAGTGGT-3′ |
| Reverse | 5′-TCCAGCTGGTCATGGTGATA-3′ | |
| Human receptor-like tyrosine kinase (H-Ryk) | Forward | 5′-TGCCCTCTCCAGAGACTTGT-3′ |
| Reverse | 5′-CATCTCGAAGGGGTCAATGT-3′ | |
| EST 1 | Forward | 5′-CGAATCTCCTCCTTGCTCTG-3′ |
| Reverse | 5′-GGCGAAATGCCAGCTTATAC-3′ | |
| EST 2 | Forward | 5′-CAGCCACACCAAGAAGTCAA-3′ |
| Reverse | 5′-TCTGAGCGATCTGTGTTTGC-3′ | |
| EST 3 | Forward | 5′-GGCAGGAATACACAGCAACA-3′ |
| Reverse | 5′-AGGCTGGCTGGAATAAAGGT-3′ | |
| JunB | Reverse | 5′-TCTCTCAAGCTCGCCTCTTC-3′ |
| Forward | 5′-ACGTGGTTCATCTTGTGCAG-3′ | |
| JunD | Forward | 5′-AAGTCCTCAGCCACGTCAAC-3′ |
| Reverse | 5′-TCTGAGTTCCTGGGCACACT-3′ | |
| FosB | Forward | 5′-GACTCAAGGGGGTGACAGAA-3′ |
| Reverse | 5′-AAAATGTCACAGCCCCTCAC-3′ |
This formula permits an accurate estimation of the abundance of specific transcripts relative to a reference sample (phenotypically purified tonsillar B-cells) using a relatively stable transcript (GAPDH) for normalization of input cDNA in all four of the t(14;18)-positive cell lines.
Protein Analysis
To validate our microarray analysis by another modality, we also assessed all four t(14;18)-positive cell lines (SUDHL-4, SUDHL-6, Karpas 422, and OCI-LY1) and both mantle-cell lymphoma lines (Granta 519 and NCEB-1) for BCL-2 protein expression by immunoblotting (data not shown). Total cell extracts were prepared by lysing cells in ice-cold lysis buffer containing 0.2% Nonidet P-40, 20 mmol/L Tris-HCl (pH 7.50), 0.25 mol/L NaCl, 1 mmol/L EDTA, and 2 μl/ml mammalian cell extract protease inhibitor cocktail (Sigma, St. Louis, MO). Cell lysates were then subjected to three cycles of freezing (liquid N2) and thawing (37°C water bath). Equal amounts of total cell extract (30 μg) were separated by SDS-PAGE, transferred to Immobilon membranes (Millipore, Bedford, MA), and probed with monoclonal antibodies to BCL-2 (1:500, sc-509) and actin (1:100, sc-8432) (Santa Cruz Biotechnology, Inc., Santa Cruz, CA). Protein was detected by enhanced chemiluminescence (Luminol Reagent, Santa Cruz Biotechnology, Inc., Santa Cruz, CA) and Kodak BioMax ML film.
Results
Microarray Analysis
In this study, we sought to identify transcriptional changes that might implicate specific genes in the development of DLBCLs harboring the t(14;18). To accomplish this goal, we analyzed the gene expression profiles of four B-cell lymphoma cell lines containing the t(14;18) and two mantle-cell lymphoma cell lines containing the t(11;14) using cDNA microarrays consisting of nearly 4500 genes. For this analysis, purified tonsillar B-cells were used to represent a normal B-cell population in which successive genetic alterations might be superimposed on the t(14;18) during development of DLBCL. The use of phenotypically purified tonsillar B-cells as a reference standard also allowed us to compare the expression profiles of tumor cell lines derived from neoplasms putatively arising from germinal center cells and naive (mantle) cells, since both of these cell populations are represented in the purified tonsillar B-cell sample. We were also interested to determine whether expression profiling could discriminate the t(14;18) cell lines from another genetically distinct agressive B-cell lymphoma, specifically, t(11;14)-positive mantle-cell lymphoma cell lines, based on their gene expression profiles. We also sought to determine whether we could identify patterns of differential gene expression that were shared by the t(14;18)-positive cell lines.
Unsupervised hierarchical clustering using all of the genes in our microarray system revealed that the four t(14;18)-positive cell lines could be readily separated from the two mantle-cell lymphoma cell lines based on their respective gene expression profiles, with the two mantle-cell lymphoma cell lines clustering together in a group that was distinctly separate from the four t(14;18) cell lines (Figure 1) . Further analysis of the genetic profiles of the t(14;18) cell lines revealed a total of 137 differentially expressed genes at the RNA level by approximately twofold or more. Relative to tonsillar B-cells, 68 genes were up-regulated in at least three of the four cell lines (range, 1.5- to 3.7-fold; Tables 2 and 3 ), 69 genes were down-regulated in all four cell lines (range, 2.0- to 15.9-fold; Table 4 ), and 29 (approximately 20%) of these genes consisted of expressed sequence tags (ESTs) with no known function (Tables 2 and 4) . Among the up-regulated genes with known function, approximately 40% were involved in the promotion of cellular proliferation and survival, as well as cellular metabolism (Table 2 , Groups 1 and 2). Interestingly, a number of these genes have previously been found to be over-expressed in a variety of carcinomas and lymphomas (see discussion). A number of the up-regulated genes in the t(14;18)-positive cell lines were also over-expressed in both mantle-cell lymphoma lines, including seven ESTs (Table 3) . However, the global expression profiles of these two cell lines clearly separated them from the four t(14;18)-positive cell lines (Figure 1) . As expected, the mantle-cell lymphoma lines also over-expressed cyclin D1 and a number of additional genes in the cyclin D1 pathway (data not shown). Genes that showed at least twofold decreased expression in all four of the t(14;18)-positive DLBCL cell lines relative to tonsillar B-cells included putative negative regulators of cell activation and growth, genes potentially involved in apoptosis, mediators of cell adhesion, cytoskeletal genes, major histocompatibility complex genes, and a wide variety of other genes (Table 4 , Groups 1–5). The vast majority of these genes had known or presumed functions, with only four ESTs identified in this group. Additional hierarchical clustering analysis using only the 137 differentially expressed genes (Tables 2 and 4) revealed only minor differences in gene expression among the four t(14;18) cell lines (Figure 2) .
Figure 1.

Unsupervised hierarchical clustering of gene expression data from t(14;18) and mantle-cell lymphoma cell lines using the total complement of 4364 genes. The dendrogram lists the various cell lines and also provides a measure of the relatedness of gene expression in each sample so that samples showing closely related expression profiles are juxtaposed in adjacent branches of the hierarchical dendrogram. Karpas 422, SUDHL-4, SUDHL-6, and OCI-LY1 are t(14;18)-containing B-cell lymphoma cell lines, and NCEB-1 and Granta 519 are t(11;14)-containing mantle-cell lymphoma cell lines. The t(11;14)-containing mantle-cell lymphoma cell lines are closely related and arise from the same branch of the dendrogram. The t(14;18)-containing cell lines arise from a different node and cluster separately from the t(11;14)-cell lines.
Table 2.
Genes Overexpressed in at Least Three t(14;18) Cell Lines
| Gene name | Gene symbol | Clone ID no. | GenBank no. | Locus | Mean fold Increase |
|---|---|---|---|---|---|
| Group 1: Cellular proliferation and survival | |||||
| v-Myc | MYC | 812965 | AA464600 | 8q24.12-q24.13 | 1.9 |
| v-Myb | MYB | 243549 | N49526 | 6q22-q23 | 2.8 |
| Bcl-2 | BCL2 | 232714 | H74208 | 18q21.3 | 3.7 |
| BCL2/adenovirus E1B 19kD-interacting protein 3 | BNIP3 | 359982 | AA063521 | 1.8 | |
| Cyclin-dependent kinase 8 | CDK8 | 42880 | R59697 | 13q12 | 1.9 |
| Mitogen-activated protein kinase 10 | MAPK10 | 23173 | T75436 | 1.9 | |
| Erythropoietin receptor | EPOR | 49509 | H15634 | 19p13.3-p13.2 | 1.6 |
| Neurotrophic tyrosine kinase, receptor-related 1 | NTRKR1 | 781097 | AA430035 | 1p32-p31 | 1.8 |
| RYK receptor-like tyrosine kinase (H-Ryk) | RYK | 108815 | T77810 | 3q22 | 2.3 |
| Inositol 1,4,5-triphosphate receptor, type 2 | ITPR2 | 753914 | AA479093 | 12p11 | 1.5 |
| Suppression of tumorigenicity 16 (melanoma differentiation) | ST16 | 712049 | AA281635 | 1 | 1.8 |
| EGF-like-domain, multiple 2 | EGFL2 | 175103 | H39187 | 1.6 | |
| Zinc finger protein 22 (KOX 15) | ZNF22 | 137638 | R37224 | 10q11 | 1.8 |
| SWI/SNF related, matrix associated, actin dependent regulator of chromatin, subfamily a, member 3 | SMARCA3 | 810974 | AA459632 | 3q25.1-q26.1 | 1.6 |
| Nuclear factor (erythroid-derived 2)-like 1 | NFE2L1 | 755821 | AA496576 | 17q21.3 | 1.7 |
| Primase, polypeptide 1 (49kD) | PRIM1 | 365641 | AA025937 | 12q13 | 1.6 |
| Group 2: Cellular metabolism | |||||
| Stearoyl-CoA desaturase (delta-9-desaturase) | SCD | 123474 | R00707 | 10 | 3.1 |
| Cytochrome c-1 | CYC1 | 813830 | AA447774 | 8q24.3 | 2.0 |
| Glycine cleavage system protein H (aminomethyl carrier) | GCSH | 134748 | R28294 | 1.8 | |
| Methionine adenosyltransferase II, alpha | MAT2A | 79502 | T59286 | 2p11.2 | 1.7 |
| Ornithine aminotransferase (gyrate atrophy) | OAT | 783696 | AA446819 | 10q26 | 1.6 |
| Methylene tetrahydrofolate dehydrogenase (NAD+ dependent), methenyltetrahydrofolate cyclohydrolase | MTHFD2 | 814615 | AA480995 | 1.7 | |
| Aldehyde dehydrogenase 5 family, member A1 (succinate-semialdehyde dehydrogenase) | ALDH5A1 | 44505 | H06675 | 6p22 | 1.6 |
| Hexosaminidase B (beta polypeptide) | HEXB | 80095 | T63321 | 5q13 | 1.7 |
| UDP-N-acteylglucosamine pyrophosphorylase 1; sperm associated antigen 2 | UAP1 | 292515 | N68465 | 1.8 | |
| Reticulocalbin 2, EF-hand calcium binding domain | RCN2 | 898253 | AA598676 | 15q22.33-q24.1 | 1.6 |
| Calumenin | CALU | 144881 | R78585 | 7q32 | 1.8 |
| Glycogenin | GYG | 753285 | AA411678 | 3q24-q25.1 | 1.9 |
| Group 3: Miscellaneous | |||||
| Membrane protein, palmitoylated 1 (55kD) | MPP1 | 296880 | W01240 | Xq28 | 1.7 |
| Lysosomal-associated membrane protein 2 | LAMP2 | 289615 | N77754 | Xq24 | 1.7 |
| Adaptor-related protein complex 3, mu 2 subunit | CLA20 | 28823 | R14443 | 8p11.2 | 1.9 |
| Human DNA from overlapping chromosome 19 cosmids containing COX6B and UPKA | 771000 | AA429281 | 1.6 | ||
| KIAA0286 protein | KIAA0286 | 109221 | T81399 | 1.6 | |
| Integrin, alpha 8 | ITGA8 | 165878 | R87964 | 1.9 | |
| Breakpoint cluster region | BCR | 756163 | AA419342 | 22q11.23 | 1.7 |
| RD RNA-binding protein | RDBP | 509484 | AA056390 | 6p21.3 | 1.6 |
| Glycoprotein M6B | GPM6B | 713660 | AA284329 | Xp22.2 | 1.9 |
| Nuclear matrix protein p84 | P84 | 711450 | AA280748 | 18 | 1.8 |
| Tryptophan rich basic protein | WRB | 758329 | AA401236 | 21q22.3 | 1.7 |
| Metallothionein 1L | MT1L | 297392 | N80129 | 16q13 | 1.7 |
| Novel human gene mapping to chomosome 13 | 841695 | AA488718 | 2.6 | ||
| Homo sapiens mRNA; cDNA DKFZp564H2416 (from clone DKFZp564H2416) | 294487 | W01536 | 1.8 | ||
| DKFZP586D2223 protein | DKFZP586D2223 | 199158 | H83178 | 1.6 | |
| EST 1 | 195051 | R91137 | 1.6 | ||
| EST 2 | 308478 | W24883 | 1.9 | ||
| EST 3 | 346545 | W74293 | 2.2 | ||
| 22 ESTs |
Table 3.
Genes Overexpressed in Both Mantle Cell Lines and at Least Three t(14;18) Cell Lines
| Gene name | Gene symbol | GenBank no. | Locus |
|---|---|---|---|
| Lysosomal-associated membrane protein 2 | LAMP2 | N77754 | Xq24 |
| Adaptor-related protein complex 3, mu 2 subunit | CLA20 | R14443 | 8p11.2 |
| Human DNA from overlapping chromosome 19 cosmids containing COX6B and UPKA | AA429281 | ||
| Stearoyl-CoA desaturase (delta-9-desaturase) | SCD | R00707 | 10 |
| KIAA0286 protein | KIAA0286 | T81399 | |
| Integrin, alpha 8 | ITGA8 | R87964 | |
| Glycine cleavage system protein H (aminomethyl carrier) | GCSH | R28294 | |
| Erythropoietin receptor | EPOR | H15634 | 19p13.3-p13.2 |
| RYK receptor-like tyrosine kinase (H-Ryk) | RYK | T77810 | 3q22 |
| Glycoprotein M6B | GPM6B | AA284329 | Xp22.2 |
| Primase, polypeptide 1 (49kD) | PRIM1 | AA025937 | 12q13 |
| Cytochrome c-1 | CYC1 | AA447774 | 8q24.3 |
| Cyclin-dependent kinase 8 | CDK8 | R59697 | 13q12 |
| Metallothionein 1L | MT1L | N80129 | 16q13 |
| Homo sapiens mRNA; cDNA DKFZp564H2416 (from clone DKFZp564H2416) | W01536 | ||
| Calumenin | CALU | R78585 | 7q32 |
| Hexosaminidase B (beta polypeptide) | HEXB | T63321 | 5q13 |
| Bcl-2 | BCL2 | H74208 | 18q21.3 |
| v-Myb | MYB | N49526 | 6q22-q23 |
| 7 ESTs |
Table 4.
Genes Underexpressed in All Four t(14;18) Cell Lines
| Gene name | Gene symbol | Clone ID no. | GenBank no. | Locus | Mean fold decrease |
|---|---|---|---|---|---|
| Group 1: Putative negative regulators of cell activation and growth | |||||
| Protein tyrosine phosphatase, receptor type, alpha polypeptide | PTPRA | 240099 | H82419 | 20p13 | 2.6 |
| Protein tyrosine phosphatase, receptor type, gamma polypeptide | PTPRG | 137531 | R38343 | 3p21-p14 | 3.7 |
| Protein tyrosine phosphatase, receptor type, c polypeptide | PTPRC | 229365 | H74265 | 1q31-q32 | 3.8 |
| Transforming growth factor, beta 1 | TGFB1 | 136821 | R36467 | 19q13.1 | 3.4 |
| Endoglin (Osler-Rendu-Weber syndrome 1) | ENG | 774409 | AA446108 | 9q33-q34.1 | 3.4 |
| Phosphodiesterase 1/nucleotide pyrophosphatase 1 (homologous to mouse Ly-41 antigen) | PDNP1 | 82991 | T70503 | 6q22-q23 | 2.7 |
| JunB | JUNB | 122428 | T99236 | 19p13.2 | 7.5 |
| JunD | JUND | 767784 | AA418670 | 19p13.2 | 6.1 |
| Group 2: Putative apoptosis related genes | |||||
| CD53 antigen | CD53 | 504226 | AA132090 | 1p31-p12 | 9.1 |
| Lysosomal-associated multispanning membrane protein-5 | LAPTM5 | 753313 | AA410265 | 1p34 | 5.9 |
| Group 3: Mediators of cell adhesion and cytoskeletal genes | |||||
| Villin 2 (ezrin) | VIL2 | 755145 | AA411440 | 6q25-q26 | 2.1 |
| Actin related protein 2/3 complex, subunit 5 (16 kD) | ARPC5 | 340558 | W55964 | 2.6 | |
| Profilin 1 | PFN1 | 826173 | AA521431 | 17p13.3 | 3.9 |
| L-Selectin (lymphocyte adhesion molecule 1) | SELL | 149910 | H00756 | 1q23-q25 | 6.0 |
| Actin, gamma 2, smooth muscle, enteric | ACTG2 | 81289 | T60048 | 2p13.1 | 7.5 |
| CD44 antigen (homing function and Indian blood group system) | CD44 | 713145 | T69168 | 11p13 | 3.8 |
| Kallmann syndrome 1 sequence | KAL1 | 50182 | H17882 | Xp22.32 | 11.0 |
| Group 4: Major histocompatibility complex | |||||
| Major histocompatibility complex, class II, DM alpha | HLA-DMA | 183337 | H42679 | 6p21.3 | 4.6 |
| Major histocompatibility complex, class II, DQ alpha 1 | HLA-DQA1 | 80109 | T63324 | 6p21.3 | 5.9 |
| Human HLA-DR alpha-chain mRNA | 153411 | R47979 | 6.3 | ||
| Major histocompatibility complex, class II, DP beta 1 | HLA-DPB1 | 840942 | AA486627 | 6p21.3 | 7.4 |
| Major histocompatibility complex, class II, DQ beta 1 | HLA-DQB1 | 809598 | AA442984 | 6p21.3 | 8.0 |
| Group 5: Miscellaneous | |||||
| Eukaryotic translation termination factor 1 | ETF1 | 811999 | AA456664 | 5 | 2.0 |
| Interleukin 4 receptor | IL4R | 714453 | AA292025 | 16p11.2-12.1 | 2.1 |
| Poly(A)-binding protein, cytoplasmic 1 | PABPC1 | 840940 | AA486626 | 8q22.2-q23 | 2.3 |
| Mel transforming oncogene (derived from cell line NK14)-RAB8 homolog | MEL | 525566 | AA064715 | 19p13.1 | 2.3 |
| Chemokine (C-X-C motif), receptor 4 (fusin) | CXCR4 | 79629 | T62491 | 2q21 | 2.3 |
| Interferon regulatory factor 1 | IRF1 | 740476 | AA478043 | 5q31.1 | 2.4 |
| Phosphofructokinase, platelet | PFKP | 950682 | AA608558 | 10p15.3-p15.2 | 2.5 |
| Myxovirus (influenza) resistance 1, homolog of murine (interferon-inducible protein p78) | MX1 | 815542 | AA456886 | 21q22.3 | 2.5 |
| Platelet-derived growth factor receptor-like | PDGFRL | 810010 | AA455210 | 8p22-p21.3 | 2.5 |
| DNA segment on chromosome X and Y (unique) 155 expressed sequence | DXYS155E | 897619 | AA496863 | Xp22.32 | 2.6 |
| Nuclear factor of kappa light polypeptide gene enhancer in B-cells inhibitor, alpha | NFKBIA | 340734 | W55872 | 14q13 | 2.6 |
| KIAA0220 protein | KIAA0220 | 785605 | AA448998 | 2.6 | |
| Phosphoglucomutase 1 | PGM1 | 843174 | AA488504 | 1p31 | 2.6 |
| Poly(rC)-binding protein 1 | PCBP1 | 839890 | AA490047 | 2p12-p13 | 2.7 |
| Ribosomal protein, mitochondrial, L3 | RPML3 | 44255 | H06113 | 2.8 | |
| Growth factor receptor-bound protein 2 | GRB2 | 788654 | AA449831 | 17q24-q25 | 3.0 |
| Mannose-binding lectin (protein C) 2, soluble (opsonic defect) | MBL2 | 82879 | T69359 | 10q11.2 | 3.0 |
| Hematopoietic cell-specific Lyn substrate 1 | HCLS1 | 767183 | AA424575 | 3q13 | 3.1 |
| Proteoglycan 1, secretory granule | PRG1 | 703581 | AA278759 | 10q22.1 | 3.1 |
| Nuclear receptor subfamily 4, group A, member 2 | NR4A2 | 898221 | AA598611 | 2q22-q23 | 3.2 |
| Mannosidase, alpha, class 2A, member 1 | MAN2A1 | 212496 | H70017 | 5q21-q22 | 3.2 |
| Guanine nucleotide exchange factor; 115-kD; mouse Lsc homolog | SUB1.5 | 815239 | AA481277 | 19q13.13 | 3.3 |
| GDP dissociation inhibitor 2 | GDI2 | 197176 | R92806 | 10p15 | 3.4 |
| High-mobility group (nonhistone chromosomal) protein 17 | HMG17 | 241826 | H93087 | 1p36.1 | 3.4 |
| Matrix metalloproteinase 16 (membrane-inserted) | MMP16 | 46916 | H09997 | 8q21 | 3.5 |
| CD69 antigen (p60, early T-cell activation antigen) | CD69 | 704459 | AA279883 | 12p13-p12 | 3.6 |
| KIAA0058 gene product | KIAA0058 | 34795 | R19889 | 3.6 | |
| LIM domain only 2 (rhombotin-like 1) | LMO2 | 810521 | AA464644 | 11p13 | 3.8 |
| KDEL (Lys-Asp-Glu-Leu) endoplasmic reticulum protein retention receptor 2 | KDELR2 | 123117 | T98559 | 7p | 3.8 |
| Human Alpha1 | 382773 | AF001540 | 11q13 | 4.0 | |
| Tumor necrosis factor receptor superfamily, member 5 | TNFRSF5 | 261519 | H98636 | 20q12-q13.2 | 4.6 |
| Myristoylated alanine-rich protein kinase C substrate (MARCKS, 80K-L) | MACS | 840865 | AA482328 | 6q22.2 | 5.6 |
| Human germline IgD chain gene, C-region, C-delta-1 domain | 814124 | AA465378 | 6.1 | ||
| NAD(P)H menadione oxidoreductase 2, dioxin-inducible | NMOR2 | 824024 | AA491124 | 6pter-q12 | 6.9 |
| Ras-related C3 botulinum toxin substrate 2 (rho family, small GTP binding protein Rac2) | RAC2 | 827132 | AA521232 | 22q13.1 | 7.2 |
| Human 1.1 kb mRNA upregulated in retinoic acid treated HL-60 neutrophilic cells | 810734 | AA480820 | 7.5 | ||
| CD79A antigen (immunoglobulin-associated alpha) | CD79A | 115281 | T87012 | 19q13.2 | 14.4 |
| Colony stimulating factor 2 receptor, alpha, low-affinity (granulocyte-macrophage) | CSF2RA | 289337 | N92646 | Xp22.32 | 15.9 |
| FosB | FOSB | 79022 | T62179 | 19q13.3 | 7.8 |
| Non-histone chromosomal protein | NHC | 31873 | R17124 | 6p21.3 | 2.0 |
| Ras homolog gene family, member H | ARHH | 302591 | W38571 | 4p13 | 2.0 |
| Interferon, gamma-inducible protein 16 | IFI16 | 824602 | AA491191 | 1q22 | 2.5 |
| Dopachrome tautomerase (dopachrome delta-isomerase, tyrosine-related protein 2) | DCT | 753104 | AA478553 | 13q32 | 2.9 |
| 4 ESTs |
Figure 2.
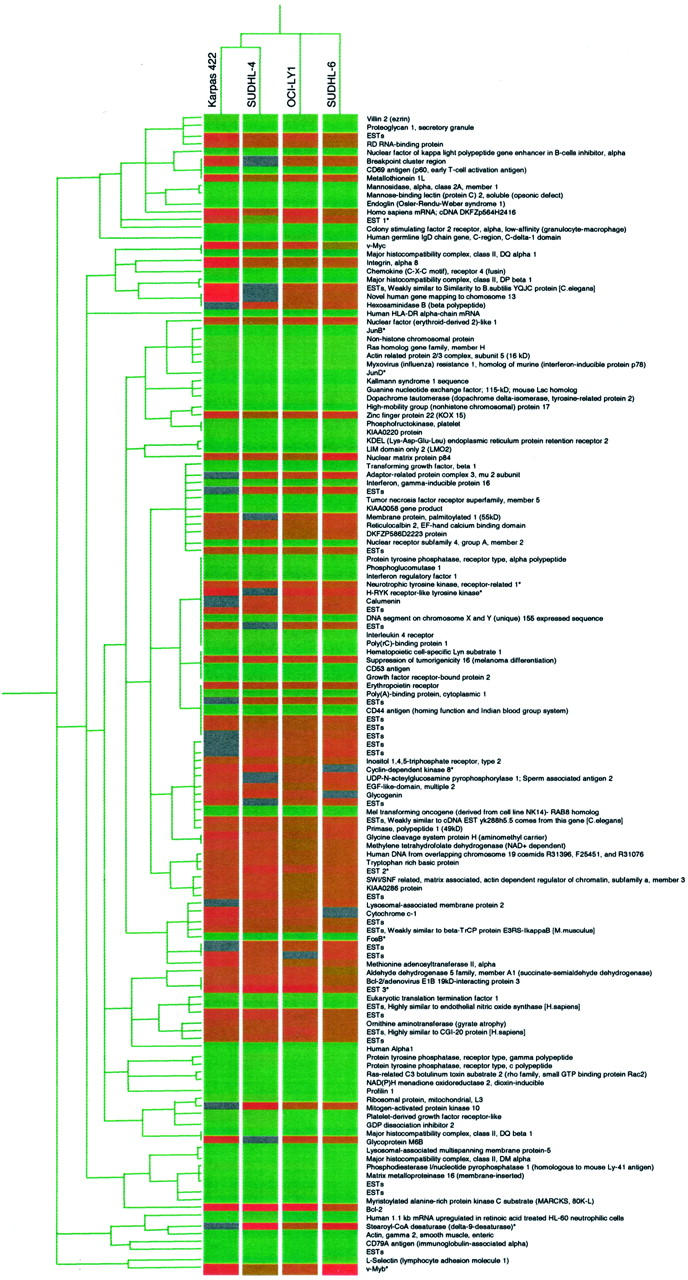
Hierarchical clustering of gene expression data from the four t(14;18)-positive cell lines using the list of 137 previously identified differentially expressed genes contained in Tables 2 and 4 . These genes include all genes over-expressed by approximately twofold or more in at least three of the four t(14;18) cell lines and under-expressed by twofold or more in all four t(14;18) cell lines relative to tonsillar B-cells. The genes corresponding to each horizontal row of the expression matrices are listed on the right side of the figure. Genes that were validated by quantitative fluorescence PCR are denoted by asterisks. The gene expression scale is the same as for Figure 1 .
Confirmation of Differential Gene Expression by Real-Time PCR
To confirm the differential expression of genes identified by cDNA microarray analysis in the various lymphoma cell lines, we analyzed a number of up- and down-regulated genes by real-time quantitative fluorescence RT-PCR (Figures 3 and 4 , Table 5 ). Using this approach, we consistently observed a greater dynamic range of expression in the RT-PCR data relative to the corresponding cDNA microarray expression data (Figure 4) . We were able to validate microarray expression data for the vast majority of the genes reported here (Table 5 ; 11 different genes, 47 of 52 separate RT-PCR reactions), with the exception of two cell lines for neurotrophic tyrosine kinase expression (Figures 3C and 4C , Table 5 ), and one cell line for FosB expression (Figures 3K and 4K , Table 5 ). We also confirmed the differential regulation of three different ESTs (EST 1, EST 2, and EST 3) in the four t(14;18) cell lines (Figures 3 F–H and 4 F–H , Table 5 ). Similarly, the over-expression of cyclin D1 observed in the t(11;14)-positive mantle-cell lymphoma cell lines was also validated by real-time fluorescence RT-PCR (data not shown). 36 Overall agreement with the microarray data, including additional RT-PCR data not shown here, was approximately 80% (15 different genes, 53 of 66 separate RT-PCR reactions). These results are in agreement with a recent study by Rajeevan et al 37 in which they were able to verify the expression levels of approximately 70% of differentially regulated genes identified by microarray analysis using a similar RT-PCR approach that also used the LightCycler. These results also underscore the importance of validation of microarray data by additional methods such as RT-PCR or Northern blot analysis.
Figure 3.

Quantitative fluorescence RT-PCR analysis of selected differentially expressed genes identified by microarray analysis in the four t(14;18)-positive cell lines. Expression of the housekeeping gene GAPDH was used as a control for input cDNA in each RT-PCR reaction. Once the level of GAPDH expression was determined for each cDNA sample, it was used to normalize all other genes tested from the same cDNA samples as described in the Materials and Methods. RT-PCR results are depicted as amplification profiles with relative fluorescence on the y axis and cycle number on the x axis. Cell lines with the highest expression of a given gene will have a lower crossing threshold (CT), and therefore, will show an earlier onset of the exponential phase of the amplification curve for that gene. Amplification profiles are included for: (A) stearoyl-CoA desaturase, (B) v-Myb, (C) neurotrophic tyrosine kinase, receptor-related 1, (D) cyclin-dependent kinase 8, (E) human receptor-like tyrosine kinase (H-Ryk), (F) EST 1, (G) EST 2, (H) EST 3, (I) JunB, (J) JunD, (K) FosB, and (L) glyceraldehyde-3-phosphate dehydrogenase control.
Figure 4.

Comparison of cDNA microarray expression data and quantitative fluorescence RT-PCR data for selected differentially expressed genes identified by microarray analysis in the four t(14;18)-positive cell lines. RT-PCR results were calculated as described in the Materials and Methods. We have consistently observed a larger dynamic range of expression for our RT-PCR data relative to the corresponding cDNA microarray expression data. Results are included for: (A) stearoyl-CoA desaturase (SCD), (B) v-Myb, (C) neurotrophic tyrosine kinase, receptor-related 1 (NTRKR1), (D) cyclin-dependent kinase 8 (CDK8), (E) human receptor-like tyrosine kinase (H-RYK), (F) EST 1, (G) EST 2, (H) EST 3, (I) JunB, (J) JunD, and (K) FosB. Note that no microarray data were available for SCD/Karpas 422 (A), SUDHL-6/CDK8 (D), and SUDHL-4/H-RYK (E).
Table 5.
Quantitative Fluorescence RT-PCR Analysis of Selected Up- and Down-Regulated Genes Identified by Microarray Analysis
| Gene | Cell line/RNA source | Test CT | GAPDH CT | Fold increase or decrease | Overall concordance with microarray data |
|---|---|---|---|---|---|
| Up-regulated genes by microarray analysis (in at least 3 of 4 cell lines) | |||||
| SCD | SUDHL-4 | 15.78 | 14.78 | 66.8 | Yes |
| SCD | SUDHL-6 | 18.36 | 15.83 | 23.2 | Yes |
| SCD | Karpas 422 | 21.22 | 15.64 | 2.8 | NMDA |
| SCD | OCI-LY1 | 20.02 | 17.26 | 19.5 | Yes |
| SCD | Tonsillar B-cell | 22.79 | 15.73 | N/A | Yes |
| v-Myb | SUDHL-4 | 22.05 | 14.78 | 0.9 | Yes |
| v-Myb | SUDHL-6 | 15.54 | 15.83 | 166 | Yes |
| v-Myb | Karpas 422 | 17.94 | 15.64 | 27.6 | Yes |
| v-Myb | OCI-LY1 | 19.11 | 17.26 | 19.5 | Yes |
| v-Myb | Tonsillar B-cell | 22.81 | 15.73 | N/A | Yes |
| NTRKR1 | SUDHL-4 | 31.17 | 14.78 | 0.02 | No |
| NTRKR1 | SUDHL-6 | 31.29 | 15.83 | 0.04 | No |
| NTRKR1 | Karpas 422 | 19.91 | 15.64 | 94.1 | Yes |
| NTRKR1 | OCI-LY1 | 20.56 | 17.26 | 181.6 | Yes |
| NTRKR1 | Tonsillar B-cell | 26.55 | 15.73 | N/A | No |
| CDK8 | SUDHL-4 | 21.36 | 14.78 | 4.2 | Yes |
| CDK8 | SUDHL-6 | 23.31 | 15.83 | 2.3 | NMDA |
| CDK8 | Karpas 422 | 22.07 | 15.64 | 4.7 | Yes |
| CDK8 | OCI-LY1 | 22.81 | 17.26 | 8.5 | Yes |
| CDK8 | Tonsillar B-cell | 24.38 | 15.73 | N/A | Yes |
| HRYK | SUDHL-4 | 25.26 | 16.25 | 0.5 | NMDA |
| HRYK | SUDHL-6 | 22.87 | 16.96 | 5.8 | Yes |
| HRYK | Karpas 422 | 22.24 | 16.14 | 7.9 | Yes |
| HRYK | OCI-LY1 | 21.39 | 18.95 | 43 | Yes |
| HRYK | Tonsillar B-cell | 25.3 | 17.45 | N/A | Yes |
| EST 1 | SUDHL-4 | 44.29 | 16.25 | 0.0004 | Yes |
| EST 1 | SUDHL-6 | 31.36 | 16.96 | 6.3 | Yes |
| EST 1 | Karpas 422 | 28.64 | 16.14 | 36.2 | Yes |
| EST 1 | OCI-LY1 | 30.64 | 18.95 | 27.4 | Yes |
| EST 1 | Tonsillar B-cell | 33.9 | 17.45 | N/A | Yes |
| EST 2 | SUDHL-4 | 25.53 | 16.25 | 7.2 | Yes |
| EST 2 | SUDHL-6 | 25.46 | 16.96 | 15.6 | Yes |
| EST 2 | Karpas 422 | 26.48 | 16.14 | 6.8 | Yes |
| EST 2 | OCI-LY1 | 27.14 | 18.95 | 13 | Yes |
| EST 2 | Tonsillar B-cell | 29.32 | 17.45 | N/A | Yes |
| EST 3 | SUDHL-4 | 21.45 | 16.25 | 3.3 | Yes |
| EST 3 | SUDHL-6 | 22.3 | 16.96 | 3.8 | Yes |
| EST 3 | Karpas 422 | 20.93 | 16.14 | 8.7 | Yes |
| EST 3 | OCI-LY1 | 21.32 | 18.95 | 20 | Yes |
| EST 3 | Tonsillar B-cell | 24.13 | 17.45 | N/A | Yes |
| Down-regulated genes by microarray analysis (in all 4 cell lines) | |||||
| JunB | SUDHL-4 | 21.91 | 14.78 | 0.02 | Yes |
| JunB | SUDHL-6 | 23.18 | 15.83 | 0.02 | Yes |
| JunB | Karpas 422 | 22.95 | 15.84 | 0.02 | Yes |
| JunB | OCI-LY1 | 22 | 17.26 | 0.1 | Yes |
| JunB | Tonsillar B-cell | 17.25 | 15.73 | N/A | Yes |
| JunD | SUDHL-4 | 28.66 | 14.78 | 0.07 | Yes |
| JunD | SUDHL-6 | 28.66 | 15.83 | 0.2 | Yes |
| JunD | Karpas 422 | 28.95 | 15.64 | 0.1 | Yes |
| JunD | OCI-LY1 | 28.17 | 17.26 | 0.55 | Yes |
| JunD | Tonsillar B-cell | 25.8 | 15.73 | N/A | Yes |
| FosB | SUDHL-4 | 31.65 | 14.78 | 0.2 | Yes |
| FosB | SUDHL-6 | 32.24 | 15.83 | 0.3 | Yes |
| FosB | Karpas 422 | 31.2 | 15.64 | 0.54 | Yes |
| FosB | OCI-LY1 | 31.89 | 17.26 | 0.98 | No |
| FosB | Tonsillar B-cell | 30.4 | 15.73 | N/A | No |
CT, Crossing Threshold; GAPDH, glyceraldehyde-3-phosphate dehydrogenase; SCD, stearoyl-CoA desaturase; NTRKR1, kinase, receptor-related 1; CDK8, cyclin-dependent kinase 8; HRYK, human receptor-like tyrosine kinase; EST = expre, N/A, not applicable; NMDA, no microarray data available; RT-PCR, Reverse transcriptase-polymerase chain reaction.
Confirmation of BCL-2 Protein Expression by Immunoblotting
All six of the lymphoma cell lines in our study also over-expressed bcl-2 mRNA by microarray analysis (Tables 2 and 3) . We confirmed the expression BCL-2 protein in each of our t(14;18)-positive cell lines and mantle-cell lines by immunoblotting (data not shown).
Discussion
In this study, we analyzed the gene expression profiles of four B-cell lymphoma cell lines containing the t(14;18) and two mantle-cell lymphoma-derived cell lines containing the t(11;14) using cDNA microarrays consisting of almost 4500 genes. We found that we could readily discriminate the t(14;18)-positive cell lines from those derived from another aggressive B-cell lymphoma, mantle-cell lymphoma. The t(14;18)-positive cell lines also exhibited a transcriptional profile that included a number of differentially expressed genes that could contribute to the development of NHLs harboring the t(14;18), including several novel genes with no known function. Up-regulated genes identified by microarray analysis included a number of genes involved in the promotion of cellular proliferation and survival, as well as cell metabolism. Many of these genes have also been found to be over-expressed in a variety of carcinomas and lymphomas. For example, stearoyl-CoA desaturase (0 δ0 -9-desaturase) (Table 2 , Group 2), a key enzyme involved in the biosynthesis of unsaturated fatty acids, 38 has previously been shown to be over-expressed in colonic and esophageal carcinomas, as well as in hepatocellular adenomas. 39 A number of human lymphoma and leukemia cell lines express this gene, 40 and it has also been found to be over-expressed in experimentally induced mammary carcinogenesis in rats. 41
Another interesting over-expressed gene identified by microarray analysis in the t(14;18) cell lines was cyclin-dependent kinase 8 (CDK8) (Table 2 , Group 1). CDK8 and its cyclin partner, cyclin C, 42 are components of the RNA polymerase II holoenzyme complex, functioning as a protein kinase that phosphorylates the carboxy-terminal domain of the largest subunit of RNA polymerase II, thereby regulating its transcriptional activity. 43, 44 CDK8 can also function as a transcriptional activator when fused to the DNA binding domain of GAL4, and this activity is independent of the kinase activity of the protein. 43 Interestingly, CDK8’s cyclin partner, cyclin C, is frequently mutated in acute lymphoblastic leukemias. 45, 46
Our studies also revealed that the human receptor-like tyrosine kinase (H-Ryk) was over-expressed in the t(14;18)-positive cell lines (Table 2 , Group 1). This gene was originally identified as a PCR-amplified cDNA fragment from a chronic myelogenous leukemia cell line (K-562) 47 and subsequently found to be expressed in a wide variety of human tissues. 48, 49 H-Ryk over-expression can induce anchorage-independent growth in the mouse fibroblast NIH3T3 cell line and also produces tumors when H-Ryk-transfected fibroblasts are inoculated into nude mice. 50 H-Ryk is also over-expressed in malignant ovarian tumors, 51 and over-expression of this gene has been correlated with significantly decreased overall survival and progression-free survival in patients with these tumors. 52
Interestingly, one of the over-expressed genes identified in our study, neurotrophic tyrosine kinase, receptor-related 1 (NTRKR1 or Ror1) (Table 2 , Group 1), had previously been found to be up-regulated in some DLBCL tissue samples by another recent microarray study by Alizadeh et al. 21 NTRKR1/Ror1 was originally identified in a neuroblastoma cell line 53 and was subsequently found to be expressed in a wide variety of human adult and fetal tissues and a number of additional human tumor cell lines derived from neuroblastomas, medulloblastomas, melanomas, small cell lung carcinomas, leukemias, and lymphomas. 54
The two mantle-cell lymphoma lines in our study also over-expressed a small proportion of the same genes as the t(14;18)-containing DLBCL cell lines (Table 3) . However, the global gene expression profiles in these two cell lines permitted them to be readily discriminated from the four t(14;18)-positive cell lines (Figure 1) . Interestingly, the genes over-expressed in both the t(14;18)- and t(11;14)-positive cell lines also included the stearoyl-CoA desaturase, CDK8, and H-Ryk genes mentioned above. As expected, both mantle-cell lymphoma cell lines also over-expressed cyclin D1 and other genes in the cyclin D1 pathway, including cyclin-dependent kinase 4 (CDK4), activating transcription factor 3 (ATF3), and the E2F transcription factor dimerization partner DP-2 (data not shown). In addition to these genes, we also found that a number of the over-expressed genes in our mantle-cell lymphoma lines were reported to be up-regulated in a recent microarray study of mantle-cell lymphomas, 55 including bcl-2, v-myb, the human homolog of mouse double minute 2 (MDM2), and H1 histone, family member 0 (data not shown).
Down-regulated genes identified by microarray analysis in the t(14;18)-positive cell lines included negative regulators of cell activation and growth, mediators of cell adhesion, major histocompatibility complex genes, genes possibly involved in the apoptosis process, and a large group of miscellaneous genes that could not be further categorized (Table 4 , Groups 1–5). The genes in Group 1 included a number of protein phosphatases that may act to down-regulate signal transduction pathways that promote cell growth, 56 TGF-β1, a potent inhibitor of cellular proliferation, 57 and endoglin, a member of the TGF-β superfamily of receptors. 58 The genes in Group 1 of Table 4 also include two members of the AP-1 (activating protein-1) family of transcription factors that consists of homodimers and heterodimers of Jun (v-Jun, c-Jun, JunB, JunD), Fos (v-Fos, c-Fos, FosB, Fra1, Fra2), Jun dimerization partners (JDP1 and JDP2), or activating transcription factor (ATF2, ATF3, B-ATF) proteins. 59 In contrast to c-Jun, a well-known promoter of cell proliferation, JunB and JunD are both potent negative regulators of proliferation. c-Jun expression results in up-regulation of cyclin D1 expression and down-regulation of the cyclin-dependent kinase inhibitor p16, while JunB expression has the opposite effect on these genes, resulting in inhibition of cell growth. 60 Another member of the Jun family of proteins, JunD, causes slowing of cellular proliferation and accumulation of cells in the G1 phase of the cell cycle when it is over-expressed in immortalized fibroblasts. 61 JunD-deficient immortalized fibroblasts also display higher proliferation rates than their wild-type counterparts. 62 Interestingly, TGF-β regulates the transcription (induction) of both JunB and FosB (another AP-1 family member in Group 5 of Table 4 ), 57 suggesting that low TGF-β expression may also contribute to the low levels of JunB and FosB observed in our cell lines. Presumably, reduced expression of the phosphatases and other members of this category might confer an increased proliferative advantage on these tumor cell lines.
The two under-expressed genes in Group 2 (Table 4) , CD53 and lysosomal-associated multi-spanning membrane protein-5 (LAPTM5), have been recently implicated in the process of apoptosis. The expression of CD53 (a tetraspanin) is elevated in both apoptotic human neutrophils 63 and in an apoptosis-sensitive B-cell mouse lymphoma cell line. 64 The lysosome-associated protein LAPTM5 was originally identified as a gene that was preferentially expressed by adult human hematopoietic tissues, 65 but a rat homologue of this gene was recently found to be up-regulated in response to neuronal apoptosis. 66
A number of the down-regulated genes in Group 3 (Table 4) are cell adhesion molecules involved in cell-cell and cell-matrix interactions. Cell adhesion molecules have a significant role in lymphoma dissemination and may also contribute to lymphoma aggressiveness. 67 For example, studies of L-selectin expression in NHL have shown that the majority of nodal lymphomas express this protein, whereas aggressive disseminated B-cell and T-cell lymphomas are generally L-selectin negative. 67 Several experimental and clinical studies also suggest an important role for CD44 in the biological behavior of NHL and suggest that CD44 may be a useful marker for predicting disease outcome. 67 Thus, down-regulation of adhesion molecules may be related to the propensity of high-grade lymphomas to metastasize. 68, 69, 70
The under-expressed genes in Group 4 (Table 4) consists of a number of major histocompatibility complex genes. Interestingly, loss of human leukocyte antigen (HLA) class I and class II expression has been described in a subset of aggressive B-cell lymphomas (consisting primarily of DLBCLs), and this loss correlated with extra nodal disease 71 and poor survival. 72, 73, 74 Similarly, a recent study of 258 DLBCLs found extensive loss of heterozygosity within the HLA region on the p arm of chromosome 6, primarily in extranodal lymphomas. 75 The authors of this study also speculated that a structural loss of HLA class I and II gene expression might contribute to escape of aggressive B-cell lymphomas from immune surveillance. All four of the DLBCL cell lines used for this study were derived from extranodal lymphomas, 25, 27 and one of the cell lines (SUDHL-6) has been reported to have a 6p deletion. 30
In summary, this study demonstrates the utility of the combination of cDNA microarray analysis and quantitative real-time RT-PCR for rapid assessment of the transcriptional changes that characterize t(14;18)-positive lymphoma cell lines, and also for the identification of novel genes that could act in concert with deregulated BCL-2 in the genesis and progression of t(14;18)-positive NHLs. A comparison of the gene expression profiles of the t(14;18) cell lines to that of a reactive tonsillar B-lymphocyte population also allowed the identification of a number of novel genes that could potentially contribute to the genesis of t(14;18)-positive DLBCL. However, we have not ruled out the possibility that some of the differentially expressed genes identified by this study might simply be due to the microenvironment of the cell lines in culture (especially for genes involved in cellular metabolism). Confirmation of the utility of our approach is evidenced by the fact that we were able to validate approximately 80% of the gene expression trends observed by microarray analysis by real-time quantitative fluorescence RT-PCR. This method allows rapid confirmation of microarray expression data with very little starting material (1 μg of total RNA or less), making it extremely useful for RT-PCR confirmation testing of microarray data obtained from small clinical specimens such as lymph node biopsies.
Although the results of this study are preliminary in nature, they provide a number of potential targets for further analysis in primary patient tumor samples that might provide additional insights into the process of lymphomagenesis. Indeed, we have noted that a number of the differentially expressed genes identified in the t(14;18)-positive cell lines also exhibited differential regulation in a cDNA microarray analysis of various B-cell lymphomas by Alizadeh et al. 21 For example, myb and BCL-2 were over-expressed in the follicular lymphomas in the Alizadeh et al 21 study, and interleukin regulatory factor 1 (IRF-1) was under-expressed in these lymphomas. In our cDNA microarray study, we also observed over-expression of myb and BCL-2 and under-expression of IRF-1 in all four of the t(14;18)-positive cell lines (Figure 2) . Collectively, these data suggest a potential relationship between follicular lymphomas and t(14;18)-positive DLBCLs. Furthermore, as a result of genomic-scale microarray-based analyses, new targets for diagnostic refinement and novel therapeutic approaches may emerge from the analysis of newly identified differentially expressed genes. 76
Address reprint requests to Dr. Kojo S. J. Elenitoba-Johnson, Division of Anatomic Pathology, University of Utah Health Sciences Center, 50 North Medical Drive, Salt Lake City, UT 84132. E-mail: kojo.elenitobaj@path.utah.edu.
Footnotes
Supported by grant CA83984–01 from the National Institutes of Health (NIH) to K.S.J. E.-J. and the ARUP Institute for Clinical and Experimental Pathology. R.S.R. receives partial support from a National Institutes of Health Hematology Training Grant (T32 DK07115–24) and a College of American Pathologists Foundation Research Fellowship.
References
- 1.Yunis JJ, Oken MM, Kaplan ME, Ensrud KM, Howe RR, Theologides A: Distinctive chromosomal abnormalities in histologic subtypes of non-Hodgkin’s lymphoma. N Engl J Med 1982, 307:1231-1236 [DOI] [PubMed] [Google Scholar]
- 2.Jacobson JO, Wilkes BM, Kwaiatkowski DJ, Medeiros LJ, Aisenberg AC, Harris NL: Bcl-2 rearrangements in de novo diffuse large-cell lymphoma: association with distinctive clinical features. Cancer 1993, 72:231-236 [DOI] [PubMed] [Google Scholar]
- 3.Weiss LM, Warnke RA, Sklar J, Cleary ML: Molecular analysis of the t(14;18) chromosomal translocation in malignant lymphomas. N Engl J Med 1987, 317:1185-1189 [DOI] [PubMed] [Google Scholar]
- 4.Cleary ML, Sklar J: Nucleotide sequence of a t(14;18) chromosomal breakpoint in follicular lymphoma and demonstration of a breakpoint-cluster region near a transcriptionally active locus on chromosome 18. Proc Natl Acad Sci USA 1985, 82:7439-7443 [DOI] [PMC free article] [PubMed] [Google Scholar]
- 5.Bakhshi A, Jensen JP, Goldman P, Wright JJ, McBride OW, Epstein AL, Korsmeyer SJ: Cloning the chromosomal breakpoint of t(14;18) human lymphomas: clustering around JH on chromosome 14 and near a transcriptional unit on 18. Cell 1985, 41:899-906 [DOI] [PubMed] [Google Scholar]
- 6.Tsujimoto Y, Gorham J, Cossman J, Jaffe E, Croce CM: The t(14;18) chromosome translocations involved in B-cell neoplasms result from mistakes in VDJ joining. Science 1985, 229:1390-1393 [DOI] [PubMed] [Google Scholar]
- 7.Graninger WB, Seto M, Boutain B, Goldman P, Korsmeyer SJ: Expression of Bcl-2 and Bcl-2-Ig fusion transcripts in normal and neoplastic cells. J Clin Invest 1987, 80:1512-1515 [DOI] [PMC free article] [PubMed] [Google Scholar]
- 8.Seto M, Jaeger U, Hockett RD, Graninger W, Bennett S, Goldman P, Korsmeyer SJ: Alternative promoters and exons, somatic mutation, and deregulation of the Bcl-2-Ig fusion gene in lymphoma. EMBO J 1988, 7:123-131 [DOI] [PMC free article] [PubMed] [Google Scholar]
- 9.Hockenbery D, Nunez G, Milliman C, Schreiber RD, Korsmeyer SJ: Bcl-2 is an inner mitochondrial membrane protein that blocks programmed cell death. Nature 1990, 348:334-336 [DOI] [PubMed] [Google Scholar]
- 10.Nunez G, London L, Hockenbery D, Alexander M, McKearn JP, Korsmeyer SJ: Deregulated Bcl-2 gene expression selectively prolongs survival of growth factor-deprived hemopoietic cell lines. J Immunol 1990, 144:3602-3610 [PubMed] [Google Scholar]
- 11.McDonnell TJ, Deane N, Platt FM, Nunez G, Jaeger U, McKearn JP, Korsmeyer SJ: Bcl-2-immunoglobulin transgenic mice demonstrate extended B cell survival and follicular lymphoproliferation. Cell 1989, 57:79-88 [DOI] [PubMed] [Google Scholar]
- 12.Reed JC, Cuddy M, Slabiak T, Croce CM, Nowell PC: Oncogenic potential of bcl-2 demonstrated by gene transfer. Nature 1988, 336:259-261 [DOI] [PubMed] [Google Scholar]
- 13.McDonnell TJ, Korsmeyer SJ: Progression from lymphoid hyperplasia to high-grade malignant lymphoma in mice transgenic for the t(14;18). Nature 1991, 349:254-256 [DOI] [PubMed] [Google Scholar]
- 14.Limpens J, de Jong D, van Krieken JH, Price CG, Young BD, van Ommen GJ, Kluin PM: Bcl-2/JH rearrangements in benign lymphoid tissues with follicular hyperplasia. Oncogene 1991, 6:2271-2276 [PubMed] [Google Scholar]
- 15.Schena M, Shalon D, Davis RW, Brown PO: Quantitative monitoring of gene expression patterns with a complementary DNA microarray. Science 1995, 270:467-470 [DOI] [PubMed] [Google Scholar]
- 16.Schena M, Shalon D, Heller R, Chai A, Brown PO, Davis RW: Parallel human genome analysis: microarray-based expression monitoring of 1000 genes. Proc Natl Acad Sci USA 1996, 93:10614-10619 [DOI] [PMC free article] [PubMed] [Google Scholar]
- 17.DeRisi J, Penland L, Brown PO, Bittner ML, Meltzer PS, Ray M, Chen Y, Su YA, Trent JM: Use of a cDNA microarray to analyse gene expression patterns in human cancer. Nat Genet 1996, 14:457-460 [DOI] [PubMed] [Google Scholar]
- 18.Heller RA, Schena M, Chai A, Shalon D, Bedilion T, Gilmore J, Woolley DE, Davis RW: Discovery and analysis of inflammatory disease-related genes using cDNA microarrays. Proc Natl Acad Sci USA 1997, 94:2150-2155 [DOI] [PMC free article] [PubMed] [Google Scholar]
- 19.Ross DT, Scherf U, Eisen MB, Perou CM, Rees C, Spellman P, Iyer V, Jeffrey SS, Van de Rijn M, Waltham M, Pergamenschikov A, Lee JC, Lashkari D, Shalon D, Myers TG, Weinstein JN, Botstein D, Brown PO: Systematic variation in gene expression patterns in human cancer cell lines. Nat Genet 2000, 24:227-235 [DOI] [PubMed] [Google Scholar]
- 20.Perou CM, Sorlie T, Eisen MB, van de Rijn M, Jeffrey SS, Rees CA, Pollack JR, Ross DT, Johnsen H, Akslen LA, Fluge O, Pergamenschikov A, Williams C, Zhu SX, Lonning PE, Borresen-Dale AL, Brown PO, Botstein D: Molecular portraits of human breast tumours. Nature 2000, 406:747-752 [DOI] [PubMed] [Google Scholar]
- 21.Alizadeh AA, Eisen MB, Davis RE, Ma C, Lossos IS, Rosenwald A, Boldrick JC, Sabet H, Tran T, Yu X, Powell JI, Yang L, Marti GE, Moore T, Hudson J, Jr, Lu L, Lewis DB, Tibshirani R, Sherlock G, Chan WC, Greiner TC, Weisenburger DD, Armitage JO, Warnke R, Levy R, Wilson W, Grever MR, Byrd JC, Botstein D, Brown PO, Staudt LM: Distinct types of diffuse large B-cell lymphoma identified by gene expression profiling. Nature 2000, 403:503-511 [DOI] [PubMed] [Google Scholar]
- 22.Welsh JB, Zarrinkar PP, Sapinoso LM, Kern SG, Behling CA, Monk BJ, Lockhart DJ, Burger RA, Hampton GM: Analysis of gene expression profiles in normal and neoplastic ovarian tissue samples identifies candidate molecular markers of epithelial ovarian cancer. Proc Natl Acad Sci USA 2001, 98:1176-1181 [DOI] [PMC free article] [PubMed] [Google Scholar]
- 23.Li S, Ross DT, Kadin ME, Brown PO, Wasik MA: Comparative genome-scale analysis of gene expression profiles in T cell lymphoma cells during malignant progression using a complementary DNA microarray. Am J Pathol 2001, 158:1231-1237 [DOI] [PMC free article] [PubMed] [Google Scholar]
- 24.Young AN, Amin MB, Moreno CS, Lim SD, Cohen C, Petros JA, Marshall FF, Neish AS: Expression profiling of renal epithelial neoplasms: a method for tumor classification and discovery of diagnostic molecular markers. Am J Pathol 2001, 158:1639-1651 [DOI] [PMC free article] [PubMed] [Google Scholar]
- 25.Epstein AL, Levy R, Kim H, Henle W, Henle G, Kaplan HS: Biology of the human malignant lymphomas: IV. functional characterization of ten diffuse histiocytic lymphoma cell lines. Cancer 1978, 42:2379-2391 [DOI] [PubMed] [Google Scholar]
- 26.Dyer MJ, Fischer P, Nacheva E, Labastide W, Karpas A: A new human B-cell non-Hodgkin’s lymphoma cell line (Karpas 422) exhibiting both t (14;18) and t(4;11) chromosomal translocations. Blood 1990, 75:709-714 [PubMed] [Google Scholar]
- 27.Tweeddale ME, Lim B, Jamal N, Robinson J, Zalcberg J, Lockwood G, Minden MD, Messner HA: The presence of clonogenic cells in high-grade malignant lymphoma: a prognostic factor. Blood 1987, 69:1307-1314 [PubMed] [Google Scholar]
- 28.Saltman DL, Cachia PG, Dewar AE, Ross FM, Krajewski AS, Ludlam C, Steel CM: Characterization of a new non-Hodgkin’s lymphoma cell line (NCEB-1) with a chromosomal (11:14) translocation [t(11:14)(q13;q32)]. Blood 1988, 72:2026-2030 [PubMed] [Google Scholar]
- 29.Jadayel DM, Lukas J, Nacheva E, Bartkova J, Stranks G, De Schouwer PJ, Lens D, Bartek J, Dyer MJ, Kruger AR, Catovsky D: Potential role for concurrent abnormalities of the cyclin D1, p16CDKN2, and p15CDKN2B genes in certain B-cell non-Hodgkin’s lymphomas: functional studies in a cell line (Granta 519). Leukemia 1997, 11:64-72 [DOI] [PubMed] [Google Scholar]
- 30.Hecht BK, Epstein AL, Berger CS, Kaplan HS, Hecht F: Histiocytic lymphoma cell lines: immunologic and cytogenetic studies. Cancer Genet Cytogenet 1985, 14:205-218 [DOI] [PubMed] [Google Scholar]
- 31.Farrugia MM, Duan LJ, Reis MD, Ngan BY, Berinstein NL: Alterations of the p53 tumor suppressor gene in diffuse large cell lymphomas with translocations of the c-MYC and BCL-2 proto-oncogenes. Blood 1994, 83:191-198 [PubMed] [Google Scholar]
- 32.Chang H, Blondal JA, Benchimol S, Minden MD, Messner HA: p53 mutations, c-myc and bcl-2 rearrangements in human non-Hodgkin’s lymphoma cell lines. Leuk Lymphoma 1995, 19:165-171 [DOI] [PubMed] [Google Scholar]
- 33.Morgan JW, Reddy GS, Uskokovic MR, May BK, Omdahl JL, Maizel AL, Sharma S: Functional block for 1 α 25-dihydroxyvitamin D3-mediated gene regulation in human B lymphocytes. J Biol Chem 1994, 269:13437-13443 [PubMed] [Google Scholar]
- 34.Lee ML, Kuo FC, Whitmore GA, Sklar J: Importance of replication in microarray gene expression studies: statistical methods and evidence from repetitive cDNA hybridizations. Proc Natl Acad Sci USA 2000, 97:9834-9839 [DOI] [PMC free article] [PubMed] [Google Scholar]
- 35.Morrison TB, Weis JJ, Wittwer CT: Quantification of low-copy transcripts by continuous SYBR Green I monitoring during amplification. Biotechniques 1998, 24:954-958, 960, 962 [PubMed] [Google Scholar]
- 36.Elenitoba-Johnson KSJ, Bohling SD, Jenson SD, Lin Z, Monnin KA, Lim MS: Fluorescence PCR quantification of cyclin D1 expression. J Mol Diagn 2002, 4:90-96 [DOI] [PMC free article] [PubMed] [Google Scholar]
- 37.Rajeevan MS, Vernon SD, Taysavang N, Unger ER: Validation of array-based gene expression profiles by real-time (kinetic) RT-PCR. J Mol Diagn 2001, 3:26-31 [DOI] [PMC free article] [PubMed] [Google Scholar]
- 38.Ntambi JM: Regulation of stearoyl-CoA desaturase by polyunsaturated fatty acids and cholesterol. J Lipid Res 1999, 40:1549-1558 [PubMed] [Google Scholar]
- 39.Li J, Ding SF, Habib NA, Fermor BF, Wood CB, Gilmour RS: Partial characterization of a cDNA for human stearoyl-CoA desaturase and changes in its mRNA expression in some normal and malignant tissues. Int J Cancer 1994, 57:348-352 [DOI] [PubMed] [Google Scholar]
- 40.Marzo I, Martinez-Lorenzo MJ, Anel A, Desportes P, Alava MA, Naval J, Pineiro A: Biosynthesis of unsaturated fatty acids in the main cell lineages of human leukemia and lymphoma. Biochim Biophys Acta 1995, 1257:140-148 [DOI] [PubMed] [Google Scholar]
- 41.Lu J, Pei H, Kaeck M, Thompson HJ: Gene expression changes associated with chemically induced rat mammary carcinogenesis. Mol Carcinog 1997, 20:204-215 [DOI] [PubMed] [Google Scholar]
- 42.Tassan JP, Jaquenoud M, Leopold P, Schultz SJ, Nigg EA: Identification of human cyclin-dependent kinase 8, a putative protein kinase partner for cyclin C. Proc Natl Acad Sci USA 1995, 92:8871-8875 [DOI] [PMC free article] [PubMed] [Google Scholar]
- 43.Gold MO, Tassan JP, Nigg EA, Rice AP, Herrmann CH: Viral transactivators E1A and VP16 interact with a large complex that is associated with CTD kinase activity and contains CDK8. Nucleic Acids Res 1996, 24:3771-3777 [DOI] [PMC free article] [PubMed] [Google Scholar]
- 44.Rickert P, Seghezzi W, Shanahan F, Cho H, Lees E: Cyclin C/CDK8 is a novel CTD kinase associated with RNA polymerase II. Oncogene 1996, 12:2631-2640 [PubMed] [Google Scholar]
- 45.Li H, Lahti JM, Valentine M, Saito M, Reed SI, Look AT, Kidd VJ: Molecular cloning and chromosomal localization of the human cyclin C (CCNC) and cyclin E (CCNE) genes: deletion of the CCNC gene in human tumors. Genomics 1996, 32:253-259 [DOI] [PubMed] [Google Scholar]
- 46.Jackson A, Carrara P, Duke V, Sinclair P, Papaioannou M, Harrison CJ, Foroni L: Deletion of 6q16–q21 in human lymphoid malignancies: a mapping and deletion analysis. Cancer Res 2000, 60:2775-2779 [PubMed] [Google Scholar]
- 47.Partanen J, Makela TP, Alitalo R, Lehvaslaiho H, Alitalo K: Putative tyrosine kinases expressed in K-562 human leukemia cells. Proc Natl Acad Sci USA 1990, 87:8913-8917 [DOI] [PMC free article] [PubMed] [Google Scholar]
- 48.Stacker SA, Hovens CM, Vitali A, Pritchard MA, Baker E, Sutherland GR, Wilks AF: Molecular cloning and chromosomal localisation of the human homologue of a receptor related to tyrosine kinases (RYK). Oncogene 1993, 8:1347-1356 [PubMed] [Google Scholar]
- 49.Tamagnone L, Partanen J, Armstrong E, Lasota J, Ohgami K, Tazunoki T, LaForgia S, Huebner K, Alitalo K: The human ryk cDNA sequence predicts a protein containing two putative transmembrane segments and a tyrosine kinase catalytic domain. Oncogene 1993, 8:2009-2014 [PubMed] [Google Scholar]
- 50.Katso RM, Manek S, Biddolph S, Whittaker R, Charnock MF, Wells M, Ganesan TS: Overexpression of H-Ryk in mouse fibroblasts confers transforming ability in vitro and in vivo: correlation with up-regulation in epithelial ovarian cancer. Cancer Res 1999, 59:2265-2270 [PubMed] [Google Scholar]
- 51.Wang XC, Katso R, Butler R, Hanby AM, Poulsom R, Jones T, Sheer D, Ganesan TS: H-RYK, an unusual receptor kinase: isolation and analysis of expression in ovarian cancer. Mol Med 1996, 2:189-203 [PMC free article] [PubMed] [Google Scholar]
- 52.Katso RM, Manek S, Ganjavi H, Biddolph S, Charnock MF, Bradburn M, Wells M, Ganesan TS: Over-expression of H-Ryk in epithelial ovarian cancer: prognostic significance of receptor expression. Clin Cancer Res 2000, 6:3271-3281 [PubMed] [Google Scholar]
- 53.Masiakowski P, Carroll RD: A novel family of cell surface receptors with tyrosine kinase-like domain. J Biol Chem 1992, 267:26181-26190 [PubMed] [Google Scholar]
- 54.Reddy UR, Phatak S, Pleasure D: Human neural tissues express a truncated Ror1 receptor tyrosine kinase, lacking both extracellular and transmembrane domains. Oncogene 1996, 13:1555-1559 [PubMed] [Google Scholar]
- 55.Hofmann WK, de Vos S, Tsukasaki K, Wachsman W, Pinkus GS, Said JW, Koeffler HP: Altered apoptosis pathways in mantle-cell lymphoma detected by oligonucleotide microarray. Blood 2001, 98:787-794 [DOI] [PubMed] [Google Scholar]
- 56.Frearson JA, Alexander DR: The role of phosphotyrosine phosphatases in haematopoietic cell signal transduction. Bioessays 1997, 19:417-427 [DOI] [PubMed] [Google Scholar]
- 57.de Caestecker MP, Piek E, Roberts AB: Role of transforming growth factor-β signaling in cancer. J Natl Cancer Inst 2000, 92:1388-1402 [DOI] [PubMed] [Google Scholar]
- 58.Fonsatti E, Del Vecchio L, Altomonte M, Sigalotti L, Nicotra MR, Coral S, Natali PG, Maio M: Endoglin: an accessory component of the TGF-β-binding receptor-complex with diagnostic, prognostic, and bioimmunotherapeutic potential in human malignancies. J Cell Physiol 2001, 188:1-7 [DOI] [PubMed] [Google Scholar]
- 59.Shaulian E, Karin M: AP-1 in cell proliferation and survival. Oncogene 2001, 20:2390-2400 [DOI] [PubMed] [Google Scholar]
- 60.Mechta-Grigoriou F, Gerald D, Yaniv M: The mammalian Jun proteins: redundancy and specificity. Oncogene 2001, 20:2378-2389 [DOI] [PubMed] [Google Scholar]
- 61.Pfarr CM, Mechta F, Spyrou G, Lallemand D, Carillo S, Yaniv M: Mouse JunD negatively regulates fibroblast growth and antagonizes transformation by ras. Cell 1994, 76:747-760 [DOI] [PubMed] [Google Scholar]
- 62.Weitzman JB, Fiette L, Matsuo K, Yaniv M: JunD protects cells from p53-dependent senescence and apoptosis. Mol Cell 2000, 6:1109-1119 [DOI] [PubMed] [Google Scholar]
- 63.Beinert T, Munzing S, Possinger K, Krombach F: Increased expression of the tetraspanins CD53 and CD63 on apoptotic human neutrophils. J Leukoc Biol 2000, 67:369-373 [DOI] [PubMed] [Google Scholar]
- 64.Voehringer DW, Hirschberg DL, Xiao J, Lu Q, Roederer M, Lock CB, Herzenberg LA, Steinman L: Gene microarray identification of redox and mitochondrial elements that control resistance or sensitivity to apoptosis. Proc Natl Acad Sci USA 2000, 97:2680-2685 [DOI] [PMC free article] [PubMed] [Google Scholar]
- 65.Adra CN, Zhu S, Ko JL, Guillemot JC, Cuervo AM, Kobayashi H, Horiuchi T, Lelias JM, Rowley JD, Lim B: LAPTM5: a novel lysosomal-associated multi-spanning membrane protein preferentially expressed in hematopoietic cells. Genomics 1996, 35:328-337 [DOI] [PubMed] [Google Scholar]
- 66.Origasa M, Tanaka S, Suzuki K, Tone S, Lim B, Koike T: Activation of a novel microglial gene encoding a lysosomal membrane protein in response to neuronal apoptosis. Brain Res Mol Brain Res 2001, 88:1-13 [DOI] [PubMed] [Google Scholar]
- 67.Drillenburg P, Pals ST: Cell adhesion receptors in lymphoma dissemination. Blood 2000, 95:1900-1910 [PubMed] [Google Scholar]
- 68.Terol MJ, Cid MC, Lopez-Guillermo A, Juan M, Yague J, Miralles A, Vilella R, Vives J, Cardesa A, Montserrat E, Campo E: Expression of intercellular adhesion molecule-3 (ICAM-3/CD50) in malignant lymphoproliferative disorders and solid tumors. Tissue Antigens 1996, 48:271-277 [DOI] [PubMed] [Google Scholar]
- 69.Terol MJ, Lopez-Guillermo A, Bosch F, Villamor N, Cid MC, Campo E, Montserrat E: Expression of β-integrin adhesion molecules in non-Hodgkin’s lymphoma: correlation with clinical and evolutive features. J Clin Oncol 1999, 17:1869-1875 [DOI] [PubMed] [Google Scholar]
- 70.Terol MJ, Lopez-Guillermo A, Bosch F, Villamor N, Cid MC, Rozman C, Campo E, Montserrat E: Expression of the adhesion molecule ICAM-1 in non-Hodgkin’s lymphoma: relationship with tumor dissemination and prognostic importance. J Clin Oncol 1998, 16:35-40 [DOI] [PubMed] [Google Scholar]
- 71.Momburg F, Herrmann B, Moldenhauer G, Moller P: B-cell lymphomas of high-grade malignancy frequently lack HLA-DR, -DP and -DQ antigens and associated invariant chain. Int J Cancer 1987, 40:598-603 [DOI] [PubMed] [Google Scholar]
- 72.Slymen DJ, Miller TP, Lippman SM, Spier CM, Kerrigan DP, Rybski JA, Rangel CS, Richter LC, Grogan TM: Immunobiologic factors predictive of clinical outcome in diffuse large-cell lymphoma. J Clin Oncol 1990, 8:986-993 [DOI] [PubMed] [Google Scholar]
- 73.Guy K, Krajewski AS, Dewar AE: Expression of MHC class II antigens in human B-cell leukaemia and non-Hodgkin’s lymphoma. Br J Cancer 1986, 53:161-173 [DOI] [PMC free article] [PubMed] [Google Scholar]
- 74.O’Keane JC, Mack C, Lynch E, Harrington D, Neiman RS: Prognostic correlation of HLA-DR expression in large-cell lymphoma as determined by LN3 antibody staining: an Eastern Cooperative Oncology Group (ECOG) study. Cancer 1990, 66:1147-1153 [DOI] [PubMed] [Google Scholar]
- 75.Riemersma SA, Jordanova ES, Schop RF, Philippo K, Looijenga LH, Schuuring E, Kluin PM: Extensive genetic alterations of the HLA region, including homozygous deletions of HLA class II genes in B-cell lymphomas arising in immune-privileged sites. Blood 2000, 96:3569-3577 [PubMed] [Google Scholar]
- 76.Staudt LM, Brown PO: Genomic views of the immune system. Annu Rev Immunol 2000, 18:829-859 [DOI] [PubMed] [Google Scholar]