

Abstract
Protein tyrosine kinases (PTKs) control key functions of normal and malignant cells. Comparison of PTK gene expression among various cell populations may be achieved by amplification of the PTK cDNAs using degenerate primers which recognize two relatively invariable regions within their catalytic domain. This approach produces a mixture of PTK cDNA fragments with identical or very similar lengths which are difficult to separate by standard gel electrophoresis. These mixed products are then analyzed in a random fashion which leads to redundant cloning of some and potential omission of other PTKs. By using parallel denaturing gradient gel electrophoresis (DGGE) we have been able to separate the amplified PTK cDNAs derived from the same T-lymphocyte population and compare their expression between various types of normal and malignant T lymphocytes. One such PTK is the type I receptor for insulin-like growth factor, which we found to be preferentially expressed by neoplastic T cells on the both mRNA and protein levels. The combination of PCR which uses PTK-specific primers and parallel DGGE of the amplified PTK cDNAs may prove useful in studying mechanisms of cell activation and malignant transformation and in identifying targets for therapies based on selective inhibition of oncogenic PTKs.
Protein tyrosine kinases (PTKs) play a fundamental role in various aspects of cell biology, including cell proliferation, survival, adhesion, and motility by regulating ligand-mediated signal transduction, cell cycle progression, and cytoskeleton function. 1, 2, 3 Many PTKs have been shown to act as oncogenes 2, 3, 4 , and analysis of PTK expression by malignant cells will lead to a better understanding of oncogenesis, which in turn will lead to novel therapies based on selective inhibition of these PTKs which are identified as involved in malignant transformation. 5, 6 This approach has already been proven effective in chronic myeloid leukemia and related bcr/abl-PTK-positive disorders. 7
Expression of PTKs may be determined by RT-PCR using degenerate primers which recognize common, relatively invariable cDNA sequences of members of the PTK family. 8 This method permits detection of PTKs expressed by the selected cell population as shown for early hematopoietic cells 9, 10 ; however, it has a major drawback in that it is relatively non-selective, because it generates identical- or very similar-length (∼210 bp) products which are difficult to separate by standard electrophoresis. This frequently leads to cloning and sequencing of many redundant cDNAs to identify those uniquely expressed, particularly if mRNA for a few PTKs is very abundant or is easily amplified. Furthermore, this may also result in omission of some gene products represented by a small number of cDNA copies.
In this paper, we present a strategy to identify the expressed PTKs in a more efficient and comprehensive manner. As our experimental model we chose malignant T-cell lymphoma cells compared with normal resting and PHA-activated T cells and other lymphoid cell populations. The method is based on the combined selective amplification of PTK cDNA fragments using the degenerate PTK primers, and separation of the amplified fragments in parallel denaturing gradient gel electrophoresis (DGGE). This approach shows promise in the identification of PTK genes preferentially expressed by various types of lymphoid cells and, prospectively, also non-lymphoid cells. One PTK identified by this method is a type I receptor for insulin-like growth factor (IGF-IR) 11, 12 found to be preferentially expressed by malignant T-cell lymphoma cells when compared to their normal resting and mitogen-activated counterparts.
Materials and Methods
Transformed and Normal Cells
Three cell lines (PB-1, 2A, and 2B), established from a patient with a progressive cutaneous T-cell lymphoproliferative disorder, have been described in detail previously. 13 The PB-1 cell line was obtained at a relatively early stage of the patient’s cutaneous T-lymphoma from neoplastic T-cells circulating in peripheral blood. The 2A and 2B lines were established at a later, more aggressive stage from two separate skin nodules, which represented a high-grade, T-cell anaplastic large-cell lymphoma. LCL is a lymphoblastoid B-cell line obtained from the same patient as the PB-1, 2A, and 2B lines, by in vitro infection with Epstein-Barr virus (EBV). 14 The Sez4 T-cell line, kindly provided by T. Abrams of Hahnemann University, Philadelphia, PA, was derived from leukemic (Sezary) cells of a patient with a cutaneous T-cell lymphoma. 15 The human NK (YT) cell line 16 was kindly provided by J. Yodoi of Kyoto University, Kyoto, Japan. All of the cell lines were propagated in a complete RPMI/10% fetal bovine serum medium at 37°C and 5% CO2. 14 Peripheral blood mononuclear cells (PBMC) were obtained from healthy volunteers by centrifugation on the Ficoll-Paque (Pharmacia, Piscataway, NJ) gradient as described. 13 Mitogen (PHA)-stimulated blasts were obtained by 48 hours culture with 1 μg/ml of phytohemagglutinin P (Sigma, St. Louis, MO) in the complete RPMI 1640 medium.
PTK Inhibitors
Herbimycin A and genistein were purchased from Life Technologies (Gaithersburg, MD) and staurosporine was purchased from Sigma. The drugs were dissolved in ethanol, aliquoted, and stored in stock at −20°C. For the experiments the drugs were diluted to the appropriate concentration with cell culture medium; the medium alone or with the diluent corresponding to the highest drug concentration was used as a control.
Proliferation Assays
These tests were performed as previously described. 13, 17 In brief, the cell lines or normal PBMC were cultured for 52 hours in triplicate at 2 × 10⁴ cells/well in the presence of various concentrations of the PTK inhibitors and, in the case of PBMC, 1 μg/ml of phytohemagglutinin (PHA). After 14-hour pulse with 0.5 μCi of [3H]thymidine, the radioactivity of the cells was measured.
RNA Preparation
Total RNA was extracted from cells by the acid guanidinium isothiocyanate method. 18 Cells were washed in isotonic phosphate-buffered saline and resuspended in 4 mol/L guanidinium isothiocyanate, 25 mmol/L of sodium citrate (pH 7.0), 0.5% sarcosyl, 0.1 mol/L of 2-mercaptoethanol. After homogenization, the cells were extracted by phenol-chloroform-isoamyl alcohol and RNA was recovered by ethanol precipitation.
RT-PCR
The reaction was performed essentially as described. 13, 17 In brief, each 20-μl cDNA synthesis reaction solution contained 1 μg of total RNA, 1X buffer, 0.5 mmol/L dNTP, 10 mmol/L DTT, 0.25 μg oligo(dT)20, and 200 U of SuperScript TM II reverse transcriptase (Life Technologies). The reverse transcription reactions were carried out for 1 hour at 37°C and were heated to 75°C for 15 minutes to terminate the reaction. RNase H (Promega, Madison, WI) was added and the cDNA/RNA mixture was incubated for 30 minutes at 37°C. Centri-Sep columns (Princeton Separations, Princeton, NJ) were used to purify the cDNA.
PCR
PCR was performed in a volume of 50 μl which contained 2 μl of cDNA preparation, 1X PCR buffer, 200 μmol/L dNTPs, 1.5 mmol/L MgCl2, 0.5 μmol/L of primers, and 2 units Taq polymerase (Life Technologies). In some experiments 8 μCi α[32P]dCTP (Amersham, Arlington Heights, IL) was added to this mixture (see Results). The PCR primers specific for the PTK fragments were synthesized and purified by the Nucleic Acid Facility of the University of Pennsylvania Cancer Center and had the following sequences: 5`-CGG ATC CAC A/CGN GAC/T C/TT-3` and 5`-GGA ATT CCA A/TAG GAC CAG/C ACG/A TC-3`. The amplification was performed in the GeneAmp PCR System 2400 thermal cycler (Perkin Elmer, Norwalk, CT). The reaction started at 94°C for 3 minutes to completely denature the template, followed by 30 cycles: 45 seconds at 94°C, 30“ at 37°C, and 1.5 minutes at 72°C.
Parallel DGGE Separation
A parallel denaturing gradient gel was cast using 22.5 ml of 100% denaturing solution, which contained 4.23 ml of 40% acrylamide/bis (37.5:1), 450 μl 50X TAE buffer, 9 ml of formamide, and 9.45 g of urea and 7.5 ml of separate, 0% denaturing solution which contained 1.40 ml of 40% acrylamide/bis (37.7:1), and 150 μl of TAE buffer. Then 1/100 and 1/1000 of the total gel volume of, respectively, ammonium persulfate and TEMED were added to the solutions. The solutions were poured into syringes, attached onto the gradient delivery system (model 475; Bio-Rad, Hercules, CA), and applied into the gel sandwich; the targeted range of denaturating gradient was 20% to 75%. A comb was inserted into the gel sandwich, and the gel solution was cast on a steady surface to avoid mixing of the gradients within the gel sandwich. 1X TAE buffer was poured into the D-gene chamber (D GENE Denaturing Gel Electrophoresis System; Bio-Rad), preheating the running buffer and the gel sandwich to 60°C. Ten μl samples were loaded, and the gel was run at a constant voltage of 300 V for 3.5 hours at 60°C. The gel was then covered with plastic foil and subjected to autoradiography using X-ray film for 3 to 5 hours at 4°C.
DGGE Separation of Known PTKs
Three PTKs, which are members of the scr kinase family and are known to be expressed by T lymphocytes, were selectively amplified using nested PCR reaction from malignant T-cell lymphoma cell lines: 2B (lck, lyn kinases) and Sez4 (fyn). In the first PCR reaction, the following primer pairs were used: lck: 5′-CGG CTC TAC GCT GTG GTC ACC-3′ (upper), 5′-GTT GGT CAT CCC TGG GTA AGG-3′ (lower), lyn: 5′-CTC ATT GAC TTT TCT GCT CAG-3′ (upper), 5′-CAT TAG TTC TCC CTG GGT AGG-3′ (lower), and fyn: 5′-GAG CCC ATC TAC ATC GTC ACC-3′ (upper) and 5′-AGG GTC CTT TTT CCA GCA GTG-3′ (lower). These primer pairs, specific for a particular PTK, were designed to amplify fragments that include the entire invariable regions where PTK degenerate primers bind. Ten μmol of each primer pair was used to amplify 2 μl of cDNA by PCR according to the following protocol: 94°C for 3 minutes, followed by 35 cycles of 94°C for 45 seconds, 55°C for 30 seconds, and 72°C for 90 seconds, and terminating with 72°C for 10 minutes. One μl of each product was then PCR-amplified using a mixture of the above described degenerate PTK primers according to the following scheme: 94°C for 3 minutes, followed by 30 cycles of 94°C for 45 seconds, 50°C for 30 seconds, and 72°C for 90 seconds, terminating with 72°C for 10 minutes. Product samples were run either in a standard 1% agarose gel or in a 10% parallel DGGE gel at 300V and 60°C for 2 hours with a denaturing gradient of 10% to 60%. Both gels were visualized using ethidium bromide.
Determination of the Nucleotide Sequence
The portions of acrylamide gel corresponding to the bands of interest were cut from the gel using a razor blade and the DNA was recovered by dialysis against 100 μl of TE buffer for 5 hours at 42°C with vigorous shaking. Five μl of the elution solution was re-amplified by PCR in 50 μl volume using the same degenerated PTK primers and reaction conditions without the α[32P]dCTP, and using 55°C rather than 37°C for the annealing temperature. The re-amplified product was ethanol precipitated and resuspended in TE buffer before being digested in 1× EcoRI buffer with EcoRI and BamHI (Promega). The DNA was ligated into EcoRI and BamHI-cleaved pGEM vector (Promega). The nucleotide sequence of the cloned cDNA fragment was determined by using the ABI PRISM Ready Reaction Dye Deoxy Terminator Cycle Sequencing Kit (Perkin Elmer). Twenty μl of the reaction mixture contained 9.5 μl of terminator premix with AmpliTaq DNA Polymerase, 50 ηg of template DNA, and 3.2 ρmol of M13 forward primer. The reaction was carried out for 25 cycles: 10 minutes at 96°C, 5 minutes at 50°C, and 4 minutes at 60°C. Centri-Sep-column purified-amplified products were dried by vacuum centrifugation. The nucleotide sequence was determined on an automated ABI DNA sequencer (model 373A; Applied Biosystems, Foster City, CA). Identity of the obtained sequence was established by BLAST sequence similarity search 19 of the combined GenBank/EMBL/PDB depositories accessible through the National Center for Biotechnology Information (http://www.ncbi.nlm.nih.gov/BLAST/).
Northern Blot Hybridization
Twenty-five μg of total RNA was fractionated by electrophoresis in a 1% agarose-formaldehyde denaturing gel, and transferred to a nylon membrane. 13 After prehybridization, the membranes were hybridized overnight at 42°C with an α[32P]dCTP-labeled cloned IGF-IR, or a β-actin cDNA fragment in a fresh hybridization solution which contained 50% formamide and 5X SSPE, washed in 0.1X SSC/0.1% The filters were washed to a final stringency in 0.1X SSC/0.1% SDS at 62°C, and exposed to X-ray film with an intensifying screen for 7 days at −70°C.
Flow Cytometry Analysis of IGF-IR Expression
This analysis was performed as previously described. 20 Briefly, 1 × 10⁶ cells were suspended in PBS supplemented with 5% bovine calf serum (BCS) and labeled for 30 minutes at 4°C with mouse anti-IGF-IR monoclonal antibody directed to the extracellular parts of α and β subunits of IGF-IR (Oncogene Science, Cambridge, MA). Cells were washed three times in ice-cold PBS/5% BCS and then incubated with PE-conjugated, affinity-purified goat anti-mouse antibody (Sigma) for 30 minutes. After being washed three times the cells were subjected to analysis using a FACS Star Plus II (Becton-Dickinson, San Jose, CA). Cells labeled with the isotype-matched mouse and the secondary goat anti-mouse antibody served as a negative control.
Results
Inhibition of Malignant T Cell Proliferation by PTK Inhibitors
Because PTKs play a fundamental role in receptor signaling and cell cycle progression in normal T cells, 1, 2 we investigated the extent to which PTKs contribute to the growth of malignant T lymphocytes. To answer this question we cultured PB-1, 2A, and 2B cell lines derived from a progressive T-cell lymphoma involving skin 13, 17 and normal, PHA-stimulated PBMC in the presence of three different broad-spectrum PTK inhibitors. As shown in Figure 1 , all of the PTK inhibitors suppressed proliferation of both the normal PHA-stimulated PBMC and malignant T cells at similar doses. Fifty percent inhibition (IC50) was achieved with less than 80 ng/ml of Herbimycin A for the cell lines and PBMC (Figure 1A) . Whereas genistein affected all T-cell populations equally (IC50: 20–30 μmol), low concentrations of staurosporine (5–25 nmol) repeatedly had a stimulatory effect on the PB-1 and 2A lines (Figure 1C) . This effect disappeared when higher doses (IC50: 30 nmol) were used. This finding suggests a presence in the PB-1 and 2A cells of growth-inhibitory proteins which are highly sensitive to staurosporine which, in contrast to herbimycin A and genistein, inhibits not only PTKs but also other types of kinases. 21, 22 Regardless of this staurosporine-mediated enhancement, our data show that PTKs are as important in the growth of malignant T cells as they are for their normal, mature T-cell counterparts.
Figure 1.
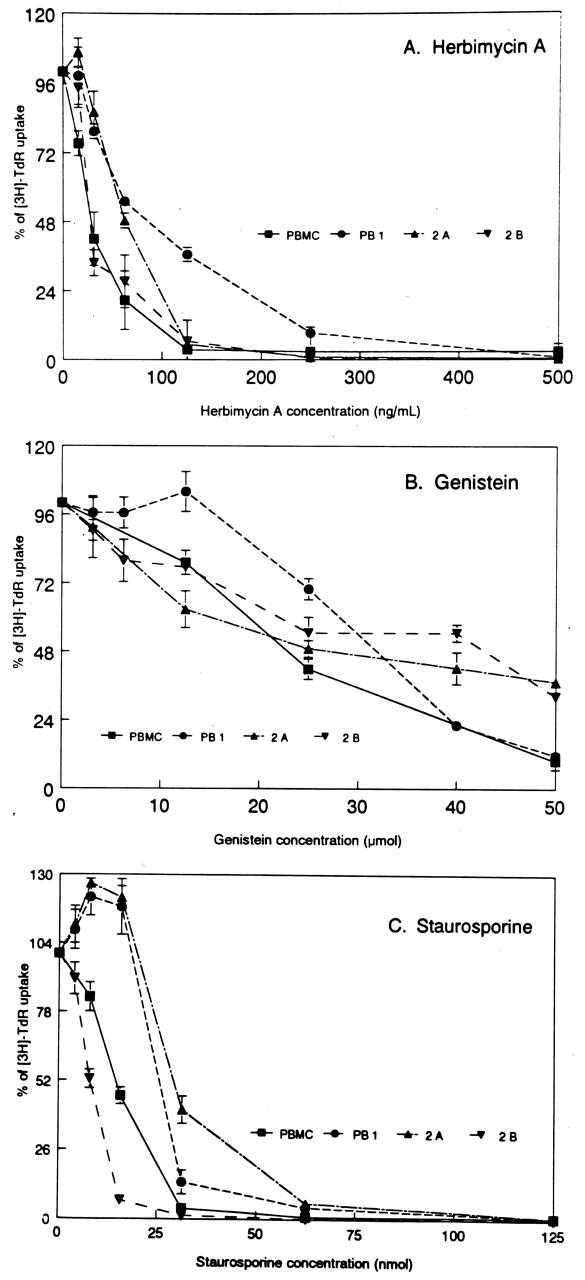
Suppression of proliferation of the malignant T-cell lymphoma lines (PB-1, 2A, and 2B) and control phytohemagglutinin (PHA)-stimulated peripheral-blood mononuclear cells (PBMC) by tyrosine kinase inhibitors: Herbamycin A (A), Genistein (B), and Staurosporine (C). The results are expressed as a percentage of the proliferative response in the presence of the drugs as compared to the medium containing no drugs. The proliferative response was calculated by measuring incorporation of tritiated thymidine [3H]TdR into cells with the incorporation of the untreated cells chosen as the reference, hundred percent uptake.
Detection of PTK Gene Expression by Various Types of Normal and Malignant Lymphocytes
To determine the expression pattern of PTK mRNA in malignant T cells, we amplified RT-generated cDNAs by PCR using degenerate primers which recognize two relatively invariable regions within the PTK catalytic domain. 8, 9, 10 This reaction yields multiple products which, however, display very similar molecular weight (app. 210 bp: Figure 2 ). This similar product size precludes identification of any of the individual PTKs by their electrophoretic migration pattern in the conventional agarose gels and prohibits any comparative studies between various cell populations unless a large-scale cDNA cloning is used, which is labor intensive and random in nature.
Figure 2.

Expression of mRNA coding for various PTKs in several cell populations: normal, T-cell rich cells, resting (PBMC) or mitogen-activated (PHA-bl), malignant mature T cells (2B, PB-1, Sez4), and control cells (YT, LCL, MOLT4). RT-generated cDNAs were amplified in PCR using degenerate PTK primers and visualized in agarose gel stained with ethidium bromide.
To overcome this limitation, we used DGGE, which separates DNA based on the nucleotide sequence rather than molecular weight. Although the PCR primer-binding sites are structurally conserved, the remainder of the primer-targeted sequence has been found to be quite diverse among various PTKs. 8, 9, 10 Therefore, we expected significant differences in their DGGE migration pattern. At first, in the “proof of principle” experiments, we analyzed the migration pattern of same-size PCR-amplified cDNA fragments from three different PTKs (lck, lyn, and fyn) known to be expressed by T cells. The aim of this experiment was to demonstrate that DGGE can effectively separate PCR-amplified cDNA fragments from various PTKs. These PTK cDNA fragments were generated by “nested” PCR in which “external” primer pairs specific for a particular PTK were used in the first amplification round, and “internal,” the above-described degenerate PTK primer pairs in the second round. In contrast to the conventional agarose gel (Figure 3A) which, as expected, failed to distinguish among these three PTKs, DGGE produced substantial separation of the PTKs (Figure 3B) . This result indicated that DGGE should also be suitable in detection of the previously undefined PTKs expressed by the particular cell population.
Figure 3.
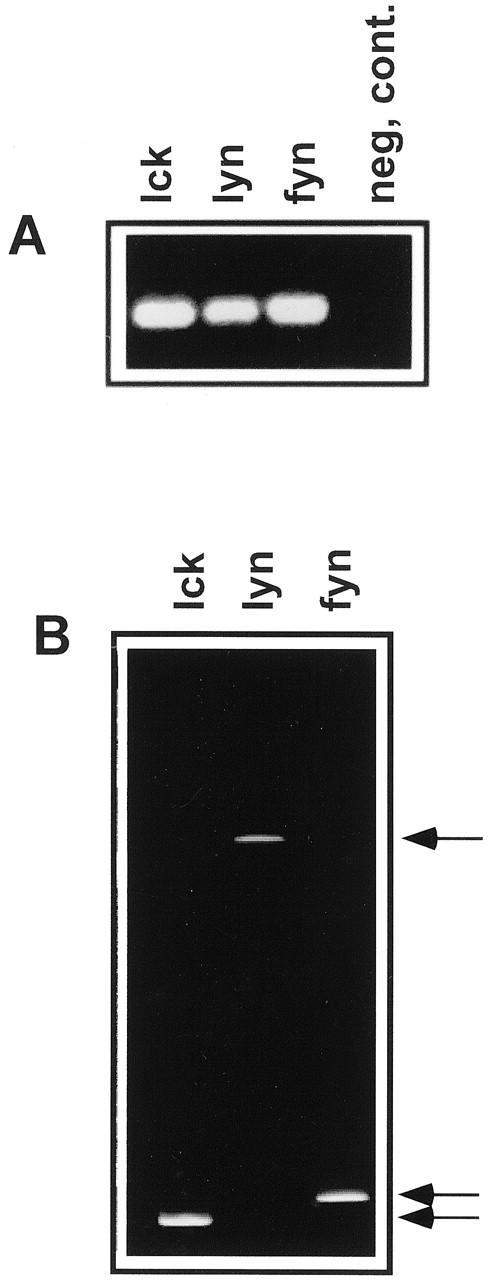
Electrophoretic separation of known PTKs. cDNA coding for lck, lyn, and fyn was amplified in “nested” PCR using primers specific for a particular kinase in the first round and degenerate primers recognizing the conserved PTK motifs in the second round. The amplified cDNA fragments were run in either standard agarose gel electrophoresis (A) or parallel denaturating gradient gel electrophoresis (DGGE; B). Both gels were visualized using ethidium bromide. Arrows point to the migration position of the analyzed PTKs.
To determine the PTK expression-pattern in normal and malignant T cells, we amplified PTK cDNA from several T-cell and control cell populations using only the degenerate PTK primers in one round of amplification and separated them by DGGE. To increase sensitivity of the PTK detection, we used radiolabeled nucleotides in the PCR reaction rather than relied on the cDNA staining with ethidium bromide. As shown in Figure 4 , DGGE separation revealed profound differences in the PTK gene expression among the T-cell and other lymphocyte populations tested. Although some of the bands were common for most cell populations, they usually differed markedly in their intensity (an example of such a band is indicated by the arrow). Other bands appeared fairly unique to the specific cell type (an example of which is indicated by the solid arrowhead).
Figure 4.
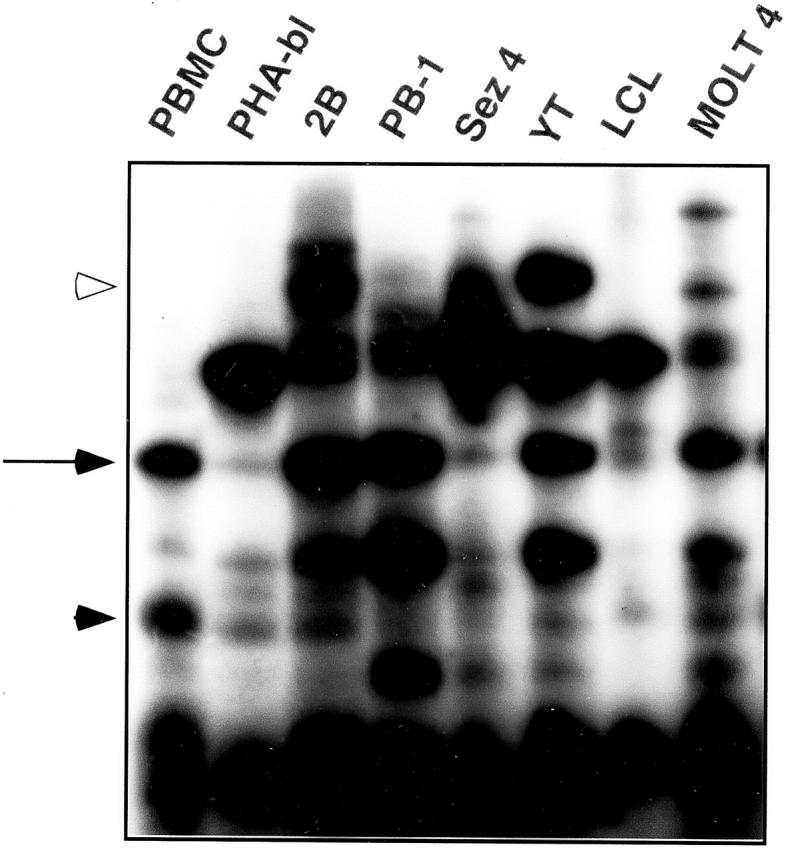
Expression of various PTKs in normal and malignant normal cells analyzed by parallel DGGE. The following cell populations were used: PBMC, PHA-activated T-cell blasts (PHA-bl), malignant mature T cells (2B, PB-1, Sez-4), NK cells (YT), lymphoblastoid B cells (LCL), and malignant immature T cells (MOLT4). RT-PCR-generated cDNAs were separated by DGGE and visualized by autoradiography of the α[32P]dCTP-labeled samples as many distinct bands. The arrow indicates a representative band present in all cell populations; the band intensity varies among the cell populations. The solid arrowhead indicates a representative band with restricted expression pattern. The open arrowhead indicates a band containing amplified fragment of the IGF-IR fragment.
IGF-IR Preferentially Expressed by Malignant T Cells Derived from Anaplastic Cutaneous T-Cell Lymphoma
To identify one of the differentially expressed PTKs, we recovered, cloned, and sequenced cDNA from a band preferentially expressed by the malignant T-cell lymphoma line 2B (Figure 4 , an open arrowhead). Comparative analysis of the obtained cDNA sequence using the NCBI data bank revealed a 100% identity of the sequence to a type I receptor for insulin-like growth factor (IGF-IR). Expression of IGF-IR has been shown to be important for survival and growth of several types of malignant cells. 11, 12 To confirm the preferential expression of IGF-IR by the malignant T-cell lymphoma cells, we performed a Northern blot hybridization using the isolated IGF-IR cDNA as a probe (Figure 5) . The two malignant T-cell lymphoma lines 2B and a closely related 2A highly expressed the IGF-IR mRNA. PB-1, which was derived from a less aggressive stage of the same lymphoma, 13 contained a relatively smaller amount of the IGF-IR mRNA. A very faint band was also seen in the PHA-activated T-cell blasts but not in the following cell populations tested: resting T-cell rich PBMC, EBV-transformed lymphoblastoid B-cell line (LCL) derived from the same patient as the PB-1, 2A, and 2B cell lines, and immature T-cell leukemic cells (MOLT4). To also confirm the expression of IGF-IR on the protein level we performed flow cytometry analysis for the surface expression of IGF-IR (Figure 6) . The results were very similar to the mRNA expression data: 2B cells expressed IGF-IR at the highest, PB-1 at the intermediate, and PHA-activated T-cell blasts at the lowest concentration. No receptor could be detected on the control LCL cells. These data support the notion that the combined PTK-specific PCR/parallel DGGE analysis can identify PTKs that are differentially expressed by various lymphoid cell populations.
Figure 5.
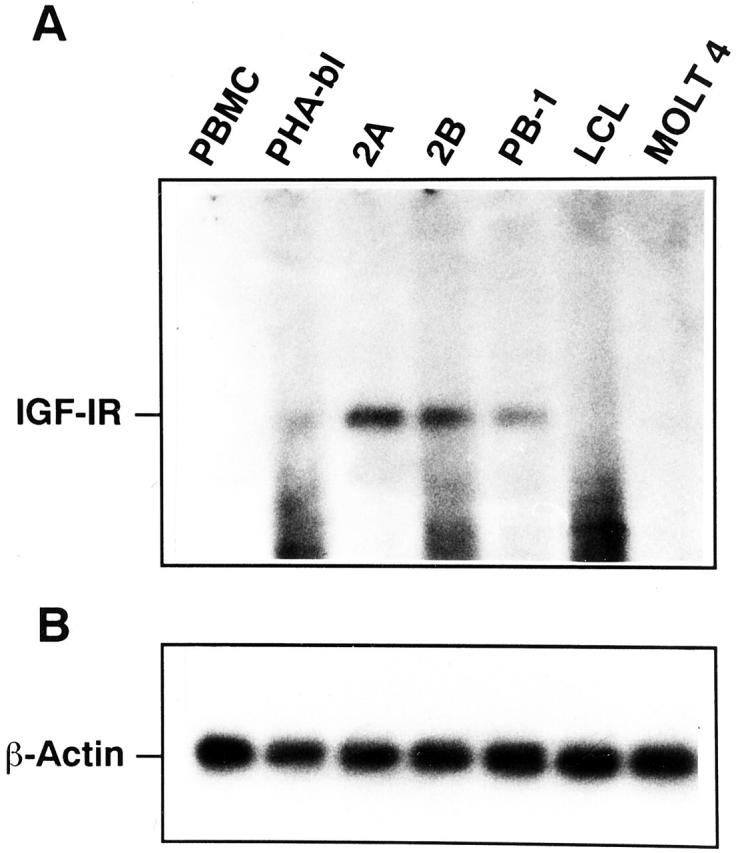
Northern blot analysis of IGF-IR (A) and control β-actin (B) mRNA expression in normal resting (PBMC), mitogen-activated (PHA-bl), and malignant (2A, 2B, and PB-1) mature T-cell populations; malignant immature T cells (MOLT4) and EBV-transformed lymphoblastoid B cells (LCL) served as controls. Total RNA was fractionated by electrophoresis, transferred to a nylon membrane, and probed with an α[32P]dCTP-labeled, cloned IGF-IR or β-actin cDNA fragment. The filters were exposed to X-ray film with an intensifying screen for 7 days at −70°C.
Figure 6.

FACS analysis of IGF-IR expression on the surface of malignant T-cell lymphoma cells (2B and PB-1); PHA-activated T-cell blasts (PHA-bl) and EBV-transformed lymphoblastoid B cells (LCL) served as controls. The cells were preincubated with a primary monoclonal anti-IGF-IR antibody (shaded area) or control isotype-matched antibody (open area), washed, and incubated with a secondary, PE-labeled antibody. M1 represents the region considered to encompass all cells considered to express the receptor.
Discussion
The importance of PTKs in cell growth regulation on multiple levels is evident by their functioning as growth factor receptors, signal transduction intermediates involved in cell proliferation, adhesion and motility, and regulators of the cell cycle. 1, 2, 3 Many of the PTKs represent proto-oncogenes and their mutations and/or abnormal expression result in the acquisition of malignant phenotype by the affected cells. 2, 3, 4 Expression of the genes coding for PTKs can be studied by sequence analysis of cDNA fragments amplified by PCR. This PCR amplification uses pairs of primers recognizing conserved domains within the PTK family. 8, 9, 10 This approach, however, has a major drawback in that the PCR products have the same or almost identical molecular weight (Figure 2 and 3A) . This precludes an efficient, direct comparison of PTK expression between various populations, such as normal and malignant T lymphocytes, for this frequently leads to the repetitious cloning of the same, most abundant PTKs, and may lead to omission of some of the expressed PTKs. To solve these problems, we developed a method for separating PTK products by parallel DGGE.
Our “proof of principle” experiments showed that the same-length cDNA fragments coding for three different PTKs (lck, lyn, and fyn) could be separated by DGGE. This successful separation confirmed the effectiveness of the method, and the only question remaining was whether PTKs could be directly amplified in sufficient amounts from cDNA using degenerate primers to produce detectable bands. This question was answered in the principal experiments; when we separated the radioactively labeled PCR products by parallel DGGE, a number of bands corresponding to various PTKs were identified. Some appeared relatively specific for malignant T cells, since their mRNA could not be detected in resting, T-cell rich PBMC, mitogen-activated T-cell blasts, and other control cell populations (Figure 4) . One such PTK was IGF-IR, which was preferentially expressed by the malignant T-cell lymphoma cells on both the mRNA and protein levels (Figure 4 and 5) and may play an important role in the survival and growth of these malignant cells. 11, 12
Regardless, these findings clearly indicate the usefulness of the combined PTK-specific PCR/parallel DGGE method in analysis of differential PTK expression by normal and malignant T-cell populations to determine the potential importance of PTKs in cell transformation, activation, and maturation. They also suggest that the method may also be used in various types of non-lymphoid cells, both normal and malignant.
DGGE depends on the different electrophoretic mobility of partially denatured molecules caused by differences in the rate of DNA melting. It is successfully used to detect small differences, even as small as 1 or 2 bp, as seen in gene polymorphism and mutations, including rearranged immunoglobulin and T-cell receptor genes. 22, 23, 24, 25 In addition to facilitating studies of PTK expression in various types of cells, the combination of degenerate-primer PCR and DGGE may also be adapted to study expression of other gene families which share highly conserved sequences. Accordingly, the method has been used successfully to analyze expression of major histocompatibility gene alleles 26 and members of a highly homologous α(2u)-globulin gene family. 27
There are several other techniques used to identify differentially expressed genes. These methods include various forms of subtractive hybridization and differential display. 28 Differential display is a powerful technique based on cDNA amplification by PCR and allows side-by-side comparison of RNA pools from several sources. Although differential display is especially useful for the isolation of cDNA fragments from abundant mRNA, this technique has a number of shortcomings which makes it less suitable for many research applications. Differential display does not detect transcripts of low abundance efficiently, it cannot identify different cDNAs with the same length, and, finally, it is rather labor intensive. The newer version of differential display is a solid-phase cDNA microarray hybridization which permits simultaneous analysis of hundreds of expressed genes. 29, 30, 31 This technology, however, requires complex equipment and is expensive and labor consuming. Furthermore, it seems to generate at the current stage rather diverse results even if the same type of malignancy is studied. 32, 33 The discrepancies may be due in part to methodological differences used. Most importantly, it permits detection of only the gene sequences deposited in the particular array and analyzes only 1 to 2 cell populations per experiment in contrast to our method, which permits detection of novel members of the particular gene family and can simultaneously analyze up to 16 cell populations. Therefore, PCR/DGGE may prove particularly useful when analysis of a large number of different samples is performed. Although the main strength of the method seems to be in the gene discovery and comparative determination of gene expression patterns, it may also have potential diagnostic applications. In all likelihood, specific types of lymphomas as well as other types of malignancies display distinct patterns of expression of tyrosine kinases and other gene families. Identification of such patterns may play an important role in diagnosis of malignant tumors, particularly if the conventional methods yield equivocal results. Furthermore, if at least some of the identified bands correspond to kinases representing suitable targets for specific, clinical-grade inhibitors, 5, 6, 7 the method may provide important therapeutic guidance. This may require, however, confirmation of the kinase identify by either sequence analysis of the selected bands or an independent method such as RT-PCR with highly specific primers.
In summary, combined application of PCR with primers that recognize conserved sequences within a particular gene family, such as PTKs combined with DGGE, is an efficient, reliable, and inexpensive method of analyzing gene expression in a large number of samples representing various normal and malignant cell populations. It may provide a viable technical alternative to other methods in studying the expression of PTKs and other gene families in cell activation, development, and malignant transformation.
Address reprint requests to Mariusz A. Wasik, M.D., Department of Pathology and Laboratory Medicine, Founders 7.106, University of Pennsylvania Medical Center, 3400 Spruce St., Philadelphia, PA 19104. E-mail: wasik@mail.med.upenn.edu.
Footnotes
Supported in part by NIH grants CA89194 and CA96856 to M.A.W. and HL61796 to M.Z.R.
References
- 1.Dong C, Davis RJ, Flavell RA: MAP kinases in the immune response. Annu Rev Immunol 2002, 20:55-72 [DOI] [PubMed] [Google Scholar]
- 2.Scheijen B, Griffin JD: Tyrosine kinase oncogenes in normal hematopoiesis and hematological disease. Oncogene 2002, 21:3314-3333 [DOI] [PubMed] [Google Scholar]
- 3.Frame MC, Fincham VJ, Carragher NO, Wyke JA: v-Src’s hold over actin and cell adhesions. Nat Rev Mol Cell Bio 2002, 3:233-245 [DOI] [PubMed] [Google Scholar]
- 4.Skorski T: Oncogenic tyrosine kinases and the DNA-damage response. Nat Rev Cancer 2002, 2:351-360 [DOI] [PubMed] [Google Scholar]
- 5.Bridges AJ: Chemical inhibitors of protein kinases. Chemical Rev 2001, 101:2541-2572 [DOI] [PubMed] [Google Scholar]
- 6.Hao D, Rowinsky EK: Inhibiting signal transduction: recent advances in the development of receptor tyrosine kinase and Ras inhibitors. Cancer Invest 2002, 20:387-404 [DOI] [PubMed] [Google Scholar]
- 7.Savage DG, Antman KH: Imatinib mesylate-a new oral targeted therapy. N Engl J Med 2002, 346:683-693 [DOI] [PubMed] [Google Scholar]
- 8.Wilks AF: Two putative protein-tyrosine kinases identified by application of the polymerase chain reaction. Proc Natl Acad Sci USA 1989, 86:1603-1607 [DOI] [PMC free article] [PubMed] [Google Scholar]
- 9.Matthews W, Jordan CT, Gavin M, Jenkins NA, Copeland NG, Lemischka IR: A receptor tyrosine kinase cDNA isolated from a population of enriched primitive hematopoietic cells and exhibiting close genetic linkage to c-kit. Proc Natl Acad Sci USA 1991, 88:9026-9030 [DOI] [PMC free article] [PubMed] [Google Scholar]
- 10.Biesecker LG, Gottschalk LR, Emerson SG: Identification of four murine cDNAs encoding putative protein kinases from primitive embryonic stem cells differentiated in vitro. Proc Natl Acad Sci USA 1993, 90:7044-7048 [DOI] [PMC free article] [PubMed] [Google Scholar]
- 11.Baserga R: The contradictions of the insulin-like growth factor 1 receptor. Oncogene 2000, 19:5574-5581 [DOI] [PubMed] [Google Scholar]
- 12.Valentinis B, Baserga R: IGF-I receptor signaling in transformation and differentiation. Mol Pathol 2001, 54:133-137 [DOI] [PMC free article] [PubMed] [Google Scholar]
- 13.Zhang Q, Raghunath PN, Vonderheid E, Ødum N, Wasik MA: Lack of phosphotyrosine phosphatase SHP-1 expression in malignant T-cell lymphoma cells results from methylation of the SHP-1 promoter. Am J Pathol 2000, 157:1137-1146 [DOI] [PMC free article] [PubMed] [Google Scholar]
- 14.Majewski M, Korecka M, Kossev P, Li S, Goldman J, Moore J, Silberstein L, Nowell PC, Schuler W, Shaw L, Wasik MA: Immunosuppressive macrolide SDZ RAD inhibits growth of human EBV-transformed B lymphocytes in vitro and in vivo; a potential approach to prevention and treatment of posttransplant lymphoproliferative disorders (PTLDs). Proc Natl Acad Sci USA 2000, 97:4285-4290 [DOI] [PMC free article] [PubMed] [Google Scholar]
- 15.Abrams JT, Lessin S, Ghosh SK, Ju W, Vonderheid EC, Nowell P, Murphy G, Elfenbein B, DeFreitas E: A clonal CD4-positive T-cell line established from the blood of a patient with Sezary syndrome. J Invest Dermatol 1991, 96:31-37 [DOI] [PubMed] [Google Scholar]
- 16.Yodoi J, Teshigawara K: TCGF (IL-2)-receptor inducing factor(s). I Regulation of IL-2 receptor on a natural killer-like cell line (YT cells) J Immunol 1985, 134:1623-1630 [PubMed] [Google Scholar]
- 17.Zhang Q, Raghunath PN, Xue L, Majewski M, Carpentieri DF, Odum N, Morris S, Skorski T, Wasik MA: Multilevel dysregulation of STAT3 activation in ALK+ T/null-cell lymphoma. J Immunol 2002, 168:466-474 [DOI] [PubMed] [Google Scholar]
- 18.Chomczynski P, Sacchi N: Single-step method of RNA isolation by acid guanidinium thiocyanate-phenol-chloroform extraction. Anal Biochem 1987, 162:156-159 [DOI] [PubMed] [Google Scholar]
- 19.Altschul SF, Gish W, Miller W, Myers EW, Lipman DJ: Basic local alignment search tool. J Mol Biol 1990, 215:403-410 [DOI] [PubMed] [Google Scholar]
- 20.Ratajczak J, Zhang Q, Pertusini E, Wojczyk B, Wasik MA, Ratajczak M: The role of insulin (INS) and insulin-like growth factor-I (IGF-I) in regulation of human erythropoiesis. Studies in vitro under serum-free conditions; comparison to other cytokines and growth factors. Leukemia 1998, 12:371-381 [DOI] [PubMed] [Google Scholar]
- 21.Gescher A: Staurosporine analogues - pharmacological toys or useful antitumour agents? Crit Rev Oncol Hematol 2000, 34:127-135 [DOI] [PubMed] [Google Scholar]
- 22.Chevillard S, Radicella JP, Levalois C, Lebeau J, Poupon MF, Oudard S, Dutrillaux B, Boiteux S: Mutations in OGG1, a gene involved in the repair of oxidative DNA damage, are found in human lung and kidney tumours. Oncogene 1998, 16:3083-3086 [DOI] [PubMed] [Google Scholar]
- 23.Antoniadi T, Gronskov K, Sand A, Pampanos A, Brondum-Nielsen K, Petersen MB: Mutation analysis of the GJB2 (connexin 26) gene by DGGE in Greek patients with sensorineural deafness. Human Mutation 2000, 16:7-12 [DOI] [PubMed] [Google Scholar]
- 24.Wood GS, Tung RM, Haeffner AC, Crooks CF, Liao S, Orozco R, Veelken H, Kadin ME, Koh H, Heald P: Detection of clonal T-cell receptor gamma gene rearrangements in early mycosis fungoides/Sezary syndrome by polymerase chain reaction and denaturing gradient gel electrophoresis (PCR/DGGE). J Invest Dermatol 1994, 103:34-44 [DOI] [PubMed] [Google Scholar]
- 25.Theodoro I, Delfau-Larue MH, Bigorgne C, Lahet C, Cochet G, Bagot M, Wechsler J, Farcet JP: Cutaneous T-cell infiltrates: analysis of T-cell receptor γ gene rearrangement by polymerase chain reaction and denaturating gradient gel electrophoresis. Blood 1995, 86:305-310 [PubMed] [Google Scholar]
- 26.Liu K, Kao KJ: Measurement of relative quantities of different HLA-A and -B mRNAs in cells by reverse transcription-polymerase chain reaction and denaturing gradient gel electrophoresis. J Immunol Methods 1997, 203:67-75 [DOI] [PubMed] [Google Scholar]
- 27.Saito K, Nishikawa J, Imagawa M, Nishihara T, Matsuo M: Molecular evidence of complex tissue- and sex-specific mRNA expression of the rat α(2u)-globulin multigene family. Biochem Biophys Res Commun 2000, 272:337-344 [DOI] [PubMed] [Google Scholar]
- 28.Lisitsyn N, Wigler M: Representational difference analysis in detection of genetic lesions in cancer. Methods Enzymol 1995, 254:291-304 [DOI] [PubMed] [Google Scholar]
- 29.Staudt LM: Gene expression profiling of lymphoid malignancies. Annu Rev Med 2002, 53:303-318 [DOI] [PubMed] [Google Scholar]
- 30.Ramaswamy S, Golub TR: DNA microarrays in clinical oncology. J Clin Oncol 2002, 20:1932-1941 [DOI] [PubMed] [Google Scholar]
- 31.Pollack JR, Van de Rijn M, Botstein D: Challenges in developing a molecular characterization of cancer. Semin Oncol 2002, 29:280-285 [DOI] [PubMed] [Google Scholar]
- 32.Shipp MA, Ross KN, Tamayo P, Weng AP, Kutok JL, Aguiar RC, Gaasenbeek M, Angelo M, Reich M, Pinkus GS, Ray TS, Koval MA, Last KW, Norton A, Lister TA, Mesirov J, Neuberg DS, Lander ES, Aster JC, Golub TR: Diffuse large B-cell lymphoma outcome prediction by gene-expression profiling and supervised machine learning. Nat Med 2002, 8:68-74 [DOI] [PubMed] [Google Scholar]
- 33.Rosenwald A, Wright G, Chan WC, Connors JM, Campo E, Fisher RI, Gascoyne RD, Muller-Hermelink HK, Smeland EB, Giltnane JM, Hurt EM, Zhao H, Averett L, Yang L, Wilson WH, Jaffe ES, Simon R, Klausner RD, Powell J, Duffey PL, Longo DL, Greiner TC, Weisenburger DD, Sanger WG, Dave BJ, Lynch JC, Vose J, Armitage JO, Montserrat E, Lopez-Guillermo A, Grogan TM, Miller TP, LeBlanc M, Ott G, Kvaloy S, Delabie J, Holte H, Krajci P, Stokke T, Staudt LM: Lymphoma/Leukemia Molecular Profiling Project. The use of molecular profiling to predict survival after chemotherapy for diffuse large-B-cell lymphoma. N Engl J Med 2002, 346:1937-1947 [DOI] [PubMed] [Google Scholar]