

Abstract
Cyclin D1 overexpression is a valuable marker for the diagnosis of mantle cell lymphoma (MCL). We used a real-time quantitative reverse transcription-polymerase chain reaction (qRT-PCR) method to quantify levels of cyclin D1, CD20, and cyclophilin A mRNA in manually microdissected, paraffin-embedded tissue sections using an ABI 7700 qRT-PCR system. The study group included 21 cases of MCL and 37 cases of other types of B-cell non-Hodgkin’s lymphoma. Cyclin D1 mRNA copy number was normalized to CD20 and cyclophilin A mRNA and evaluated statistically by analysis of variance. The relative cyclin D1 levels were similar whether normalized to CD20 or cyclophilin A, indicating that CD20 levels are stable and can be used as a B-cell-specific normalizer. Statistically significant differences were found in the median levels of cyclin D1 mRNA (expressed as % CD20 mRNA) among cases of MCL (87.6), small lymphocytic lymphoma (9.9), follicular lymphoma (2.4), diffuse large B-cell lymphoma (5.9), marginal zone B-cell lymphoma (39.8), and Burkitt lymphoma (7.1) (P < 0.05). We conclude that qRT-PCR can be used to quantify cyclin D1 mRNA levels in archival tissue sections. Normalization of cyclin D1 to a B-cell-specific marker more accurately reflects overexpression by MCL than other methods that normalize using constitutively expressed mRNA species.
Mantle cell lymphoma (MCL) is a clinically and morphologically distinct type of non-Hodgkin’s lymphoma (NHL) characterized by the t(11;14)(q13;q32). 1, 2 This translocation juxtaposes the CCND1 gene (cyclin D1) at 11q13 with the immunoglobulin heavy chain gene, resulting in overexpression of cyclin D1. 3, 4 Mantle cell lymphoma has an aggressive clinical course and is resistant to conventional therapies that have been used to treat other types of B-cell NHL. 1, 2 Consequently, the diagnosis of MCL has important prognostic implications.
Establishing the diagnosis of MCL is complicated by several factors. MCL exhibits a spectrum of morphological findings and distinguishing MCL from other types of NHL relies on the appreciation of subtle histological differences. 1, 2 The diagnosis of high-grade variants of MCL can be especially difficult. Immunophenotypic findings in MCL share many features with other low-grade B-cell NHLs, except for cyclin D1 overexpression, which is a characteristic feature of MCL. However, some cases of MCL have low level cyclin D1 overexpression that is difficult to detect by using immunohistochemical methods. 5, 6 Molecular methods to detect the t(11;14), thereby supporting the diagnosis of MCL, also have drawbacks. Polymerase chain reaction (PCR) methods, which target the major translocation cluster region, detect the t(11;14) in 40 to 50% of MCL. 7 However, other chromosome 11 breakpoints are widely scattered over 120 kb and are not detected by PCR. 8, 9 Southern blot analysis using multiple probes can detect the t(11;14) in 70 to 80% of cases, but this method is time-consuming and requires high-quality DNA. 8, 9, 10 Conventional cytogenetic analysis of MCL theoretically has the potential to identify the t(11;14) in all cases. However, for technical reasons, such as poor cell growth, the reported sensitivity using this method is approximately 60 to 80%. 11, 12 Fluorescence in situ hybridization (FISH) analysis of nuclei isolated from either fresh cells or paraffin-embedded tissue has been found to be highly sensitive for detecting the t(11;14), 13, 14, 15 but this assay is not routinely performed in many laboratories.
An alternative approach to obtain support for the diagnosis of MCL is to determine expression levels of the CCND1 gene, as all t(11;14) translocations result in overexpression. As lymphoid cells express very low levels of cyclin D1, not detectable by immunohistochemical methods, 16 these methods are convenient and specific for distinguishing MCL from other NHL. However, a negative immunoreaction does not exclude the diagnosis of MCL, as some cases have relatively low levels of cyclin D1. Detection of cyclin D1 mRNA by RT-PCR, in contrast, is very sensitive. Unfortunately, this approach cannot distinguish signal contributed by stromal, epithelial, or lymphoid cells. 6, 16, 17 Furthermore, conventional RT-PCR methods allow only semi-quantitative analysis of mRNA levels. Quantification of cyclin D1 mRNA from microdissected tissue sections would be an ideal solution coupling the requirements of high sensitivity and specificity. Numerical data, in addition, may permit more specific stratification of MCL cases for the purposes of classification and analysis of outcome.
In this study, we used qRT-PCR to quantify cyclin D1 mRNA levels in 21 MCL and 37 other B-cell NHLs to determine the value of this approach as an ancillary tool for the diagnosis of MCL. We extracted RNA from microdissected paraffin-embedded tissue sections as we have previously reported, 18 and normalized cyclin D1 mRNA levels to two reference mRNA species, CD20 and cyclophilin A.
Materials and Methods
Tissue Samples
Paraffin blocks of 58 NHL (57 patients) and three reactive lymph nodes were retrieved from the files of the University of Texas M.D. Anderson Cancer Center and University of Texas-Houston/Memorial-Hermann Hospital. The diagnosis of MCL in 20 patients (21 specimens) was based on compatible morphological and immunophenotypic findings. Cyclin D1 overexpression was shown by immunohistochemical methods in all cases of MCL. The t(11;14) was proved to be present in nine of these neoplasms using various molecular methods. Four-μm histological sections of a representative tissue block were placed on charged slides for immunohistochemical studies or uncharged slides for microdissection.
Cyclin D1 Immunohistochemical Methods
Deparaffinized tissue sections were subjected to microwave-enhanced antigen retrieval using 0.01 mol/L citrate buffer, pH 6.0, for 15 minutes. 19 Sections were immunostained using a three-step avidin-biotin complex-peroxidase system. We used the DCS-6 monoclonal antibody (dilution 1:350, Dako, Carpinteria, CA) to assess for cyclin D1, followed by a biotinylated anti-mouse Ig, and avidin-biotin-peroxidase complex (LSAB2, Dako). Immunocomplexes were visualized by using 3,3′-diaminobenzidine tetrahydrochloride as the chromogen.
Microdissection and RNA Extraction
Formalin-fixed, paraffin-embedded tissue sections were dewaxed and rehydrated through two rinses each of xylene and absolute ethanol and stained with 0.08% methylene blue. Non-Hodgkin’s lymphoma tissue was separated from stroma and epithelial tissue using one to three tissue sections by manual microdissection under a dissecting microscope. The microdissected tissue was pooled and stored in absolute ethanol at room temperature until used. Microdissected tissue fragments were sedimented from ethanol by centrifugation at 10,000 × g for 1 minute.
Total RNA was extracted from the tissue pellet using the Masterpure kit (Epicenter Technologies, Madison, WI) according to the manufacturer’s instructions, with overnight proteinase K digestion. The extracted RNA was dissolved in 20 μl of 1X PCR buffer supplemented with 5 mmol/L MgCl2, 10 mmol/L dithiothreitol (DTT), 4 units of RNasin (Promega, Madison, WI), 3 units DNase I (Life Technologies, Gaithersburg, MD) and incubated for 30 minutes at 37°C to digest contaminating DNA. An additional 20 μl of distilled water was added and the DNase I was inactivated at 75°C for 10 minutes. The RNA sample was stored at − 70°C until analyzed.
Standards
To enable us to determine the number of molecules in the starting material, synthetic RNA (sRNA) (for cyclophilin A) or double-stranded DNA (for cyclin D1 and CD20) was used to construct standard curves. sRNA was transcribed from cyclophilin A cDNA that was tailed via PCR to introduce the promoter of the T7 RNA polymerase using the MEGAshortscript kit (Ambion, Austin, TX) as previously described. 20 Tenfold serial dilutions of the sRNA were used to generate the cyclophilin A standard curve.
CD20 and cyclin D1 were amplified from a fresh human tonsillectomy specimen by RT-PCR. The amplified material was purified by chromatography through a G50 spin column (Boehringer Mannheim, Indianapolis, IN). The DNA concentration was determined by optical density measurement and 10-fold serial dilutions were used as standards.
Quantitative RT-PCR
The TaqMan PCR technology 21, 22 makes use of an internally quenched, fluorescently labeled oligonucleotide (probe) that anneals to the denatured target sequence in the segment defined by the PCR primers. On primer extension, the probe is hydrolyzed by virtue of the 5′->3′ exonuclease activity of TaqI polymerase, resulting in liberation and dequenching of a fluorescent nucleotide. The ABI Prism 7700 Sequence Detector (Applied Biosystems, Foster City, CA) detects in real-time the fluorescent signal of the hydrolyzed probe and determines the threshold cycle (CT), the cycle number at which the signal exceeds background by > = 10 SD. The CT value is a precise measure of the number of generated amplicons which, in turn, is a measure on a logarithmic scale of the amount of starting DNA target. This technique is sensitive, precise, and has a very wide dynamic range. 22 The requirement of probe hybridization makes this technique more specific than traditional PCR methods.
The RT and PCR reactions were run in 96-well plates. Each run consisted of a sRNA or DNA standard (typically 200 fg to 20 attog) in triplicate, 20 unknown samples in duplicate, 1 “no-RT” well for each duplicate unknown to control for tissue-derived DNA contamination, and a “no template” control well consisting of all of the components of the RT and PCR reaction mixtures except RNA to control for extraneous DNA contamination.
Reverse Transcription
The reaction mixture contained 2 μl of extracted cellular RNA, 500 μmol/L of each dNTP, 200 to 300 nmol/L of reverse primer, 1X first-strand buffer (Life Technologies), 10 mmol/L DTT (Boehringer Mannheim) and 10 units of Superscript II reverse transcriptase (Life Technologies) in a volume of 10 μl. The reaction mixture was incubated at 50°C for 30 minutes followed by heat inactivation at 72°C for 10 minutes. RT reactions were run in triplicate for the standards and in duplicate for unknown samples. For each duplicate reaction, a “no-RT” control was run which included all components of the RT mixture except reverse transcriptase.
PCR
Following first-strand synthesis, all of the 10 μl RT reaction mixture was used for subsequent PCR amplification by adding 40 μl of PCR master mix to the same wells. The PCR reaction mixture included 1X PCR buffer, 200 μmol/L of each dNTP, and 1.25 U Taq polymerase (Roche Molecular Biochemicals, Indianapolis, IN) in a final volume of 50 μl. Depending on the target transcript, the optimal concentration of MgCl2, primers, and the fluorogenic Taqman probe varied as tabulated in Table 1 .
Table 1.
Oligonucleotide Sequences and RT-PCR Reaction Conditions
| Assay (amplicon length) | Oligonucleotide | 5′ nt position (orientation) | Conc (nM) | Mg2+ (mM) | Sequence | Accession no. | Reference |
|---|---|---|---|---|---|---|---|
| Cyclophilin A (66 bp) | Probe | 69 (+) | 100 | 4 | CGCGTCTCCTTTGAGCTGTTTGCA | Y00052 | 24 |
| 5′ primer | 52 (+) | 300 | ACGGCGAGCCCTTGG | ||||
| 3′ primer | 117 (−) | 300 | TTTCTGCTGTCTTTGGGACCT | ||||
| Cyclin D1 (75 bp) | Probe | 358 (−) | 100 | 3 | TCTGTTCCTCGCAGACCTCCAGCA | M64349 | 25 |
| 5′ primer | 304 (+) | 200 | CCGTCCATGCGGAAGATC | ||||
| 3′ primer | 378 (−) | 200 | GAAGACCTCCTCCTCGCACT | ||||
| CD20 (73 bp) | Probe | 253 (+) | 100 | 3 | CACGCAAAGCTTCTTCATGAGGGAATCT | M27394 | 23 |
| 5′ primer | 233 (+) | 300 | ATGTCTTCACTGGTGGGCC | ||||
| 3′ primer | 305 (−) | 300 | TAATCTGGACAGCCCCCAA |
Amplification and real-time data acquisition were performed in an ABI Prism 7700 Sequence Detector using the following cycle conditions: initial denaturation at 95°C for 1 minute, followed by 40 cycles of denaturation at 95°C for 12 seconds, and annealing at 60°C for 1 minute.
Data Analysis and Statistical Evaluation
The ABI Prism 7700 instrument determines the CT values of each well and the Sequence Detection Application converts these values to copy number if a calibrated series of standards is included in the run. Only samples with CT values at least two units less than that of the “no-RT” control were included in data analysis. To correct for variations of total RNA concentration, the copy number of cyclin D1 mRNA was expressed as a percentage of CD20 or cyclophilin A mRNA molecules. Cyclophilin A is a ubiquitous, constitutively expressed mRNA species. 26 These normalized cyclin D1 mRNA levels were used in data analysis.
We used Jandel’s Sigmastat software (SPSS Inc., Chicago, IL) for statistical analysis. To establish whether cyclin D1 mRNA level differences were statistically significant for any NHL group, one-way analysis of variance (ANOVA) was used. We used parametric analysis of variance for normally distributed values and the Kruskall-Wallis analysis of variance on ranks for values exhibiting asymmetrical distribution. If analysis of variance indicated a significant difference, we identified the specific diagnostic category that was significantly different from MCL by pair-wise comparison using either Dunn’s test (for asymmetrical data) or Tukey’s test (for normally distributed data). All procedures were performed at a significance level of p = <0.05. For correlation analysis, Pearson’s correlation coefficient was calculated.
Results
The patients’ age, biopsy sites, pathological diagnoses, and the relative cyclin D1 levels as determined by qRT-PCR are shown in Table 2 . The MCL group included 14 men and 6 women. From one of the MCL patients, two lymph node biopsy specimens from different anatomical sites were analyzed (specimens 46 and 49).
Table 2.
Patient Clinical Data, Biopsy Site, and Relative Cyclin D1 mRNA Levels Expressed as Percent of Either Cyclophilin A or CD20
| Diagnosis | Tissue, site | Sex | Age | Cyclin D1 mRNA (% CD20) | Cyclin D1 mRNA (% CyPA) | |
|---|---|---|---|---|---|---|
| 1 | Reactive | LN, inguinal | M | 55 | 7.0 | 3.2 |
| 2 | Reactive | LN, inguinal | F | 62 | 23.7 | 5.0 |
| 3 | Reactive | LN, inguinal | F | 39 | 53.1 | 10.3 |
| 4 | BL | mass, nasal | M | 17 | 17.8 | 1.6 |
| 5 | BL | small intestine | F | 13 | 1.6 | 0.4 |
| 6 | BL | ileum | M | 17 | 7.1 | 0.4 |
| 7 | CLL/SLL | spleen | F | 55 | 54.4 | 5.2 |
| 8 | CLL/SLL | LN, inguinal | F | 66 | 8.6 | 25.1 |
| 9 | CLL/SLL | LN, axillary | F | 62 | 12.9 | 3.7 |
| 10 | CLL/SLL | LN, submandibular | M | 58 | 10.4 | 0.6 |
| 11 | CLL/SLL | LN, auricular | M | 50 | 7.2 | 3.4 |
| 12 | CLL/SLL | LN, inguinal | M | 60 | 3.5 | 0.5 |
| 13 | CLL/SLL | LN | M | 67 | 17.4 | 7.2 |
| 14 | CLL/SLL | LN, cervical | M | 70 | 11.3 | 3.1 |
| 15 | CLL/SLL | LN, supraclavicular | F | 57 | 9.3 | 4.2 |
| 16 | CLL/SLL | LN, axillary | F | 79 | 1.3 | 0.8 |
| 17 | FL, Gr1 | LN, inguinal | F | 46 | 4.4 | 1.9 |
| 18 | FL, Gr1 | LN, inguinal | M | 48 | 1.3 | 1.8 |
| 19 | FL, Gr1 | LN, inguinal | M | 83 | 2.0 | 0.9 |
| 20 | FL, Gr1 | LN, inguinal | M | 68 | 3.1 | 1.2 |
| 21 | FL, Gr1 | LN, inguinal | F | 46 | 4.9 | 2.5 |
| 22 | FL, Gr2 | LN, cervical | F | 48 | 1.6 | 2.6 |
| 23 | FL, Gr2 | LN, inguinal | F | 76 | 8.8 | 4.1 |
| 24 | FL, Gr2 | LN, inguinal | F | 58 | 2.8 | 1.7 |
| 25 | FL, Gr2 | LN, axillary | M | 52 | 2.0 | 1.8 |
| 26 | FL, Gr3 | LN, axillary | M | 49 | 1.8 | 1.6 |
| 27 | MZL | LN, cervical | F | 67 | 18.7 | 8.5 |
| 28 | MZL | parotid | F | 56 | 3.6 | 1.1 |
| 29 | MZL | skin | M | 76 | 16.4 | 7.5 |
| 30 | MZL | parotid | F | 71 | 5.7 | 6.8 |
| 31 | MZL | tongue | F | 68 | 11.5 | 4.3 |
| 32 | MZL | skin | F | 75 | 5.4 | 7.8 |
| 33 | MZL | LN, splenic | F | 57 | 6.2 | 2.6 |
| 34 | MZL | LN, paraaortic | F | 65 | 3.4 | 7.5 |
| 35 | MZL | spleen | F | 79 | 14.5 | 8.6 |
| 36 | DLBCL | mass, mediastinal | F | 34 | 6.2 | 8.4 |
| 37 | DLBCL | skin, breast | F | 75 | 3.8 | 1.1 |
| 38 | DLBCL | mass, mediastinal | F | 49 | 11.7 | 3.3 |
| 39 | DLBCL | mass, abdominal | M | 58 | 5.9 | 1.8 |
| 40 | DLBCL | nodule, chest | M | 61 | 4.5 | 8.0 |
| 41 | MCL | ileum | M | 42 | 68.9 | 31.1 |
| 42 | MCL | rectum | M | 63 | 255.2 | 229.3 |
| 43 | MCL | LN, cervical | F | 78 | 106.5 | 52.4 |
| 44 | MCL | LN, inguinal | M | 62 | 90.4 | 27.1 |
| 45 | MCL | colon | M | 82 | 115.7 | 33.1 |
| 46 | MCL | LN, hepatic | M | 69 | 80.7 | 30.8 |
| 47 | MCL | LN, axillary | M | 56 | 131.2 | 181.6 |
| 48 | MCL | LN, cervical | M | 74 | 87.6 | 469.1 |
| 49 | MCL | LN, omentum | M | 69 | 192.9 | 101.8 |
| 50 | MCL | LN, cervical | F | 61 | 31.2 | 29.7 |
| 51 | MCL | spleen | M | 56 | 26.1 | 22.0 |
| 52 | MCL | tonsil | F | 68 | 36.1 | 26.4 |
| 53 | MCL | LN, cervical | M | 56 | 76.2 | 44.8 |
| 54 | MCL | LN, inguinal | M | 63 | 114.6 | 307.6 |
| 55 | MCL | LN, inguinal | F | 69 | 11.9 | 8.8 |
| 56 | MCL | LN, splenic | M | 69 | 31.6 | 25.2 |
| 57 | MCL | LN | F | 54 | 28.0 | 33.3 |
| 58 | MCL | LN, axillary | M | 59 | 88.8 | 30.2 |
| 59 | MCL | LN, axillary | M | 79 | 87.6 | 52.7 |
| 60 | MCL | spleen | F | 67 | 139.5 | 55.0 |
| 61 | MCL | spleen | M | 66 | 381.1 | 107.7 |
LN, lymph node, site not specified.
Cases 46, 49 represent different lymph nodes from same patient; #46 with blastic morphology.
Abbreviations: BL, Burkitt lymphoma; CLL/SLL, chronic lymphocytic leukemia/small lymphocytic lymphoma; DLBCL, diffuse large B-cell lymphoma; FL, follicular lymphoma; MCL, mantle cell lymphoma; MZL, marginal zone lymphoma.
The cyclin D1 mRNA level in any sample is a function of the abundance of message in individual cells and the concentration of total RNA in the sample. To correct for differences in RNA concentration and for uncontrolled variables during tissue processing, we expressed cyclin D1 levels as a percentage of reference message. One of the normalizers we selected was CD20 mRNA, a B cell-specific message. We also normalized to cyclophilin A mRNA. To determine whether normalizing to CD20 mRNA was valid, we plotted the CD20 mRNA copy number against that of cyclophilin A mRNA (Figure 1) . This plot revealed a strong linear correlation of high statistical significance (r = 0.85, P = 7.0 × 10⁻¹⁸) between the two sets of logarithmic values, indicating that the level of one normalizer was highly predictive of the other, ie, both were reliable measures of total cellular RNA.
Figure 1.

Scatter plot showing CD20 mRNA copy number as a function of cyclophilin A copy number (log-scale). The correlation coefficient (R) and P value were calculated using the logarithms of the absolute copy numbers.
The individual relative cyclin D1 mRNA values were very low and tightly clustered in each non-MCL group using CyPA as normalizer. In MCL, the CyPA-normalized values were much higher and showed a significant spread with extremes of several hundred percent of cyclophilin A. The CD20-normalized levels showed a similar distribution, but there were occasional outliers in the reactive and chronic lymphocytic leukemia/small lymphocytic lymphoma (CLL/SLL) groups.
Since the data points were not normally distributed, the medians were used to characterize the diagnostic groups. The median cyclin D1 mRNA levels expressed as a percentage of CyPA or CD20 for each diagnostic category are shown in Figure 2 . As displayed, the CyPA-normalized cyclin D1 levels in all non-MCL cases were comparable, with a median value 4- to 70-fold lower than the MCL group. Statistical analysis by Dunn’s pair-wise comparison for non-normally distributed data showed that these differences were significant between MCL versus all other groups (P < 0.05) except the reactive lymph node group (Table 3) . When the distribution was normalized by logarithmic transformation and Tukey’s test was used for pair-wise comparison, the difference in mean cyclin D1 mRNA levels between MCL and reactive lymphoid tissues also reached statistical significance (P < 0.05).
Figure 2.
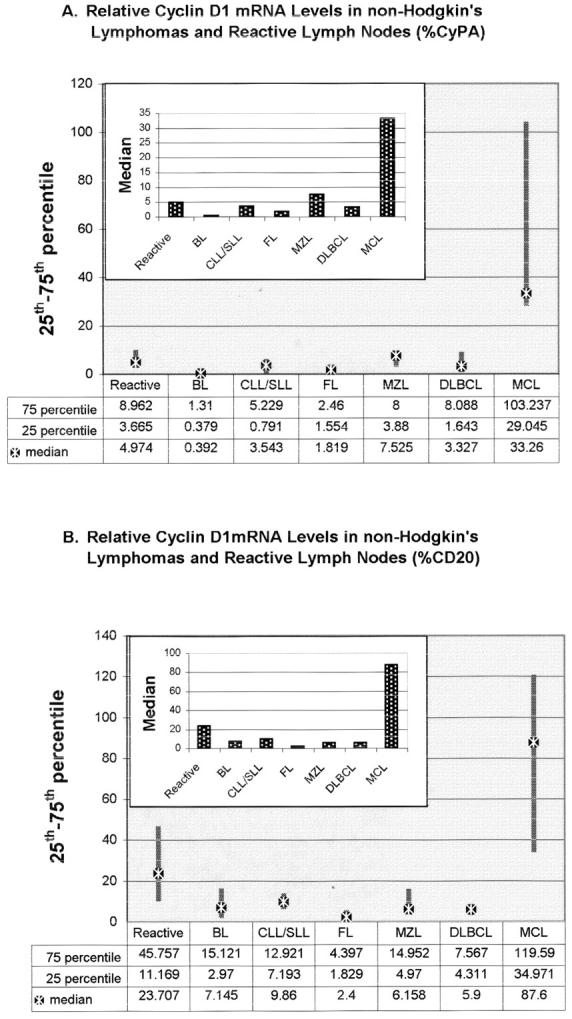
Relative cyclin D1 mRNA levels expressed as percentage of CyPA (A) or CD20 (B) mRNA copy number. The end points of the solid bars represent 25th and 75th percentile. Median is indicated by the star symbol. The inserted bar graphs show the median relative cyclin D1 mRNA levels for each normalizer (stippled bars).
Table 3.
Comparison of Relative Cyclin D1 mRNA Levels by Analysis of Variance
| Dunn’s (medians) | Tukey’s (means) | |||
|---|---|---|---|---|
| % CD20 | % CyPA | log (% CD20) | log (% CyPA) | |
| Reactive (n = 3) | NS | NS | NS | P < 0.05 |
| BL (n = 3) | NS | P < 0.05 | P < 0.05 | P < 0.05 |
| SLL (n = 10) | NS | P < 0.05 | P < 0.05 | P < 0.05 |
| FL (n = 10) | P < 0.05 | P < 0.05 | P < 0.05 | P < 0.05 |
| MZL (n = 9) | NS | P < 0.05 | P < 0.05 | P < 0.05 |
| DLBCL (n = 5) | P < 0.05 | P < 0.05 | P < 0.05 | P < 0.05 |
Each diagnostic category was compared to MCL. To establish the existence of a statistically significant difference for any NHL category, one way ANOVA was used. To identify the specific group that is significantly different from MCL, pair-wise comparison was performed using Dunn’s test for asymmetrical data (characterized by medians) or Tukey’s test for normally distributed values (characterized by means).
The results obtained by normalizing to CD20 mRNA were very similar, but not identical (Figure 2 and Table 3 ). Cyclin D1 levels in only follicular lymphoma (FL) and diffuse large B-cell lymphoma (DLBCL) were significantly different from MCL (P < 0.05) when we analyzed by a non-parametric statistical test. Cyclin D1 levels in marginal zone lymphoma (MZL), CLL/SLL, Burkitt lymphoma (BL), and reactive lymphoid tissues did not significantly differ from MCL due to the high variance of their expression levels. In a parametric test, however, cyclin D1 levels in all groups except the reactive lymph node group were found to be significantly different from MCL (P < 0.05).
To determine the possible cause of the higher variance of the CD20-normalized values, we calculated the levels of CD20 expression relative to cyclophilin A. As shown in Figure 3 , the CD20 mRNA levels, when normalized to CyPA, were variable. They were very low in BL and reactive lymph nodes. The other non-MCL NHLs expressed comparable levels of CD20. MCL, as a group, expressed CD20 levels almost twice as high as CLL/SLL. Statistical analysis of log-transformed data showed that BL expressed significantly less CD20 mRNA than MCL, MZL, or FL (P < 0.05); all other groups were not significantly different from each other.
Figure 3.

CD20 mRNA expression levels in various NHL (median of CD20/CyPA mRNA copy numbers).
The mean relative cyclin D1 levels for male and female patients were 121.9% and 58.9% of CD20 and 112.9% and 32.3% of cyclophilin A, respectively. These differences reached only marginal statistical significance for the CD20-normalized values when the distribution was normalized by logarithmic transformation (P <0.05). Similarly, the expression levels were not statistically different when we compared MCL cases with different architectural patterns (nodular or diffuse) or cytological features (classical or blastic). All patients were high clinical stage and thus stage could not be correlated with expression levels of cyclin D1. Our series included four blastoid MCL cases. In one patient, lymph nodes from two different anatomical sites harbored MCL with classical small cell and blastoid morphological features, respectively. In the classical small cell MCL sample (49) cyclin D1 was overexpressed at a higher level than in the sample of blastoid MCL (46). Anatomical site also did not influence the level of cyclin D1 overexpression (extranodal versus nodal, P = 0.12 normalized to CD20, P = 0.62 normalized to CyPA).
We also considered the possibilty that a diagnostically useful cutoff level for cyclin D1 expression could be established. After examining the distribution of the data, we chose a cutoff value at 10 to 20% of CyPA or 20 to 25% of CD20, and obtained a sensitivity of 95.2% and specificity of 97.3% for both normalizers. (In these calculations samples 46 and 49 were included as independent data points).
Discussion
Our primary aim in this study was to develop a method for quantifying cyclin D1 mRNA levels that was applicable to routine archival material. We reasoned that this method may aid in the differential diagnosis of MCL with other types of NHL. Although immunohistochemical detection of cyclin D1 is commonly and successfully used in the diagnosis of MCL, this technique can be technically challenging and, due to occasional low level overexpression in MCL, requires subjective interpretation. More importantly, immunohistochemical detection relies on absolute quantity and preserved antigenicity of the target antigen and thus is sensitive to suboptimal tissue processing, an important consideration if the material is derived from disparate sources. By normalizing the level of cyclin D1 mRNA to a reference message, a quantitative procedure would obviate this dependence on optimal fixation and processing. As long as both messages are similarly affected, a valid relative level can be obtained even if the RNA yield is low due to sub-optimal recovery.
Previous attempts to apply qRT-PCR methods to the analysis of paraffin-embedded tissue sections have encountered limited sensitivity attributable to tissue fixation, particularly when cross-linking fixatives such as formalin are used, leading others to suggest the use of alternative fixatives. 27 We preferred to adapt this method to formalin-fixed and routinely processed tissue to enable us access to the vast tissue resources stored as archived paraffin blocks. The success of the method we have used may be attributed to the extensive proteolysis during RNA extraction and the design of assays with short target amplicons. In this study we were able to measure transcript levels from a single 4-μm section of very small biopsy specimens, such as endoscopic biopsy specimens obtained from the gastrointestinal tract.
We detected cyclin D1 expression in all NHL and reactive lymph node specimens. Although some groups have reported that reactive lymphoid tissues and non-MCL (except for hairy cell leukemia) do not express cyclin D1, 3, 6, 28 several groups have detected low levels of cyclin D1 mRNA or protein in non-neoplastic B lymphocytes and B-cell NHL other than MCL by Northern and Western blotting, respectively, or by RT-PCR. 17, 29 While the manual microdissection technique we used could not ensure the recovery of stromal cell-free lymphoid tissue, the fact that the cyclin D1 levels in various diagnostic categories changed in tandem whether normalized to CyPA or the B-cell-specific CD20 reference message suggests that these differences reflect truly variable expression by the B-cell compartment, rather than a predictably steady contribution by non-lymphoid cells. Furthermore, manual microdissection was adequate to obtain epithelium-free lymphoid tissue from gastrointestinal tract, skin, and salivary gland biopsy specimens. Since epithelial tissues are known to express cyclin D1, microdissection in these cases is necessary for accurate assessment of cyclin D1 levels from lymphoid tissue.
The reliability of our qRT-PCR method for the analysis of microdissected, paraffin-embedded tissue sections of lymphoid tissues is supported by several lines of evidence. The strong linear correlation between levels of two independent constitutive mRNA species confirmed that their recovery was proportional and apparently unaffected by mRNA species. There was a strong positive correlation between cyclin D1 levels and MCL, the diagnosis of which was based on unrelated methods. Other studies using qualitative or semi-quantitative RT-PCR on paraffin tissue or qRT-PCR on fresh-frozen material have reported results very similar to our own. 16, 30, 31 The only studies using real-time qRT-PCR to measure cyclin D1 mRNA levels in paraffin sections of which we are aware are those of Bijwaard and colleagues and Suzuki and colleagues. 30, 31 These authors found significantly higher mean cyclin D1 mRNA levels in MCL compared with all other NHL types assessed. Bijwaard and colleagues 30 also observed large variability in the level of overexpression, approximately 16-fold differences, in MCL cases. Finally, the observed twofold difference in CD20 mRNA level between MCL and CLL/SLL is very similar to that reported for the protein as determined by quantitative flow cytometry by others. 32
The large differences in the level of cyclin D1 mRNA overexpression in MCL, resulting in a non-normal distribution of the mRNA copy number, suggest heterogeneity within the MCL group. This observation is in accordance with the results of cyclin D1 expression determined immunohistochemically. A review of the immunostained slides of the MCL cases in the study group showed that the source of this variability was attributable to both variable protein concentration in individual cells and a variable proportion of lymphoma cells overexpressing the protein. The observed variability of cyclin D1 overexpression in MCL cases possibly reflects the lack of regulatory constraint on the translocated cyclin D1 gene in a cell type that normally barely expresses it. This bias toward high level overexpression resulted in asymmetrical distribution of the cyclin D1 mRNA levels, making it necessary to compare the diagnostic categories by their median values. To maximize the resolving power of statistical calculations we also compared logarithmically transformed cyclin D1 mRNA levels. After such transformation, the data are amenable to analysis by the more powerful parametric statistical tests (parametric analysis of variance followed by Tukey’s pair-wise comparison).
In an attempt to identify a factor that segregates the MCL cases into corresponding subgroups we correlated gender, architectural pattern, and cytological features with cyclin D1 mRNA copy number. We did not observe any difference in level of cyclin D1 overexpression that correlated with architecture (diffuse, nodular, or both), nor could we correlate cyclin D1 levels with cytologic features. Other authors also have failed to correlate morphological variants of MCL with levels of cyclin D1 mRNA or protein. 33
Cyclin D1 is up-regulated during estrogen-induced proliferation of estrogen target tissues, 34 yet MCL afflicts males three to four times more frequently than females. To determine whether there were sex-related differences in cyclin D1 levels in MCL, we compared the values obtained in men and women. The mean cyclin D1 levels were higher in men, but these differences reached marginal statistical significance only for the CD20-normalized values.
Three of our MCL cases tested positive for the t(11;14) by PCR which targets the major translocation cluster (MTC). The MTC is approximately 120 kb distant from the CCND1 gene, and PCR or Southern probes targeting this region demonstrate its involvement in approximately 40 to 50% of MCL cases. 7, 8, 10 The other breakpoints are in closer proximity to the CCND1 gene. 8, 9 Therefore, a possible positional effect of the IgH promoter on cyclin D1 transcription may be inferred by comparing cyclin D1 mRNA levels in PCR-positive and PCR-negative cases. This comparison showed no effect of proximity on cyclin D1 mRNA expression levels. Other authors similarly could not detect any effect of the proximity of the breakpoint site on the nuclear staining intensity by immunohistochemistry. 35 We found only a moderate level of cyclin D1 mRNA in one of our MCL cases (case 55) which, by our criteria, did not constitute overexpression. The lack of cyclin D1 mRNA or protein overexpression has been reported in 5 to 10% of MCL cases. 29, 33, 36 Unlike the reported cases where cyclin D1 protein was undetectable or was not assayed for, our case did show cyclin D1 overexpression by immunohistochemical analysis. Altered post-translational regulation resulting in an enhanced translation of cyclin D1, 37 or a polymorphism or mutation of the affected allele preventing our assay from detecting mRNA overexpression, are possible explanations.
The use of a B-cell-specific normalizer is a novel feature of our study. By comparing the CyPA-normalized and CD20-normalized cyclin D1 mRNA levels, we were able to estimate the contribution of the B-cell fraction to the total cyclin D1 level. This can be especially useful if large numbers of reactive T cells or non-lymphoid cells are included in the specimen. We interpret the high CD20-normalized cyclin D1 values in reactive lymph nodes (23.7% of CD20) compared with B-cell NHLs other than MCL (2.4 to 9.9% of CD20) as indicative of a low overall CD20 level due to admixed non-B cells rather than true cyclin D1 overexpression, since the CyPA-normalized values were not elevated. In our study, the ratio of the CD20-normalized versus CyPA-normalized cyclin D1 levels ranged 0.09 to 0.59 for the NHL groups. In one case analyzed (and excluded from statistical analysis), the CD20-normalized value was 43 times higher than the CyPA-normalized value, suggestive of a very low level of CD20 expression. This patient had received rituximab (anti-CD20) therapy and the low level of CD20 expression might be the result of down-regulation of CD20 expression or selective proliferation of a CD20-negative B-cell clone. 38
In light of our finding that various NHLs express CD20 mRNA at slightly different levels, the use of another B-cell-specific message might be better suited as a normalizer. The concordance of the CD20 mRNA levels with the reported differences of membrane CD20 protein density measured by quantitative flow cytometry studies, 32 however, is reassuring regarding the power of resolution of this paraffin section-based qRT-PCR procedure.
Acknowledgments
We thank Ms. Nancy Shipley and Ms. Mary Sobieski for their expert assistance.
Address reprint requests to L. Jeffrey Medeiros, M.D., Department of Hematopathology, Box 72, The University of Texas M.D. Anderson Cancer Center, 1515 Holcombe Boulevard, Houston, TX 77030. E-mail: jmedeiro@mdanderson.org.
Footnotes
This work was presented, in part, at the 90th Annual Meeting of the United States and Canadian Academy of Pathology, March, 2001 in Atlanta, GA.
References
- 1.Weisenburger DD, Armitage JO: Mantle cell lymphoma: an entity comes of age. Blood 1996, 87:4483-4494 [PubMed] [Google Scholar]
- 2.Swerdlow SH, Nathwani BN, Berger F, Piris MA, Isaacson PI, Harris NL, Muller-Hermelink HK: Mantle cell lymphoma. Jaffe ES Harris NL Stein H Vardiman J eds. Pathology and Genetics of Tumours of Hematopoietic and Lymphoid Tissues 2001:168-170 IARC Press Lyon, France
- 3.Withers DA, Harvey RC, Faust JB, Melnyk O, Carey K, Meeker TC: Characterization of a candidate bcl-1 gene. Mol Cell Biol 1991, 11:4846-4853 [DOI] [PMC free article] [PubMed] [Google Scholar]
- 4.Motokura T, Bloom T, Kim HG, Juppner H, Ruderman JV, Kronenberg HM, Arnold A: A novel cyclin encoded by a bcl1-linked candidate oncogene. Nature 1991, 350:512-515 [DOI] [PubMed] [Google Scholar]
- 5.Vasef MA, Medeiros LJ, Koo C, McCourty A, Brynes RK: Cyclin D1 immunohistochemical staining is useful in distinguishing mantle cell lymphoma from other low-grade B-cell neoplasms in bone marrow. Am J Clin Pathol 1997, 108:302-307 [DOI] [PubMed] [Google Scholar]
- 6.Athanasiou E, Kotoula V, Hytiroglou P, Kouidou S, Kaloutsi V, Papadimitriou CS: In situ hybridization and reverse transcription-polymerase chain reaction for cyclin D1 mRNA in the diagnosis of mantle cell lymphoma in paraffin-embedded tissues. Mod Pathol 2001, 14:62-71 [DOI] [PubMed] [Google Scholar]
- 7.Luthra R, Hai S, Pugh WC: Polymerase chain reaction detection of the t(11;14) translocation involving the bcl-1 major translocation cluster in mantle cell lymphoma. Diagn Mol Pathol 1995, 4:4-7 [DOI] [PubMed] [Google Scholar]
- 8.Williams ME, Swerdlow SH, Rosenberg CL, Arnold A: Characterization of chromosome 11 translocation breakpoints at the bcl-1 and PRAD1 loci in centrocytic lymphoma. Cancer Res 1992, 52:5541s-5544s [PubMed] [Google Scholar]
- 9.de Boer CJ, Loyson S, Kluin PM, Kluin-Nelemans HC, Schuuring E, van Krieken JH: Multiple breakpoints within the BCL-1 locus in B-cell lymphoma: rearrangements of the cyclin D1 gene. Cancer Res 1993, 53:4148-4152 [PubMed] [Google Scholar]
- 10.Medeiros LJ, Van Krieken JH, Jaffe ES, Raffeld M: Association of bcl-1 rearrangements with lymphocytic lymphoma of intermediate differentiation. Blood 1990, 76:2086-2090 [PubMed] [Google Scholar]
- 11.Weisenburger DD, Sanger WG, Armitage JO, Purtilo DT: Intermediate lymphocytic lymphoma: immunophenotypic and cytogenetic findings. Blood 1987, 69:1617-1621 [PubMed] [Google Scholar]
- 12.Wlodarska I, Pittaluga S, Hagemeijer A, De Wolf-Peeters C, Van Den Berghe H: Secondary chromosome changes in mantle cell lymphoma. Haematologica 1999, 84:594-599 [PubMed] [Google Scholar]
- 13.Li J-Y, Gaillard F, Moreau A, Harousseau J-L, Laboisse C, Milpied N, Bataille R, Avet-Loiseau H: Detection of translocation t(11;14)(q13;q32) in mantle cell lymphoma by fluorescence in situ hybridization. Am J Pathol 1999, 154:1449-1452 [DOI] [PMC free article] [PubMed] [Google Scholar]
- 14.Katz RL, Caraway NP, Gu J, Jiang F, Pasco-Miller LA, Glassman AB, Luthra R, Hayes KJ, Romaguera JE, Cabanillas FF, Medeiros LJ: Detection of chromosome 11q13 breakpoints by interphase fluorescence in situ hybridization: a useful ancillary method for the diagnosis of mantle cell lymphoma. Am J Clin Pathol 2000, 114:248-257 [DOI] [PubMed] [Google Scholar]
- 15.Remstein ED, Kurtin PJ, Buno I, Bailey RJ, Proffitt J, Wyatt WA, Hanson CA, Dewald GW: Diagnostic utility of fluorescence in situ hybridization in mantle cell lymphoma. Br J Haematol 2000, 110:856-862 [DOI] [PubMed] [Google Scholar]
- 16.Aguilera NS, Bijwaard KE, Duncan B, Krafft AE, Chu WS, Abbondanzo SL, Lichy JH, Taubenberger JK: Differential expression of cyclin D1 in mantle cell lymphoma and other non-Hodgkin’s lymphomas. Am J Pathol 1998, 153:1969-1976 [DOI] [PMC free article] [PubMed] [Google Scholar]
- 17.Sola B, Salaun V, Ballet JJ, Troussard X: Transcriptional and post-transcriptional mechanisms induce cyclin-D1 overexpression in B-chronic lymphoproliferative disorders. Int J Cancer 1999, 83:230-234 [DOI] [PubMed] [Google Scholar]
- 18.Thomazy VA, Croitoru CM, Biddle DA, Davies PJA, Farhood AI: Analysis of HER2/neu overexpression in microdissected paraffin sections of invasive breast carcinoma by real-time quantitative RT-PCR. Mod Pathol 2000, 13:48A [Google Scholar]
- 19.Shi SR, Key ME, Kalra KL: Antigen retrieval in formalin-fixed, paraffin-embedded tissues: an enhancement method for immunohistochemical staining based on microwave oven heating of tissue sections. J Histochem Cytochem 1991, 39:741-748 [DOI] [PubMed] [Google Scholar]
- 20.Ahuja HS, Liu S, Crombie DL, Boehm M, Leibowitz MD, Heyman RA, Depre C, Nagy L, Tontonoz P, Davies PJ: Differential effects of rexinoids and thiazolidinediones on metabolic gene expression in diabetic rodents. Mol Pharmacol 2001, 59:765-773 [DOI] [PubMed] [Google Scholar]
- 21.Gibson UE, Heid CA, Williams PM: A novel method for real time quantitative RT-PCR. Genome Res 1996, 6:995-1001 [DOI] [PubMed] [Google Scholar]
- 22.Heid CA, Stevens J, Livak KJ, Williams PM: Real-time quantitative PCR. Genome Res 1996, 6:986-994 [DOI] [PubMed] [Google Scholar]
- 23.Tedder TF, Streuli M, Schlossman SF, Saito H: Isolation and structure of a cDNA encoding the B1 (CD20) cell-surface antigen of human B lymphocytes. Proc Natl Acad Sci USA 1988, 85:208-212 [DOI] [PMC free article] [PubMed] [Google Scholar]
- 24.Haendler B, Hofer-Warbinek R, Hofer E: Complementary DNA for human T-cell cyclophilin. EMBO J 1987, 6:947-950 [DOI] [PMC free article] [PubMed] [Google Scholar]
- 25.Xiong Y, Connolly T, Futcher B, Beach D: Human D-type cyclin. Cell 1991, 65:691-699 [DOI] [PubMed] [Google Scholar]
- 26.Ryffel B, Woerly G, Greiner B, Haendler B, Mihatsch MJ, Foxwell BM: Distribution of the cyclosporine binding protein cyclophilin in human tissues. Immunology 1991, 72:399-404 [PMC free article] [PubMed] [Google Scholar]
- 27.Goldsworthy SM, Stockton PS, Trempus CS, Foley JF, Maronpot RR: Effects of fixation on RNA extraction and amplification from laser capture microdissected tissue. Mol Carcinog 1999, 25:86-91 [PubMed] [Google Scholar]
- 28.Delmer A, Ajchenbaum-Cymbalista F, Tang R, Ramond S, Faussat AM, Marie JP, Zittoun R: Overexpression of cyclin D2 in chronic B-cell malignancies. Blood 1995, 85:2870-2876 [PubMed] [Google Scholar]
- 29.de Boer CJ, van Krieken JH, Kluin-Nelemans HC, Kluin PM, Schuuring E: Cyclin D1 messenger RNA overexpression as a marker for mantle cell lymphoma. Oncogene 1995, 10:1833-1840 [PubMed] [Google Scholar]
- 30.Bijwaard KE, Aguilera NS, Monczak Y, Trudel M, Taubenberger JK, Lichy JH: Quantitative real-time reverse transcription-PCR assay for cyclin D1 expression: utility in the diagnosis of mantle cell lymphoma. Clin Chem 2001, 47:195-201 [PubMed] [Google Scholar]
- 31.Suzuki R, Takemura K, Tsutsumi M, Nakamura S, Hamajima N, Seto M: Detection of cyclin D1 overexpression by real-time reverse-transcriptase-mediated quantitative polymerase chain reaction for the diagnosis of mantle cell lymphoma. Am J Pathol 2001, 159:425-429 [DOI] [PMC free article] [PubMed] [Google Scholar]
- 32.Ginaldi L, De Martinis M, Matutes E, Farahat N, Morilla R, Catovsky D: Levels of expression of CD19 and CD20 in chronic B-cell leukaemias. J Clin Pathol 1998, 51:364-369 [DOI] [PMC free article] [PubMed] [Google Scholar]
- 33.Bosch F, Jares P, Campo E, Lopez-Guillermo A, Piris MA, Villamor N, Tassies D, Jaffe ES, Montserrat E, Rozman C, Cardesa A: PRAD-1/cyclin D1 gene overexpression in chronic lymphoproliferative disorders: a highly specific marker of mantle cell lymphoma. Blood 1994, 84:2726-2732 [PubMed] [Google Scholar]
- 34.Sabbah M, Courilleau D, Mester J, Redeuilh G: Estrogen induction of the cyclin D1 promoter: involvement of a cAMP response-like element. Proc Natl Acad Sci USA 1999, 96:11217-11222 [DOI] [PMC free article] [PubMed] [Google Scholar]
- 35.Swerdlow SH, Yang WI, Zukerberg LR, Harris NL, Arnold A, Williams ME: Expression of cyclin D1 protein in centrocytic/mantle cell lymphomas with and without rearrangement of the BCL1/cyclin D1 gene. Hum Pathol 1995, 26:999-1004 [DOI] [PubMed] [Google Scholar]
- 36.Ott MM, Helbing A, Ott G, Bartek J, Fischer L, Durr A, Kreipe H, Muller-Hermelink HK: Bcl-1 rearrangement and cyclin D1 protein expression in mantle cell lymphoma. J Pathol 1996, 179:238-242 [DOI] [PubMed] [Google Scholar]
- 37.Rimokh R, Berger F, Bastard C, Klein B, French M, Archimbaud E, Rouault JP, Santa Lucia B, Duret L, Vuillaume M, Coiffier B, Bryon P-A, Magaud JP: Rearrangement of CCND1 (BCL1/PRAD1) 3′ untranslated region in mantle cell lymphomas and t(11q13)-associated leukemias. Blood 1994, 83:3689-3696 [PubMed] [Google Scholar]
- 38.Davis TA, Czerwinski DK, Levy R: Therapy of B-cell lymphoma with anti-CD20 antibodies can result in the loss of CD20 antigen expression. Clin Cancer Res 1999, 5:611-615 [PubMed] [Google Scholar]