

Abstract
Improved extraction techniques combined with sensitive real-time reverse transcriptase-polymerase chain reaction may allow detection of mRNA in formalin-fixed, paraffin-embedded (FFPE) materials, but the factors affecting mRNA quantification in clinical material using these methods have not been systematically analyzed. We designed analyses using real-time reverse transcriptase-polymerase chain reaction for quantification of MART-1, β-actin, and β2-microglobulin mRNAs. The analytical intra- and interassay imprecision (coefficient of variation) was in the range 10 to 20% for all three genes studied. Using these protocols, we studied the influence of tissue autolysis and length of formalin-fixation on mRNA detection in metastatic melanoma. Delay in freezing reduced detectable mRNA, although this was less than predicted and mostly occurred early in autolysis. MART-1, β-actin, and β2-microglobulin mRNAs were consistently detected in FFPE metastatic melanoma even after fixation for up to 3 weeks, although the total mRNA detected was markedly reduced in fixed compared with fresh tissues (up to 99%). Quantification of MART-1 was, however, possible if this was expressed relative to a housekeeping gene. The polymerase chain reaction product from FFPE tissues could be increased up to 100-fold amplifying short (<136 bp) compared with long amplicons. Variations in time before tissue processing and in fixation length seem to be less important sources of imprecision than previously assumed. Our findings suggest that quantitative analysis of mRNA in archive and routine diagnostic tissues may be possible.
Analysis of gene expression at the mRNA level is a central component of molecular profiling. Sensitive and specific methods for studying RNA derived from fresh tissues and cells are well described, and include techniques based on the use of reverse transcriptase-polymerase chain reaction (RT-PCR). Recent technological improvements, including the introduction of highly sensitive fluorescence-based real-time RT-PCR procedures, now allow for rapid and specific quantification of even small amounts of mRNA. 1 Although mRNA is relatively stable in fresh/frozen tissue, morphological examination of cryostat-sectioned material is suboptimal making molecular histopathological correlations difficult. Furthermore, the logistical problems involved in collecting fresh tissue samples are substantial. In the past, the use of RT-PCR based methods to quantify mRNA in clinical specimens has been restricted by the limited availability of suitable fresh or frozen study tissues.
One possible answer to this problem may lie in the archives of formalin-fixed, paraffin-embedded (FFPE) tissue specimens held in histopathology departments throughout the world. These collections already represent an invaluable research resource for studying the molecular basis of disease, making it possible to perform large retrospective studies correlating molecular features with therapeutic response and clinical outcome. In recent years, reliable techniques for the immunohistochemical analysis of gene expression in paraffin sections have been developed that form the basis for numerous assays both in research and in routine diagnosis. Similarly, techniques for extraction and analysis of DNA from FFPE tissues have been optimized allowing a range of molecular genetic studies to be performed on archival and routine diagnostic histopathological material. The ability to study mRNA expression in FFPE tissues, even to a limited degree, would be an important advance, opening up the histopathology archive to molecular profiling and allowing analysis of gene expression at the RNA level in standard diagnostic specimens.
Traditionally, it has been considered impossible to perform RT-PCR on archival tissue, partly because the extracted RNA was extensively degraded and partly because the amounts present were too small to be amplified by conventional means. 2 However, improved techniques for extracting RNA from fixed specimens based on the use of proteinase K digestion followed by phenol-chloroform extraction, 3, 4 and the application of highly sensitive fluorescence-based real-time RT-PCR procedures 5, 6, 7 have shown that it is possible to detect mRNA in FFPE tissue. The unanswered question is whether mRNA analysis in FFPE is sufficiently reliable to allow its routine use. Various factors may affect the results of molecular analysis in FFPE compared with fresh/frozen tissues. However, the extent to which these influence quantitative gene expression analysis has not been systematically addressed. The purpose of this study was to establish protocols for real-time RT-PCR on FFPE tissues, to determine the effect on quantitative gene expression analysis of formalin fixation (including prolonged fixation), and to quantify the influence of a period of autolysis before freezing (as a surrogate for prefixation delay in the diagnostic setting). This work is part of a larger study aimed at developing molecular tools for the detection of melanoma micrometastases in sentinel lymph nodes. Therefore, we chose as a model system to study expression of the melanocyte-associated gene MART-1 and the housekeeping genes β-actin and β2-microglobulin (β2-M) in fresh and FFPE lymph nodes with melanoma metastases.
Materials and Methods
Tissue Collection and Processing
Lymph nodes were obtained fresh, directly from the operating theater from four different patients undergoing elective lymph node dissection for metastatic malignant melanoma. The diagnosis of each tumor was confirmed by histological examination with supplementary immunohistochemical staining (data not shown). Each fresh tumor sample was cut into 10 macroscopically similarly sized pieces and placed in separate Eppendorf tubes. Two samples were immediately snap-frozen in liquid nitrogen and stored at −80°C until used. The remaining four pairs of tissue samples were held at room temperature for 1, 2, 3, and 24 hours, respectively, before being snap-frozen (Figure 1A) . For the experiments with FFPE tissues, an additional four pairs of samples from two of the tumors were fixed in 4% neutral buffered formalin for various fixation times (Figure 1B) . Samples were of similar size to ensure comparable formalin infiltration. After fixation the tissue samples were processed and embedded in paraffin according to standard procedures.
Figure 1.

Schematic overview of the sampling protocol for four experiments of prefreezing delay (A) and experiments of fixation time (B). Duplicate RT-measurements were performed on each sample.
RNA Extraction
Frozen Tissue
Total RNA was isolated from frozen tissue using RNeasy Mini Kits (Qiagen, Valencia, CA) and treated with DNase according to the manufacturer’s instructions.
Formalin-Fixed, Paraffin-Embedded Tissue
RNA was extracted from FFPE material using the Paraffin Block, RNA isolation kit (Ambion Inc., Austin, TX) with modifications. Briefly, 20-μm paraffin sections were cut, deparaffinized by incubation in xylene for 20 minutes, centrifuged, and washed three times in 100% ethanol. After each wash, the sample was centrifuged at room temperature. After the final wash, the material was air-dried and then incubated in digestion buffer with proteinase K. The residue was then homogenized and incubated overnight at 55°C. RNA was purified by the addition of RNA extraction buffer. Chloroform was then added, followed by additional incubation and centrifugation. The aqueous phase was removed to fresh tubes and the RNA was precipitated with an equal volume of isopropanol in the presence of linearized acrylamide. Samples were incubated at −20°C for at least 30 minutes, after which RNA was pelleted and washed twice in 75% ethanol, with intervening centrifugation at 4°C. After the final centrifugation, the pellet was air-dried and resuspended in 10 μl of RNA storage solution. To remove genomic DNA, all samples underwent DNase treatment according to the manufacturer. All reagents were from Ambion.
RNA Quantification
The amount of RNA in the samples was measured using the RiboGreen RNA quantitation kit (Molecular Probes Inc., Eugene, OR) and by fluorometry (Fluoroskan Ascent FL; Thermo Labsystems, Helsinki, Finland). On the basis of these calculations, all samples were diluted to 0.1 μg/μl.
Primers
Primers for β-actin (amplicon size, 99 bp), β2-M (amplicon size, 85 bp), and nested MART-1 (amplicon size, 497 bp/439 bp) were as published. 5, 8, 9 We designed primers for an additional nested PCR for MART-1 with a short amplicon size (136 bp/89 bp). The primers were all intron spanning; their sequences are listed in Table 1 .
Table 1.
Primer Sequences and Sizes of RT-PCR Products
| Target | Sequence | S/AS | Amplicon size, bp |
|---|---|---|---|
| β-actin (long) | 5′-GGC GGC ACC ACC ATG TAC CCT-3′ | S | 313 |
| 5′-AGG GGC CGG ACT CGT CAT ACT-3′ | |||
| (RT: 10 pmol/PCR 2.5 pmol/68°C/40 cycles)* | AS | ||
| β-actin (short) 5 | 5′-CCA CAC TGT GCC CAT CTA CG-3 | S | 99 |
| 5′-AGG ATC TTC ATG AGG TAG TCA GTC AG-3 | AS | ||
| (RT: 10 pmol/PCR: 2.5 pmol/64°C/40 cycles)* | |||
| β2-M 8 | 5′-TGA CTT TGT CAC AGC CCA AGA TA-3′ | S | 85 |
| 5′-AAT CCA AAT GCG GCA TCT TC-3′ | AS | ||
| (RT: 15 pmol/PCR 15 pmol/60°C/40 cycles)* | |||
| MART-1 (long) 9 | |||
| (M1long) | 5′-GAA GGT GTC CTG TGC CCT GAC CC-3′ | S | 497 |
| (M2long) | 5′-GGC TTG CAT TTT TCC TAC ACC ATT CC-3′ | AS | |
| (RT-PCR: 2.5 pmol/65°C/30 cycler)* | |||
| (M3long) | 5′-ATG CCA AGA GAA GAT GCT-3′ | S | 439 |
| (M4long) | 5′-GGA GAA CAT TAG ATG TCT G-3′ | AS | |
| (nested PCR: 2.5 pmol/55°C/40 cycler)* | |||
| MART-1 (short) | |||
| (M1short) | 5′-TGC CAA GAG AAG ATG CTC AC-3′ | S | 136 |
| (M2short) | 5′-CAA CAG CCG ATG AGC AGT AA-3′ | AS | |
| (RT-PCR: 5 pmol/60°C/10 cycler)* | |||
| (M3short) | 5′-TCT ATG GTT ACC CCA AGA AGG-3′ | S | 89 |
| (M4short) | 5′-TCC CAG GAT CAC TGT CAG G-3′ | AS | |
| (nested PCR: 5 pmol/60°C/40 cycler)* |
Abbreviations: AS, anti-sense; S, sense.
Items in parentheses refer to RT-PCR conditions (primer concentration/annealing temperature/number of PCR cycles).
Reverse Transcription (RT)
β-actin and β2-M mRNA was reverse-transcribed by adding 0.1 μg of RNA to a reaction mixture consisting of 1× PCR buffer II (Applied Biosystems, Foster City, CA) supplemented with 6.3 mmol/L MgCl2, 0.3 mmol/L of each of the four deoxyribonucleoside triphosphates (dATP, dTTP, dGTP, dCTP), anti-sense primer (concentrations given in Table 1 ), 20 U RNase inhibitor, and 50 U MULV reverse transcriptase (Applied Biosystems) in a total volume of 20 μl. RT was performed in a Gene Amp PCR system 9700 thermocycler (Applied Biosystems) at 42°C for 30 minutes followed by 99°C for 5 minutes. Two μl of the resulting cDNA was used immediately for real-time PCR, or the cDNA was stored at −20°C.
Reverse Transcriptase-Polymerase Chain Reaction (RT-PCR)
To have as sensitive a method as possible, detection of MART-1 mRNA was performed as nested RT-PCR. To ensure comparability this was done both for frozen and fixed specimens. Each RT-PCR reaction contained 0.1 μg of RNA in a 1× PCR buffer (Qiagen) supplemented with 1.25 mmol/L MgCl2, 0.1 mmol/L of each deoxyribonucleoside triphosphate (dATP, dTTP, dGTP, dCTP), M1 and M2 primers (concentrations as shown in Table 1 ), 1 U Taq-polymerase (Qiagen), 50 U MULV reverse transcriptase (Applied Biosystems), and 20 U RNase inhibitor in a total volume of 40 μl. One step RT-PCR amplification was then performed in a Gene Amp PCR system 9700 thermocycler according to the following schedule: RT at 37°C for 60 minutes followed by denaturation at 94°C for 1 minute. The PCR amplification profile was: 15 seconds at 94°C, 30 seconds at 65°C, and 30 seconds at 72°C. After 30 cycles for MART-1 (long) and 10 cycles for MART-1 (short), the PCR product was extended at 72°C for 7 minutes. After amplification, 2 μl of the PCR product was used as template for the second round PCR, which was performed as real-time PCR (see below).
Real-Time PCR
Two μl of cDNA (β-actin, β2-M,) or 2 μl of PCR product (MART-1) were used as template for real-time PCR in a reaction mixture containing 4 mmol/L of MgCl2, primers as shown in Table 1 , 2 μl mix from SYBR Green I kit [containing TaqDNA polymerase, reaction buffer, deoxyribonucleoside triphosphate (dATP, dTTP, dGTP, dCTP), SYBR Green I dye, and 10 mmol/L of MgCl2; Roche Molecular Biochemicals, Indianapolis, IN], the volume being adjusted to 20 μl with nuclease-free water. The samples were amplified in the Lightcycler System (Roche) and the PCR was performed by an initial denaturation step at 95°C for 30 seconds and then 40 cycles with a 95°C denaturation immediately followed by annealing (temperature given in Table 1 ) for 5 seconds and 72°C extension for 10 seconds. After 40 cycles a melting curve was generated for the final PCR product of all genes investigated by decreasing the temperature to 65°C for 10 seconds followed by a slow increase in temperature to 95°C. During the slow heating process the fluorescence is measured at 0.2°C increments. To further ensure specificity, a gel electrophoresis was conducted for selected samples of each specific product. It consistently revealed bands of the expected length.
Experimental Design
RT was performed in duplicate for each RNA sample. RNA for a calibration curve was included in every RT together with a high- and a low-positive control in duplicate and one negative control (without RNA) to exclude potential contamination. PCR reactions for both standard curve (including positive and negative controls) and samples were performed from each RT. The interassay and intra-assay variation was determined by analyzing the positive controls in 10 consecutive analytical runs (interassay variation) with each sample analyzed in duplicate (intra-assay variation) (Table 2) .
Table 2.
Coefficients of Variation (CV) Calculated for mRNAs with Short Fragments
| n = 10 | Mean (arbitrary units*) | CV intra-assay (%) | CV interassay (%) |
|---|---|---|---|
| β-actin (99 bp) | |||
| High control | 0.14 | 9 | 12 |
| Low control | 0.0007 | 17 | 31 |
| β2-M (85 bp) | |||
| High control | 0.13 | 10 | 23 |
| Low control | 0.0008 | 15 | 34 |
| MART-1 (136 bp) | |||
| High control | 23 | 11 | 26 |
| Low control | 2 | 26 | 40 |
For β-actin and β2-M the high and low quantity controls are 0.1 and 0.001 μg of HCV29 RNA, respectively, isolated from the urothelial cell line HCV 29. For MART-1 the high and low quantity control are RNA isolated from 20 and 5 HTB 72 melanoma cells, respectively.
Described in Material and Methods.
Real-Time PCR: SYBR Green Detection
In this study the basis for quantitative real-time PCR is a system that continuously measures binding of a fluorescent dye (SYBR Green I) to the nascent double-stranded DNA in the sample. After an initial denaturation at 95°C, all input cDNA becomes single stranded. At this stage of the reaction, SYBR Green I dye will not bind and the intensity of the fluorescence signal is low. During annealing, the PCR primers hybridize to the target sequence resulting in short double-stranded DNA sequences to which the SYBR Green I dye can bind. In the elongation phase of the PCR, the primers are extended and more SYBR Green I can bind resulting in an increase of fluorescence. At the end of the elongation phase when all DNA is double stranded, the maximum amount of dye is bound and the fluorescence is recorded (at 530 nm). Increasing amounts of PCR product can be monitored from cycle to cycle and quantification is based on fluorescence measurements in real-time. The assay results are expressed as amount of specific product formed (absolute values). Because SYBR Green I binds nonspecifically to all double-stranded DNA including primer-dimers a melting curve analysis has to be performed. Because each double-stranded DNA product has its own specific melting temperature partly determined by the length and the guanine/cytosine content of the fragment, this analysis allows reliable differentiation between specific and nonspecific PCR products.
Standard Curve
Construction of a standard curve for β-actin and β2-M was achieved using RNA from a cultured urothelial cell line HCV 29. 10 The RNA was diluted in water to give five different calibrators with known amounts of HCV 29 RNA in 10-fold dilutions (calibrators 1 to 5 contained 1.0 μg to 0.00001 μg of HCV29 RNA/μl; 1 μl of calibrator RNA was used in each calibrator RT-PCR). The amount of housekeeping gene mRNA present in 1 μg of HCV29 RNA was defined as 1 arbitrary unit of HCV29 β-actin and β2-M mRNA, respectively. Results of unknown samples were expressed as arbitrary units of HCV29 RNA/μg sample RNA. For MART-1 a standard curve of eight calibrators was obtained using RNA isolated from the melanoma cell line HTB 72 (American Type Culture Collection, Manassas, VA). The calibration curve was obtained using dilutions of RNA isolated from 400 HTB 72 cells (calibrators 1 to 8 contained RNA ranging from 400 to 0.16 HTB 72 cells/μl; 1 μl of calibrator was used in each calibrator RT-PCR). The amount of MART-1 mRNA present in 400 HTB 72 cells was defined as 1 arbitrary unit of HTB 72 cells. Results of unknown samples are expressed in arbitrary units of HTB 72 cells/μg sample RNA.
For each amplicon investigated a corresponding standard curve is generated with the same primers (both short and long) as the investigated samples and included in each run.
Results
Evaluation of the Variation of the Quantitative Real-Time RT-PCR Techniques
The analytical imprecision of the assays is summarized in Table 2 . This depended on the amount of mRNA present. For high quantity controls, the analytical interassay imprecision (coefficient of variation) ranged from 12 to 26%, whereas the range for low quantity controls was 31 to 40%. In most of the experiments in our study the samples were in the range of the high quantity controls.
Effect of Freezing Delay on mRNA Levels (Figures 2 and 3)
Figure 2.
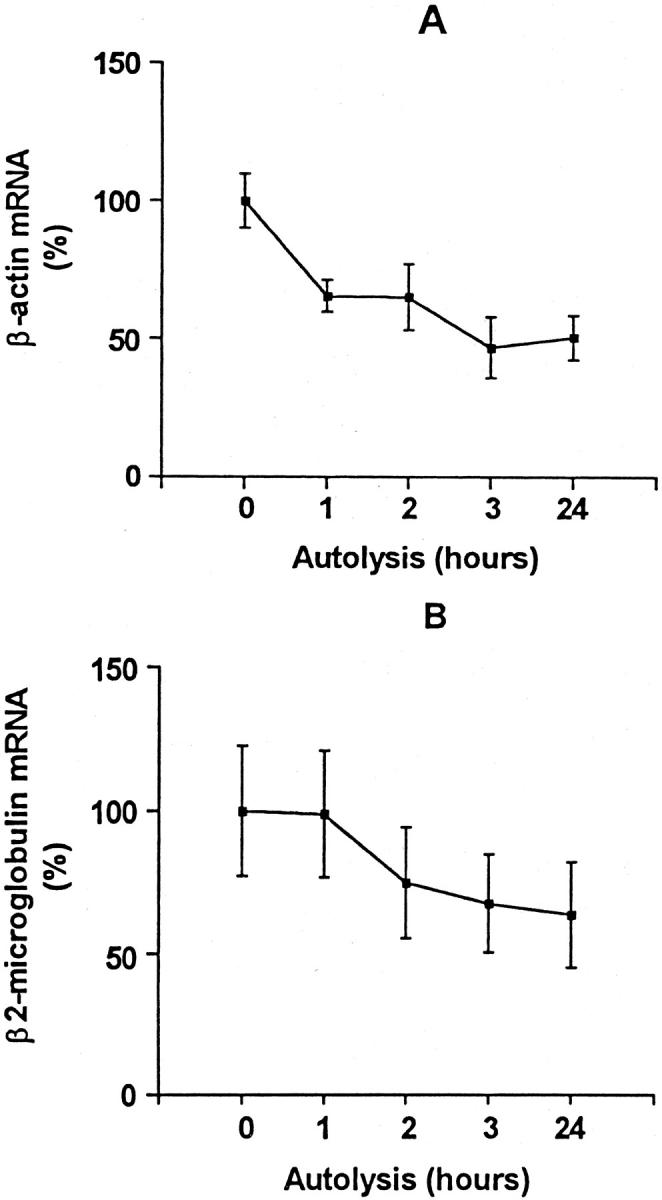
Quantification of β-actin (amplicon size, 99 bp; A) and β2-M (amplicon size, 85 bp; B) in samples frozen after prolonged storage at room temperature. Each point represents the mean of duplicate measurements of paired samples obtained from melanoma metastases from four different patients (n = 4). Data are expressed as percentage of mRNA normalized to point 0 hour. Vertical lines represent ± SEM.
Figure 3.

Effect of delay in freezing on the expression of mRNA for MART-1. Ten samples from each of four different patients (n = 4) were obtained from melanoma lymph node metastases. Data are expressed as a ratio between arbitrary units of MART-1 mRNA and β-actin mRNA. The measurement of MART-1 and β-actin mRNA levels are described in the Materials and Methods. Amplicon sizes for MART-1 and β-actin were 136 bp and 99 bp, respectively. Each point represents the mean of paired samples measured in duplicate. Vertical lines represent minimum and maximum measurement.
In the first series of experiments, we investigated the effect of delayed freezing (autolysis) on the quantification of β-actin, β2-M, and MART-1 RNA; amplicons were of comparable size (99 bp, 85 bp, and 136 bp, respectively).
Housekeeping Genes
mRNA for β-actin and β2-M could be detected in all samples. The expression of mRNA for both β-actin and β2-M decreased to a mean of 50% (SEM, 8%) and 64% (SEM, 18%), respectively, comparing 0 and 24 hours of fixation delay (n = 4). The higher SEM for β2-M might be explained by differences in the analytical precision (Table 2) . For both genes it appeared that the decrease in mRNA was most pronounced within the first hours of autolysis (Figure 2) .
Cell-Specific Gene
As expected for a melanocyte-specific gene MART-1, the level of gene expression showed marked variation comparing samples from different tumors (data not shown). Also as expected from the housekeeping gene results, variation was found depending on freezing delay. However, expressing MART-1 relative to the content of β-actin markedly diminished the observed variation (Figure 3) . Comparable results were obtained if β2-M was used as the reference gene (data not shown). In general, there was no apparent change in relative expression of MART-1 in samples after between 0 and 24 hours of autolysis.
Effect of Formalin Fixation, Fixation Time, and Amplicon Size on mRNA Quantification (Figures 4 and 5)
Figure 4.

The effect of different amplicon sizes and different fixation times on the quantification of mRNA for β-actin. Results shown are means of duplicate measurements of samples obtained from two melanoma lymph node metastases (I and II). Data are expressed as percentage of β-actin mRNA present in the corresponding frozen tissue (99 bp).
Figure 5.

The effect of different fixation times and different amplicon sizes on the quantification of MART-1. Mean of duplicate measurements of two (I and II) melanoma lymph node metastases are expressed as a ratio between arbitrary units of mRNA for MART-1 and mRNA for β-actin (amplicon size, 99 bp). Data are expressed in percent normalized to matched frozen sample (99 bp).
Attention was focused on RNA integrity and yield as a function of fixation time using expression of β-actin and MART-1 mRNAs as a model. In all of the samples, mRNA specific for β-actin and MART-1 could be detected in FFPE melanoma tissue, even after prolonged formalin fixation for up to 21 days (Figures 4 II and 5 II) . However, a marked decrease (85 to 99%) in mRNA levels for both β-actin and MART-1 was seen in FFPE tissue (even after 1 day of fixation) compared with matched frozen tissue. This decrease was most pronounced when amplifying long fragments.
The mRNA yield from fresh tissue was high compared to formalin-fixed tissue. In the fresh tissue different amplicon sizes (313 bp versus 99 bp) did not affect the yield of mRNA for β-actin (Figure 4) , whereas an up to 10-fold difference was seen for MART-1 (amplicon size, 497 bp versus 136 bp; Figure 5 II ). In the fixed tissues the mRNA recovery, using short compared with long amplicons, was 20-fold greater for β-actin and 100-fold greater for MART-1. Fixation for prolonged periods (5 days or more) did not show any systematic decrease in PCR product for neither short nor longer amplicon sizes (Figures 4 and 5) .
Discussion
DNA is naturally robust, and its purification from paraffin-embedded tissue is now a routine laboratory procedure. In contrast, RNA is sensitive to degradation by essentially ubiquitous RNases making its recovery from archival material problematic. It has been known for some years that degraded RNA could be obtained from FFPE tissue, 11 and that this could be used as a substrate for identification of specific sequences using RT-PCR. 12 However, other workers have found only minimal amplifiable mRNA in paraffin blocks, 2 suggesting that formalin fixation precluded later use of such material for investigation of gene expression by RT-PCR. Indeed, the lack of published reports of successful PCR amplification of RNA from archive material confirms that this has been the prevailing view.
More recently several groups have reported that the small amounts of RNA available in FFPE tissues can be amplified using highly sensitive real-time RT-PCR techniques. 5, 7, 13 Our study confirms these findings. Using real-time RT-PCR, we were consistently able to detect mRNA for both MART-1 and for the housekeeping genes β-actin and for β2-M in FFPE melanoma metastases, even after prolonged fixation in formalin for up to 3 weeks. This was partly dependent on the use of optimized extraction procedures with proteinase K digestion. Clearly, formalin fixation markedly reduces the amount of RNA that can be extracted from paraffin blocks—in our study by up to 99% when using standard primers. However, by using PCR primers that amplify short sequences it was possible to increase the yield of amplifiable RNA by up to 100-fold. The increased sensitivity we found using smaller amplicon sizes is consistent with other studies that have suggested that formalin fixation degrades RNA. 5 Although, length of fixation may be a problem for quantification, our experiments did not show any systematic decrease in PCR product as a function of fixation length.
One important factor that may limit the ability to quantify mRNA in FFPE tissues is delay in fixation. In particular, it has been widely assumed that because prefixation times vary for routine specimens, and will rarely be known retrospectively, that quantification of gene expression in archival specimens would be unreliable. 14 However, although much is known about the regulation and degradation of mRNA in experimental systems, 15, 16 surprisingly little has been published concerning the stability and turnover of mRNAs in clinical specimens. Given that typical half-lives for mRNAs vary from a few minutes for the most labile to more than 24 hours for the more stable gene products such as those from globin genes, it would be expected that delay in fixation would result in a skewed representation of mRNAs extracted from paraffin blocks. Most previous studies of RNA decay in in vivo specimens have been performed on frozen tissues from autopsy brains. 17, 18, 19, 20 These show surprisingly stable retention of a variety of mRNAs postmortem, although by their nature they lack evaluation of RNA degradation in the important first hours of death. Other studies have looked at the effect of RNA degradation on quantification of gene expression by RT-PCR in cultured cells. 21, 22 However, for several reasons it is uncertain whether the results of such studies can be directly extrapolated to the in vivo situation. In particular, gene expression patterns and rates of RNA degradation may not be representative in in vitro cells separated from other tissue elements. Thus, it is important to study the factors affecting RNA degradation in clinical specimens.
To evaluate in vivo RNA decay we chose a model reflecting daily routine as closely as possible. Freezing delays up to 24 hours were chosen to reflect the absolute worst case situation for delayed tissue processing. For both β-actin and β2-M genes a decrease in mRNA level was seen, most of this decrease apparently occurring within the first 2 hours of autolysis after which a steady state appeared. Godfrey and colleagues 5 have also looked at the effect on quantification of several mRNAs of delayed freezing/fixation. They studied liver specimens from a single patient, and found that a delay of up to 12 hours before fixation did not change the relative expression of the genes studied. Our results confirm this finding and further show that this applies for tissues other than RNA-rich liver, and when a larger series of patient tumors is studied with parallel analyses. There are several possible explanations for the relative stability of mRNA levels in tissues after surgical removal. Firstly, although there will be progressive depletion of oxygen and nutrients, it is reasonable to assume that initially the tissue will continue to metabolize and to transcribe RNA. Secondly, and probably more importantly, tissue and cell integrity will be primarily maintained during the autolytic period limiting the access of RNases to intracellular mRNA. Indeed, studies of autopsy brains show that the relative stability of RNA postmortem is lost once the tissue has been frozen and then thawed out, after which RNA decay is greatly accelerated. 18, 20 Freeze/thaw cycles will not only stop tissue metabolism, but will also rupture cells, making the intracellular compartment more accessible to RNases.
Our study provides useful information about the two housekeeping genes investigated. The choice of such genes is important, but often difficult. The ideal housekeeping gene is one that is expressed at constant, moderate levels in all tissues. When used as a reference gene it must reflect the target gene with respect to turnover rate. This is of course impossible to achieve and in practice these genes may show variation in expression in different tissues and under different experimental conditions. 22 Furthermore, little is known about the expression of housekeeping genes in tumor tissues, although some have been shown to be up-regulated in cancer. 23, 24 In our experiments, the higher SEM for detecting β2-M mRNA compared with β-actin mRNA is more likely to be related to analytical imprecision (Table 2) than to biological variation. Thus, there is no evidence that intertumor variation in expression of these two housekeeping genes is likely to be a significant source of imprecision when they are used as controls to quantify mRNA levels in melanoma.
We also studied expression of a cell-specific mRNA—MART-1. This gene product is a transmembrane molecule found on melanocytic cells. Neither the biological function of MART-1, nor the half-life of its mRNA are known. We wanted to see if there was any significant decrease in expression of this gene as a function of autolysis. The absolute quantification of MART-1 mRNA showed considerable differences comparing samples, both intratumoral and marked intertumoral variation being found (data not shown). However, to correct for variation because of insufficient starting material and inefficient cDNA synthesis, we chose to express MART-1 mRNA levels relative to a reference gene. MART-1 mRNA was normalized to both β2-M and β-actin mRNAs to evaluate which of the two housekeeping gene products it resembled most with respect to turnover rate. This analysis gave almost identical results whether MART-1 was expressed relative to β-actin or to β2-M (data not shown in full). MART-1 mRNA showed relatively constant expression with only minor intratumoral variation, whereas the intertumoral (presumably biological) variation was still considerable (Figure 3) . Thus, the turnover rate for MART-1 appears to reflect both β-actin and β2-M, making them both suitable reference genes in our experiments. MART-1 mRNA could be easily detected, even after 24 hours of prefreezing delay. No significant change in expression levels could be identified as a function of autolysis time. This result suggests that mRNA may be more robust in vivo than sometimes supposed, although this should be interpreted with care. An alternative explanation may be that minor degrees of change in mRNA levels are masked by tumor heterogeneity. Tumors are composed of a complex mix of neoplastic cells including various subclones. This intratumoral heterogeneity is added to by the presence of a variable component of nonneoplastic stromal and inflammatory cells, by areas of dead and dying cells, by variation in the level of nutrients and oxygen, and by variation in the degree of vascularization and in the levels of cytokines and other active biomolecules. All these factors have the potential to affect the level of expression of particular genes. Thus, tumor heterogeneity may be a source of possibly serious bias when quantifying RNA extracted from tissues. 25 The effects of tumor heterogeneity can be limited by analyzing several different areas of a tumor and by selecting tissue samples under microscopic control.
The improved PCR yield for MART-1 mRNA achieved by amplifying short sequences was seen not only in the fixed samples, but also when analyzing fresh-frozen tissue (Figure 5) . This may partly reflect a primer-related change in PCR efficiency. Alternatively, the longer amplicon size (497 bp) used initially for MART on frozen samples compared with β-actin (313 bp), may be more vulnerable to even minor degrees of degradation occurring within the first few minutes after surgical removal. The reliability of the molecular results obtained from real-time RT-PCR is dependent on the analytical precision of the detection methods used, but only a few studies have addressed this important point. We have determined the precision of the real-time RT-PCR method used for controls in the measuring range of our samples as well as in controls with mRNA levels ∼100-fold lower. In the range of the samples we find an acceptable imprecision for mRNA from both the β-actin and β2-M housekeeping genes with intra- and interassay variations of ∼10% and 20%, respectively. Even for MART-1 mRNA, which is quantified in a nested RT-PCR design there is an acceptable imprecision with 10% intra-assay and 26% interassay variation, levels comparable to the two household genes examined that support the contention, that the data for the nested products are quantitative. As expected, lowering the mRNA content of the controls ∼100-fold below the values of our samples resulted in an increase in the interassay imprecision to ∼30% for the household genes and ∼40% for MART-1.
Our findings confirm that clinical tumor specimens removed by routine surgical procedures and snap-frozen can be safely used for studies of gene expression. Although we cannot exclude the possibility that some particularly labile mRNAs may be preferentially lost immediately after removal, quantification of more stable transcripts relative to housekeeping gene mRNAs would seem to be possible even with relatively prolonged delays up to 24 hours before freezing or fixation of the tissue. Furthermore, by using highly sensitive real-time RT-PCR with amplification of short target sequences, mRNA for a variety of genes can be quantified in FFPE tissues. An important proviso to remember is that the amount of RNA that can be extracted from FFPE tissue represents only a minor part of that which is obtainable from fresh-frozen tissue and that the analytical imprecision is increased when the amount of amplifiable RNA available is small. Although variations in the time before tissue processing seem to be less important sources of imprecision, than previously assumed, variations in length of fixation may still be a problem for quantification. Normalizing results to reference genes seems to be mandatory for the reliability of the molecular results. Our model demonstrates a way to select the appropriate reference gene. Although it will be important to confirm these results in studies on other genes than those we have looked at, our findings open up the possibility of performing retrospective molecular profiling studies of archive tissues at the RNA level and using these techniques in a routine diagnostic setting.
Acknowledgments
We thank the Department of Plastic Surgery, Aarhus University Hospital, for their help in collecting the tissue.
Address reprint requests to Dr. Helene Nortvig Abrahamsen, Institute of Pathology, Aarhus University Hospital, Noerrebrogade 44, DK-8000 Aarhus C, Denmark. E-mail: abrahamsen@dadlnet.dk.
Footnotes
Supported by the Clinical Research Unit of the Danish Cancer Society; the Institute for Experimental Clinical Research, Aarhus University; the Danish Medical Society, Copenhagen; Fritz, Georg, and Marie Cecilie Glud’s Foundation; Max and Inge Wørzners Memorial Foundation; the Danish Medical Association, Højmosegårds Legate; and Forskningsinitiativet, County of Aarhus.
References
- 1.Bustin SA: Absolute quantification of mRNA using real-time reverse transcription polymerase chain reaction assays. J Mol Endocrinol 2000, 25:169-193 [DOI] [PubMed] [Google Scholar]
- 2.Foss RD, Guha-Thakurta N, Conran RM, Gutman P: Effects of fixative and fixation time on the extraction and polymerase chain reaction amplification of RNA from paraffin-embedded tissue. Comparison of two housekeeping gene mRNA controls. Diagn Mol Pathol 1994, 3:148-155 [DOI] [PubMed] [Google Scholar]
- 3.Masuda N, Ohnishi T, Kawamoto S, Monden M, Okubo K: Analysis of chemical modification of RNA from formalin-fixed samples and optimization of molecular biology applications for such samples. Nucleic Acids Res 1999, 27:4436-4443 [DOI] [PMC free article] [PubMed] [Google Scholar]
- 4.Krafft AE, Duncan BW, Bijwaard KE, Taubenberger JK, Lichy JH: Optimization of the isolation and amplification of RNA from formalin-fixed, paraffin-embedded tissue: the Armed Forces Institute of Pathology experience and literature review. Mol Diagn 1997, 2:217-230 [DOI] [PubMed] [Google Scholar]
- 5.Godfrey TE, Kim SH, Chavira M, Ruff DW, Warren RS, Gray JW, Jensen RH: Quantitative mRNA expression analysis from formalin-fixed, paraffin-embedded tissues using 5′ nuclease quantitative reverse transcription-polymerase chain reaction. J Mol Diagn 2000, 2:84-91 [DOI] [PMC free article] [PubMed] [Google Scholar]
- 6.Lehmann U, Bock O, Glockner S, Kreipe H: Quantitative molecular analysis of laser-microdissected paraffin-embedded human tissues. Pathobiology 2000, 68:202-208 [DOI] [PubMed] [Google Scholar]
- 7.Specht K, Richter T, Muller U, Walch A, Hofler MW: Quantitative gene expression analysis in microdissected archival tissue by real-time RT-PCR. J Mol Med 2000, 78:B27. [PubMed] [Google Scholar]
- 8.Bijwaard KE, Aguilera NS, Monczak Y, Trudel M, Taubenberger JK, Lichy JH: Quantitative real-time reverse transcription-PCR assay for cyclin D1 expression: utility in the diagnosis of mantle cell lymphoma. Clin Chem 2001, 47:195-201 [PubMed] [Google Scholar]
- 9.Sorensen BS, Schmidt H, von der Maase H, Straten PT, Nexo E: Quantification of melanoma cell-specific MART-1 mRNA in peripheral blood by a calibrated competitive reverse transcription-PCR. Clin Chem 2000, 46:1923-1928 [PubMed] [Google Scholar]
- 10.Christensen B, Kielr J, Vilien M, Don P, Wolf H: A classification of human urothelial cells propagated in vitro. Anticancer Res 1984, 4:319-337 [PubMed] [Google Scholar]
- 11.Rupp GM, Locker J: Purification and analysis of RNA from paraffin-embedded tissues. Biotechniques 1988, 6:56-60 [PubMed] [Google Scholar]
- 12.Jackson DP, Quirke P, Lewis F, Boylston AW, Sloan JM, Robertson D, Taylor GR: Detection of measles virus RNA in paraffin-embedded tissue. Lancet 1989, 1:1391. [DOI] [PubMed] [Google Scholar]
- 13.Lehmann U, Glockner S, Kleeberger W, Feist H, von Wasielewski R, Kreipe H: Detection of gene amplification in archival breast cancer specimens by laser-assisted microdissection and quantitative real-time polymerase chain reaction. Am J Pathol 2000, 156:1855-1864 [DOI] [PMC free article] [PubMed] [Google Scholar]
- 14.Florell SR, Coffin CM, Holden JA, Zimmermann JW, Gerwels JW, Summers BK, Jones DA, Leachman SA: Preservation of RNA for functional genomic studies: a multidisciplinary tumor bank protocol. Mod Pathol 2001, 14:116-128 [DOI] [PubMed] [Google Scholar]
- 15.Beelman CA, Parker R: Degradation of mRNA in eukaryotes. Cell 1993, 74:413-421 [DOI] [PubMed] [Google Scholar]
- 16.Guhaniyogi J, Brewer G: Regulation of mRNA stability in mammalian cells. Gene 2001, 265:11-23 [DOI] [PubMed] [Google Scholar]
- 17.Schramm M, Falkai P, Tepest R, Schneider-Axmann T, Przkora R, Waha A, Pietsch T, Bonte W, Bayer TA: Stability of RNA transcripts in post-mortem psychiatric brains. J Neural Transm 1999, 106:329-335 [DOI] [PubMed] [Google Scholar]
- 18.Yasojima K, McGeer EG, McGeer PL: High stability of mRNAs postmortem and protocols for their assessment by RT-PCR. Brain Res Brain Res Protoc 2001, 8:212-218 [DOI] [PubMed] [Google Scholar]
- 19.Johnson SA, Morgan DG, Finch CE: Extensive postmortem stability of RNA from rat and human brain. J Neurosci Res 1986, 16:267-280 [DOI] [PubMed] [Google Scholar]
- 20.Cummings TJ, Strum JC, Yoon LW, Szymanski MH, Hulette CM: Recovery and expression of messenger RNA from postmortem human brain tissue. Mod Pathol 2001, 14:1157-1161 [DOI] [PubMed] [Google Scholar]
- 21.Tong D, Schneeberger C, Leodolter S, Zeillinger R: Quantitative determination of gene expression by competitive reverse transcription-polymerase chain reaction in degraded RNA samples. Anal Biochem 1997, 251:173-177 [DOI] [PubMed] [Google Scholar]
- 22.Schmittgen TD, Zakrajsek BA: Effect of experimental treatment on housekeeping gene expression: validation by real-time, quantitative RT-PCR. J Biochem Biophys Methods 2000, 46:69-81 [DOI] [PubMed] [Google Scholar]
- 23.Goidin D, Mamessier A, Staquet MJ, Schmitt D, Berthier-Vergnes O: Ribosomal 18S RNA prevails over glyceraldehyde-3-phosphate dehydrogenase and beta-actin genes as internal standard for quantitative comparison of mRNA levels in invasive and noninvasive human melanoma cell subpopulations. Anal Biochem 2001, 295:17-21 [DOI] [PubMed] [Google Scholar]
- 24.Max N, Keilholz U: Minimal residual disease in melanoma. Semin Surg Oncol 2001, 20:319-328 [DOI] [PubMed] [Google Scholar]
- 25.Soderstrom M, Aro HT, Ahonen M, Johansson N, Aho A, Ekfors T, Bohling T, Kahari VM, Vuorio E: Expression of matrix metalloproteinases and tissue inhibitors of metalloproteinases in human chondrosarcomas. APMIS 2001, 109:305-315 [DOI] [PubMed] [Google Scholar]