Figure 2.

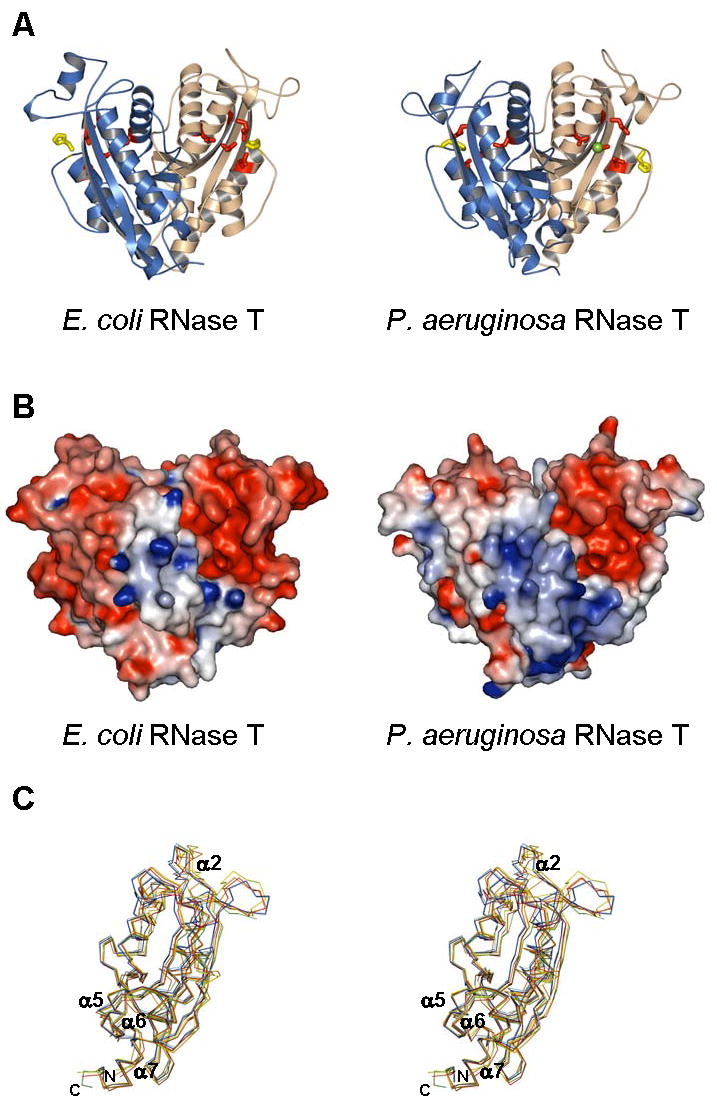
Crystal structure of E. coli and P. aeruginosa RNase T. (A). RNase T in a ribbon representation, with the two subunits in each dimer colored differently. Also shown are conserved DEDDh residues (sticks) and bound metal ions (balls). (B). Molecular surface of RNase T, colored by local electrostatic potential using GRASP (Nicholls et al., 1991). Red color indicates negative potential, blue color for positive potential, and both panels use similar scales for electrostatic shading. The larger “blue” patch in the P. aeruginosa RNase T reflects a larger number of basic residues in the NBS patch. (C) Comparison of RNT monomers. The two monomers of P. aeruginosa RNase T (PDB ID: 2F96) and the four monomers of E. coli RNase T (PDB ID: 2IS3) are superimposed, with only the Cα backbone shown. Each monomer is colored differently: cyan – 2F96 chain A, blue – 2F96 chain B, yellow – 2IS3 chain A, green – 2IS3 chain B, red – 2IS3 chain C, and orange – 2IS3 chain D.
