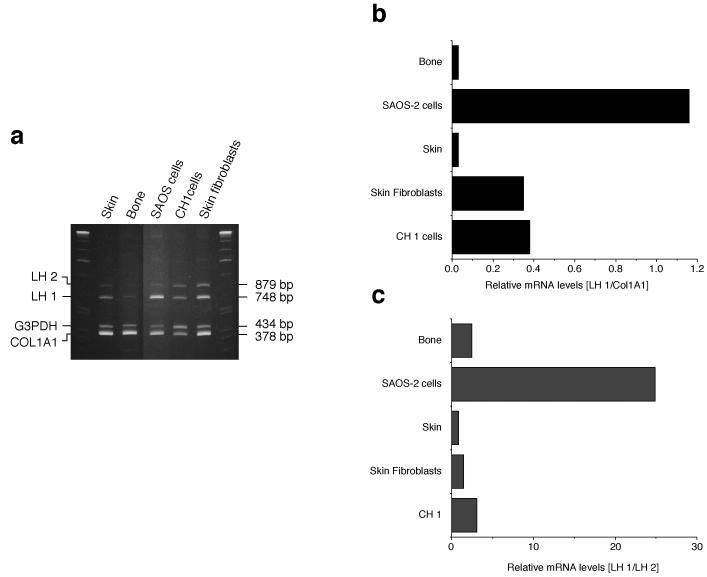
Figure 4.
Expression of lysyl hydroxylase mRNA
a) 6% polyacrylamide gels showing the ethidium bromide-stained RT-PCR (35 cycles) products of LH 1, LH2, G3PDH and COL1A1 from human skin, mature human osteoblasts, SAOS-2 cells, cultured human chondrosarcoma cells (CH1) and cultured skin fibroblasts.
b, c) A similar RT-PCR (25 cycles) experiment was performed after labelling with dCT32P to assess relative levels of LH1 message. For each tissue or cell culture, RNA was amplified and resolved on a 6% gel. Autoradiograghs were scanned to compare bands quantitatively. As shown in the bar graphs, regardless of the RNA chosen as reference (COL1A1 or LH2), LH1 mRNA was much higher (10 to 30 fold) in SAOS-2 cells than in osteoblasts, skin and cultured cells.

