Abstract
Vitamin E is a generic term for tocopherols and tocotrienols. The current work is based on our striking evidence that in neuronal cells nM concentrations of α-tocotrienol, but not α-tocopherol, blocked glutamate-induced death by suppressing early activation of c-Src kinase (J Biol Chem 275:13049). The present study on HT4 as well as immature primary cortical neurons suggests a central role of 12-lipoxygenase in executing glutamate-induced neurodegeneration. BL15, an inhibitor of 12-lipoxygenase, prevented glutamate-induced neurotoxicity. Moreover, neurons isolated from 12-lipoxygenase deficient mice were observed to be resistant to glutamate-induced death. In the presence of nM α-tocotrienol, neurons were resistant to glutamate, homocysteine as well as the L-buthionine sulfoximine induced toxicity. Long-term time-lapse imaging studies revealed neurons and their axodendritic network is fairly motile under standard culture conditions. Such motility is arrested in response to glutamate challenge. Tocotrienol-treated primary neurons maintained healthy growth and motility even in the presence of excess glutamate. The study of 12-lipoxygenase activity and metabolism revealed that this key mediator of glutamate-induced neurodegeneration is subject to control by the nutrient α-tocotrienol. In silico docking studies identified that α-tocotrienol may hinder the access of arachidonic acid to the catalytic site of 12-lipoxygenase by binding to the opening of a solvent cavity close to the active site. These findings lend further support to α-tocotrienol as a potent neuroprotective form of vitamin E.
Keywords: vitamin E, cell death, neuron, nutrition, signal transduction, antioxidant
Introduction
Vitamin E is a generic term for tocopherols and tocotrienols which qualitatively exhibit the biological activity of α-tocopherol (1). Compared to tocopherols, tocotrienols have been poorly studied (2,3). Tocotrienols differ from tocopherols by possessing a farnesyl (isoprenoid) rather than a saturated phytyl side chain. Dietary tocotrienols become incorporated into circulating human lipoproteins where they react with peroxyl radicals as efficiently as the corresponding tocopherol isomers (4,5). Indeed tocotrienol supplementation beneficially influences the course of carotid atherosclerosis in humans (6). Following supplementation to humans, the level of α-tocotrienol in the plasma has been estimated to be 1 μM (7). At concentrations 25–50 μM, α-tocopherol is known to regulate signal transduction pathways by mechanisms that are independent of its antioxidant properties (8,9). Micromolar amounts of tocotrienol, not tocopherol, have been shown to suppress the activity of hydroxy-3-methylglutaryl coenzyme A reductase (10,11). The unsaturated side chain of tocotrienol allows for more efficient penetration into tissues that have saturated fatty layers such as the brain and liver (12).
Glutamate toxicity is a major contributor to pathological cell death within the nervous system. There are two forms of glutamate toxicity: receptor-initiated excitotoxicity (13) and non-receptor-mediated toxicity (14). One established model (15,16) used to study oxidative stress related neuronal death is to inhibit cystine uptake by exposing cells to high levels of glutamate (17). Recently it has been validated that oxidative glutamate toxicity toward neurons lacking functional NMDA receptors can be a component of the excitotoxicity-initiated cell death pathway (15). This form of inducible neuronal death is referred to as oxytosis (18–20). The induction of oxidative stress by glutamate in this model has been demonstrated to be a primary cytotoxic mechanism in C6 glial cells (21–23), PC-12 neuronal cells (24,25), immature cortical neurons cells (17) and oligodendoglia cells (26).
The current work is based on our striking evidence that in HT neuronal cells nM concentrations of α-tocotrienol, but not α-tocopherol, blocked glutamate-induced death by suppressing glutamate-induced early activation of c-Src kinase (27). This function of α-tocotrienol was observed to be independent of its antioxidant property (27). The study presented first evidence showing that at amounts 4–10 fold lower than the levels of α−tocotrienol detected in plasma of human supplemented with the vitamin E molecule (7), α-tocotrienol has potent signal transduction regulatory properties that account for its neuroprotective function. Of importance, this striking property was exhibited by a nutrient known to be safe for human consumption. We sought to characterize the molecular mechanisms responsible for the potent neuroprotective property of trace amounts of tocotrienol. Results from the current line of investigation identified the 12-lipoxygenase (LOX) pathway as being sensitive to tocotrienol. While a major publication has identified 12-LOX as a critical facilitator of glutamate-induced cell death in HT neurons (16), we present first evidence demonstrating that the glutamate-induced 12-LOX activity is sensitive to nanomolar concentrations of tocotrienol. Additionally, in further support of the key role of 12-LOX in executing glutamate-induced neuronal death we show that 12-LOX deficient primary cortical neurons are resistant to glutamate challenge.
MATERIALS & METHODS
Materials
The following materials were obtained from the sources indicated. L-Glutamic acid monosodium salt; arachidonic acid; dimethyl sulfoxide; L-buthionine-[S,R]-sulfoximine; L-homocysteic acid (Sigma St. Louis, MO); baicalein; 5,6,7,-Trihydroxyflavone (BL15; Oxford Biomedical Research, Oxford, MI); α-tocotrienol (Carotech, Malaysia; BASF, Germany). For cell culture, Dulbecco’s Modified Eagle Medium, Minimum Essential Medium, fetal calf serum and penicillin and streptomycin (Gibco, Gaithersburg, MD); and culture dishes (Nunc, Denmark) were used.
Cell culture
Mouse hippocampal HT4 cells were grown in Dulbecco’s Modified Eagle Medium supplemented with 10% fetal calf serum, penicillin (100 U/ml) and streptomycin (100 μg/ml) at 37°C in a humidified atmosphere containing 95% air and 5% CO2. HT4 cells were provided by Dr. D. E. Koshland Jr. (University of California at Berkeley) (27).
Primary cortical neurons
Cells were isolated from the cerebral cortex of rat feti (Sprague Dawley; day 17 of gestation) or mouse feti (C57BL/6 mice, day 14 of gestation) as described (17). For the 12-LOX knockout studies, neurons were isolated from the feti of B6.129S2-Alox15tm1Fun mice (Jackson Laboratory, MI). After isolation from the brain, cells were counted and seeded in culture plates at a density of 2–3 x 10⁶ cells per 35 mm plate (17). Cells were grown in Minimal Essential Medium (MEM) supplemented with 10% heat-inactivated fetal bovine serum, 40 μM cystine and antibiotics (100 μg/ml streptomycin, 100 units/ml penicillin, 0.25 μg/ml amphotericin). Cultures were maintained at 37°C in 5% CO2 and 95% air in a humidified incubator. All experiments were carried out 24 h after plating.
Treatment with neurotoxic agents
Immediately before experiments, culture media was replaced with fresh medium that was supplemented with serum and antibiotics. Glutamate (10 mM) was added to the media as aqueous solution (23,27,28). No change in the medium pH was observed in response to the addition of glutamate. Other agents used to induce death in neuronal cells have been described in the pertinent figure legends.
Vitamin E treatment
Stock solutions (103X of working concentration) of α-tocotrienol was prepared in ethanol. Respective controls were treated with equal volume (0.1%, v/v) of ethanol. α−Tocotrienol was added to the culture dishes either 5 min before glutamate, or after the glutamate treatment as indicated in the respective figure legends.
Determination of cell viability
Viability of HT4 cells was determined using a propidium iodide exclusion assay and using the flow cytometer as described by us previously (27,28). Because primary neuronal cultures tend to aggregate during flow cytometry, the viability of these cells was assessed by measuring lactate dehydrogenase (LDH) leakage (23) from cells to media 24 h following glutamate treatment using in vitro toxicology assay kit from Sigma Chemical Co. (St. Louis, MO, USA). The protocol has been described in detail in a previous report (23). In brief, cell viability was determined using the following equation: viability = LDH activity of cells in monolayer/ total LDH activity (i.e., LDH activity of cells in monolayer + LDH activity of detached cells + LDH activity in the cell culture media).
12-Lipoxygenase expression
To over-express 12-LOX in HT4, cells were transiently transfected with plasmid pcDNA 3.1 12-LOX (ResGen, Invitrogen Corporation, Carlsbad, CA) or pcDNA 3.1 using Fugene 6 (Roche Molecular Biochemical, Indianapolis, IN) as per instructions from the manufacturer. To assess the level of 12-LOX expression, HT4 cells were harvested 24h after transfection and the protein concentrations were determined using BCA protein reagents. Samples (20μg of protein/lane) were separated on a NuPAGETM 4–12% Bis-Tris gel (Invitrogen Corporation, Carlsbad, CA) under reducing conditions, transferred to a PVDF membrane, and probed with 12-LOX polyclonal antiserum (Cayman chemicals, Ann Arbor, MI). To evaluate the loading efficiency, membranes were stripped and re-probed with anti-β actin antibody (Sigma St. Louis, MO).
Cytosol preparation
Cells (1.7X10⁶) were seeded on 140X20 mm plates. After 12–18h, cells were (2X plates per sample) washed with ice-cold PBS and harvested by scraping from the dishes. Samples were spun at 700 g (4°C, 5 minutes). Buffer (400 μl) containing 10mM HEPES, pH 7.8, 10mM KCl, 1mM, EDTA-Na2, 2mM MgCl2, 5% glycerol, 1 mM dithiothreitol, 1 mM phenylmethylsulfonyl fluoride, 5 μg/ml leupeptin, 5 μg/ml aprotinin and 5 μg/ml antipain was added to the cell pellet. Samples were re-suspened and kept on ice for 15 minutes. After 15 minutes 30μl of 10% NP40 was added to each sample and the samples were vortexed for 30 seconds. This was followed by centrifugation for 20 minutes at 14,000 g at 4°C. The supernatant cytosol was collected and kept in −80°C. The protein concentrations were determined using BCA protein reagents.
Total membrane preparation
Cells (1.7X10⁶) were seeded in 140X20 mm plates. After 12–18h cells (5 plates per sample) were harvested for total membrane preparation. Total membranes were prepared as described previously (29). After washing with ice-cold PBS, cells were harvested by scraping. Samples were spun at 700 g (4°C, 10 minutes). Buffer (10ml) containing 20mM HEPES-Na pH 7.4, 250mM sucrose, 2mM, EGTA, 1mM sodium azide, 100 μM phenylmethylsulfonyl fluoride, 1μM protease inhibitor cocktail (Sigma, St. Louis, MO) was added to the cell pellet. Samples were homogenized using a motor driven homogenizer (15 strokes) at 4°C. Samples were then spun at 760 g (4°C, 3 minutes). After centrifugation, the supernatant was collected and spun at 190,000 g (4°C, 1h). The resulting total membrane pellet was resuspened in the above-mentioned buffer and samples were stored at −80°C. The protein concentrations were determined using BCA protein reagents.
12-Lipoxygenase activity
To investigate whether tocotrienol directly affects the activity of 12-LOX (12-LOX), 10 units of 12-LOX (Biomol Research Labs Inc, Plymouth Meeting, PA) was incubated at room temperature for 15 min with or without tocotrienol as indicated in the respective figure legends. The reaction mixture contained 50 mM Tris-HCl, pH 7.4 and 1mM EDTA. After 15 min, the reaction was initiated by adding 25 μM [1-14 C]-arachidonic acid per sample. Samples were kept at 37° C for 30 minutes. The reaction was terminated by adding 200 μl of ice-cold stop solution containing diethyl ether, methanol and 1M citric acid at a ratio of 30:4:1 by volume. After mixing, the samples were centrifuged and the ethereal extracts were spotted on a silica gel thin layer plate. Thin layer chromatography was performed using a solvent system (diethyl ether, petroleum ether and acetic acid at a ratio of 85:15:0.1 v/v) for 45–60 min at −20°C. Distribution of radioactivity of the substrate and products on the plate were quantified using a imaging analyzer.
Glutathione assay
Glutathione (GSH) was detected using a HPLC-coulometric electrode array detector (Coularray Detector - model 5600 with 12 channels; ESA Inc., Chelmsford, MA). Sample preparation, mobile phase and column used for glutathione assay were as previously described (27). As an improvement to previously reported methods, the current method implemented a coulometric electrode array detector for the detection of glutathione (30). This system uses multiple channels with different redox-potentials. Glutathione was detected at channels set at the following potentials: I) 600 mV, II) 700 mV; and III) 800 mV. Signals from the channel set at 800 mV were used for quantification (31).
12-HETE detection
12-Hydroxy-eicosatetraenoic acid (HETE) from HT4 cells was detected using a HPLC-UV based method (32).
Immunofluorescence microscopy
For immunofluorescence microscopy, primary cultures of rat cortical neurons were plated on 35 mm plates pre-coated with poly-L-lysine. After 24h, cell were treated with α-tocotrienol or BL15 for 5 minutes and then challenged with glutamate or exposed to glutamate. After 24h of glutamate exposure, cells were washed thrice in PBS, fixed for 10 minutes at room temperature in 4% paraformaldehyde, and permeabilized with PBS-T (PBS containing 0.2% Triton X-100) for 20 minutes at room temperature. Samples were then rinsed 3X with PBS-T and blocking (2% BSA in PBS-T) was done for 1h at room temperature. After blocking, samples were incubated overnight at 4°C with the primary antibody {anti-neurofilament 200 (1:100, Sigma, St. Louis, MO) or neuronal class III β-tubulin (1:500, Covance Berkeley, CA)}. After washing with PBS (3X, 5 min each), the samples were incubated with Alexa Fluor 488 conjugated goat anti-mouse or anti-rabbit (Molecular Probes Eugene, OR) secondary antibody for 45 minutes at room temperature. This was followed by three PBS washes, and mounting in aqueous medium. Fluorescent images were collected using a Zeiss Axiovert 200M microscope. Images were acquired using Axiovision 3.1.
Live cell imaging
For live cell imaging primary cultures of rat cortical neurons were plated on 35 mm plates pre-coated with poly-L-lysine. Live cell imaging was performed for non-treated cells from 8h to 26h (18 h duration) of glutamate exposure because that is the time when morphological changes were most prominent. α-Tocotrienol treated cells were insensitive to glutamate. These cells were imaged from 26h–34h (8 h duration) after glutamate treatment to demonstrate a healthy growth pattern. Images were collected once every 15 minutes using a specialized phase contrast Zeiss optics suited for imaging cells growing in routine culture plates. The microscope was fitted with appropriate accessories to maintain the stage at 37°C and the gas environment comparable to that of the culture incubator. Images were exported to .avi video format using Axiovision 4.0.
12-Lipoxygenase model
Homology model construction was carried out on a Silicon Graphics O2 with 300MHz MIPS R5000, OS IRIX release 6.5. The theoretical model of 12-LOX was built using the Sybyl GeneFold module (v6.8, Tripos, Inc., St. Louis, MO). This module employs a BLAST search against the RSCB protein database (http://www.rcsb.org/pdb) to search for possible protein alignments. The module for identifying homologous proteins uses four scoring functions, which include sequence similarity, local interactions, burial similarity and secondary structure similarity. These properties are reflected in combination as an “alignment score”, with a score of 1,000 indicating a perfect alignment with regard to all scoring functions. The target sequence for platelet-type 12-LOX was taken from the NCBI protein database. A BLAST search indicated 97% sequence identity and an “alignment score” of 999.9 with soybean 1-LOX (PDB code 1YGE) (33), reflecting a similar folding pattern with the target sequence. The structure of 1YGE was used subsequently as a template protein for model building using the “backbone method” option in Sybyl. Molecular mechanics calculations were performed using the Tripos force field with a constant dielectric function (ε 2.0) and a non-bonded cutoff distance of 8.0Å. The final structure was energy minimized by a energy convergence gradient value of 0.05 kcal/mol after assigning Gasteiger-Hückel charges. The iron atom was then modeled into a theoretical model. Protein geometry was checked using PROCHECK (34) and was compared to the template protein structure 1YGE.
α-Tocotrienol docking to 12-lipoxygenase
Ligand binding studies were carried out using Autodock (v3.0.5) (35). Autodock is a compilation of three programs, Autotors, Autogrid and Autodock (36). Autotors facilitates the input of ligand co-ordinates, autogrid pre-calculates a three dimensional grid of interaction energy based on molecular coordinates and autodock performs docking simulations using a Lamarckian Genetic Algorithm. The ligand molecule, α-tocotrienol, was constructed using the Sybyl-Sketch Molecule option, energy minimized and assigned MOPAC charges. Docking was then carried out using standard settings and parameters in AutoDock. Figures for the theoretical model and the dockings were generated using MOLMOL (v2K.2) (MOLecule analysis and MOLecule display) software.
Data presentation
Data shown as bar graphs are mean ± SD. Students t test was used to test significance of difference between the means. p<0.05 was interpreted as significant difference between means.
RESULTS
Previously we have reported first evidence that nM concentrations of α−tocotrienol protect HT4 neurons from glutamate-induced death independent of its antioxidant property (27). To verify the general relevance of the observed neuroprotective effects of α−tocotrienol, experiments were conducted using primary neuronal cells. We observed that at nM concentrations, α−tocotrienol clearly protected immature neurons challenged with standard neurotoxins such as glutamate, L-homocysteic acid, L-buthionine-[S,R] sulfoximine (BSO) and a combination of BSO and arachidonic acid (Fig. 1A-C). Experiments with HT4 neurons challenged with glutamate revealed that nM levels of α−tocotrienol not only protected against loss of cell viability as reported earlier (27), but it preserved the normal growth rate of these cells in culture suggesting intact cell function (Fig. 1D). Challenging primary neurons with glutamate resulted in prominent disruption of the axodendritic neural network as evidenced by the staining of β-tubulin, neurofilament and by time-lapse phase-contrast microscopy (Fig. 2, a-l). Pre-treatment of cells with α-tocotrienol not only prevented glutamate-induced neurodegeneration but maintained neuronal growth in the face of 10 mM glutamate (Fig. 2, m-p). Protection against glutamate-induced structural alterations in the primary neuron was observed by time-lapse phase-contrast micrography (Fig. 2). We were able to successfully image neurons growing in standard culture plates without having to grow them on glass cover slips. The supplemented video demonstrates that under standard culture conditions neurons and their axodendritic network are fairly motile. This is prominently visible in the micrograph on tocotrienol treated cells where glutamate was ineffective in triggering neurotoxicity (Fig. 2, m-p). Time lapse imaging of glutamate treated control neurons reveal arrest in cytostructural movements before disruption of the network.
Figure 1. Protection against loss of neuronal viability by α-tocotrienol.
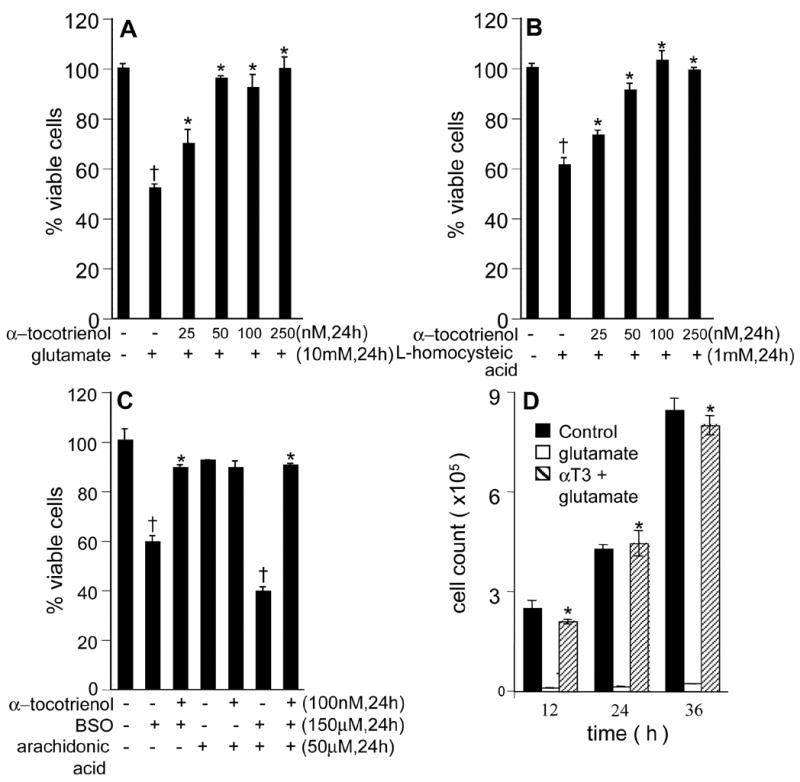
Primary rat immature cortical neurons (A-C) or HT4 (D) were either treated or not with α-tocotrienol (as indicated) for 5 min and challenged with either glutamate (10 mM; A); L-homocysteic acid (1 mM; B); or buthionine sulfoximine (0.15 mM; BSO) for 24 h. Arachidonic acid (0.05 mM, C) potentiated BSO-induced cell death. α-Tocotrienol conferred total protection against all of the above neurotoxins. D, 100 nM tocotrienol not only prevented glutamate-induced toxicity but allowed glutamate-treated cells to proliferate at a rate comparable to cells not treated with glutamate. Cells were counted at 12, 24 and 36 h after glutamate challenge. A: †, lower compared to control glutamate non-treated group; *, higher compared to glutamate-treated group. B: †, lower compared to control L-homocysteic acid non-treated group; *, higher compared to L-homocysteic acid-treated group. C: †, lower compared to corresponding control; *, higher compared to the corresponding group challenged with toxin(s). D: †, lower compared to the corresponding control non-treated group; *, higher compared to the corresponding glutamate-treated group. P<0.05.
Figure 2. Imaging of glutamate-induced degeneration of rat primary cortical neurons and protection by α-tocotrienol and BL15.
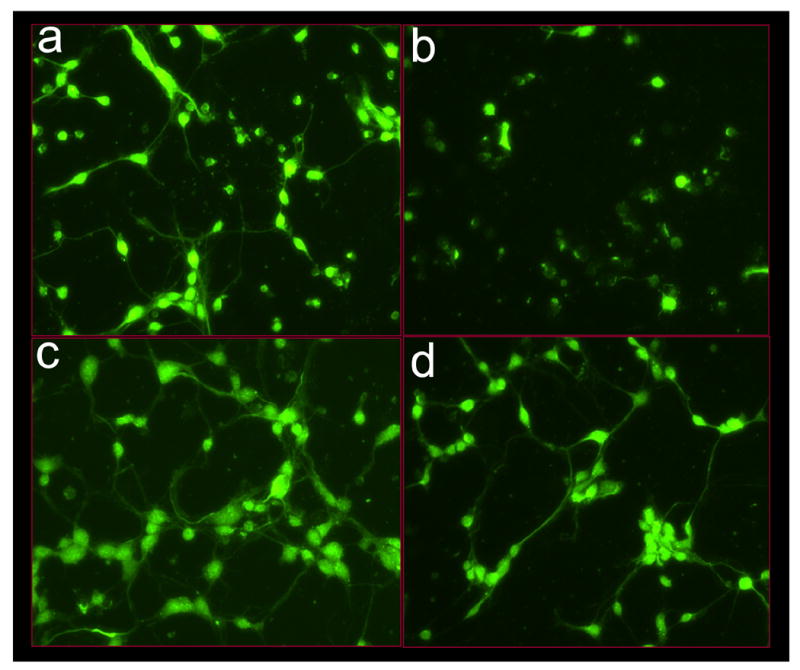
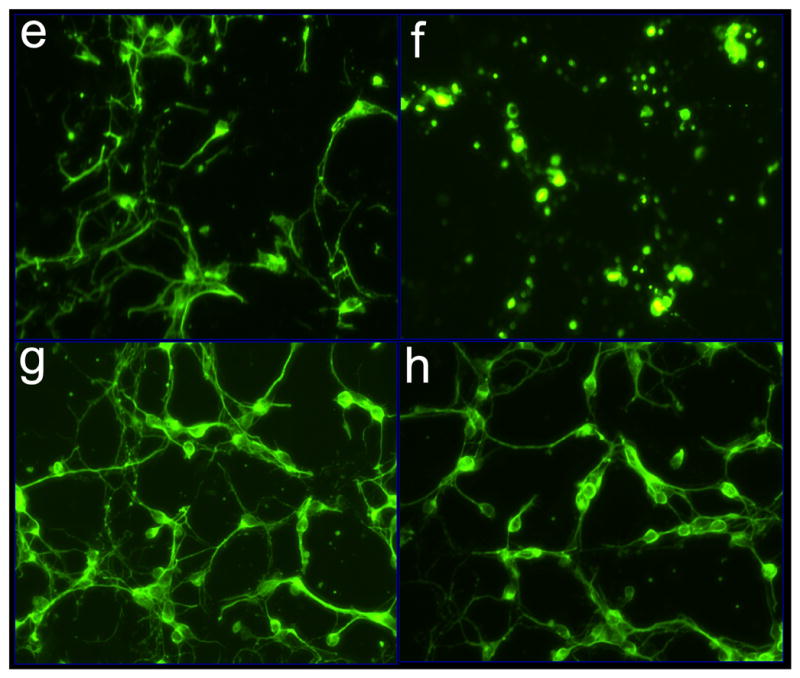
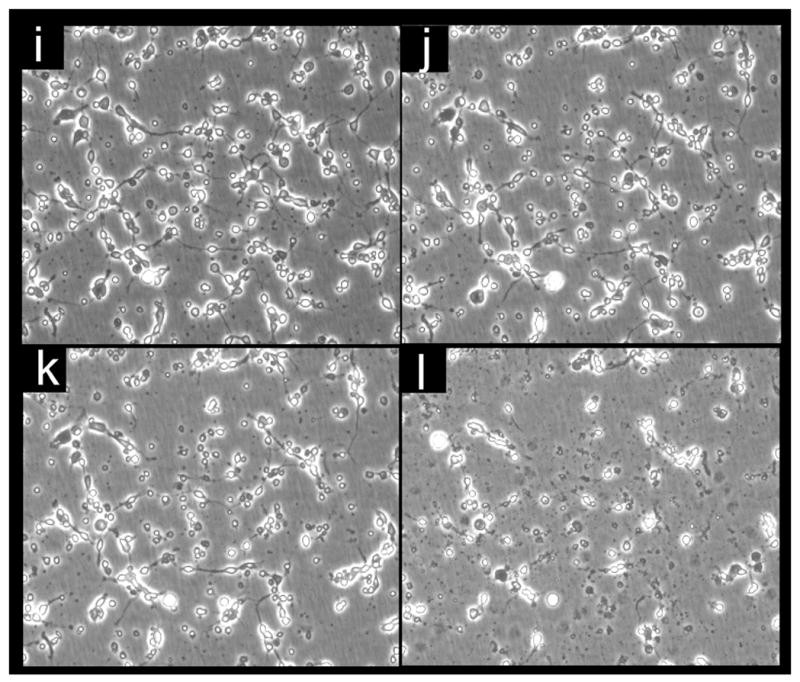
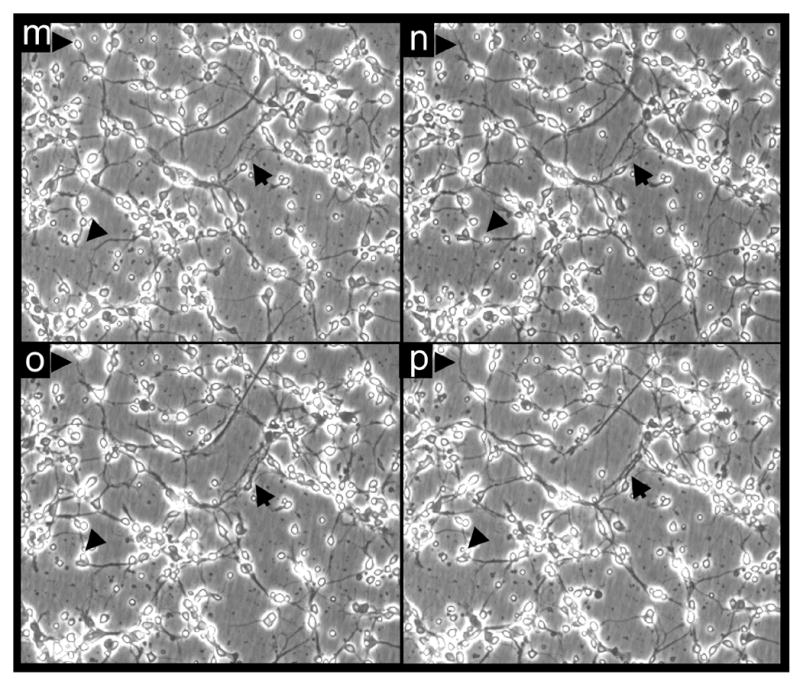
After 24h of seeding, cells were challenged with glutamate. Where indicated, neurons were pre-treated with either α-tocotrienol (250 nM) or BL15 (2.5 μM) for 5 min prior to glutamate treatment. a-h, Neuron specific Class III β-tubulin in the cultured neural network (for phase contrast microscopy see i-p). After 24h of glutamate treatment, cells were fixed and stained. a, control; b, glutamate; c, α-tocotrienol + glutamate; d, BL15+glutamate. e-h, Neurofilament staining in the cultured neural network (for phase contrast microscopy see i-p). e, control; f, glutamate; g, α-tocotrienol + glutamate; h, BL15+glutamate. i-p, Live cell imaging of glutamate treated neurons under standard ( not glass cover-slip) culture conditions. Phase contrast images were collected once every 15 mins for 18h from 8h after glutamate treatment. Frames illustrate time-dependent disintegration of the neural network. i, 8h; j, 12h; k, 16h; and l, 26h after glutamate treatment. Glutamate-challenged neurons pre-treated with α-tocotrienol (250 nM) resisted degeneration and continued to grow. m, 28h; n, 30h; o, 32h; and p, 34h after glutamate treatment. Two (i-l and m-p) .avi video micrographs have been supplemented for online publication. 200X magnification.
Vitamin E and its analogs are known to be potent inhibitors of 5-LOX (37). This effect is independent of the antioxidant property of vitamin E. Vitamin E is also known to inhibit 15-LOX activity by specifically complexing with the enzyme protein (38). A central role of inducible 12-LOX has been proposed in the execution of glutamate-induced neuronal death (16,20). Thus, we sought to examine whether vitamin E α−tocotrienol protects glutamate-induced neurodegeneration by inhibiting 12-LOX activity. First, we tested for the involvement of 12-LOX in the execution of glutamate-induced death in our model. We started by using the 12-LOX specific inhibitor baicalein or BL15. Pretreatment of cells with BL15 clearly protected against glutamate induced death of HT4 cells as well as that of primary neurons (Figs 3A&B). In addition, BL15 pretreatment protected primary neurons against toxicity triggered by L-homocysteic acid or BSO (Figs 3C&D). Previously we have reported that nM α−tocotrienol protects against glutamate-induced death of HT4 cells while not sparing glutamate-induced loss of cellular GSH (27). Comparably, BL15 dependent protection against the toxic effects of glutamate was associated with lowered GSH levels in glutamate-treated primary neurons (Fig. 3E). Although a few key papers have presented pharmacological evidence supporting that glutamate-induced 12-LOX activation plays a significant role in the execution of neuronal death, conclusive evidence is still missing. We present first evidence showing that neurons isolated from 12-LOX deficient mice are resistant to glutamate-induced death (Fig. 4). This striking finding reinforced our interest to test α−tocotrienol as an inhibitor of glutamate-inducible 12-LOX activity in neuronal cells. Using a HPLC-based analytical approach it was observed that the by-product of 12-LOX activity, 12(S)-HETE, was not detected in HT4 cells under basal culture conditions. Glutamate treatment significantly increased cellular 12(S)-HETE content. However, such increase was prevented in α−tocotrienol treated cells (Fig. 5). This line of observation led to the question whether over-expression of 12-LOX in HT4 cells would sensitize them to glutamate-induced cytotoxicity and whether α−tocotrienol could counter such toxicity. We observed that in HT4 cells, treatment with glutamate mobilized cytosolic 12-LOX protein to the cell membrane (Figs. 6A&B). We were successful in achieving a high level of over-expression in the HT4 neuronal cells (Fig. 6C). Such over-expression was associated with increased loss of cell viability by itself (not shown). As a result, we resorted to an alternative line of investigation to determine whether α−tocotrienol is capable of inhibiting 12-LOX activity. Thin layer chromatographic analysis of 12-LOX activity in the presence of [14C]-arachidonic acid revealed that α-tocotrienol dose-dependently inhibited the activity of the pure enzyme (Fig. 6D).
Figure 3. Pharmacologic inhibition of 12-lipoxygenase confers protection against glutamate-induced death of HT4 as well as primary immature cortical neurons (B-D).
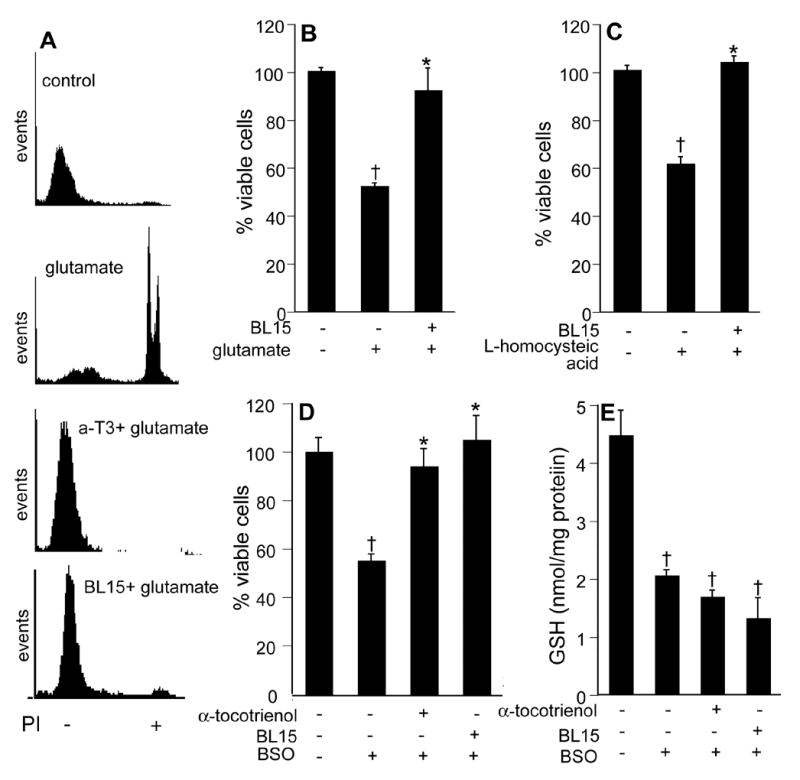
HT4 neurons (A) were either treated or not with α−tocotrienol (250 nM) or BL15 (2.5 μM, 12-lipoxygenase inhibitor) for 5 min and then challenged with glutamate (10 mM). Cell viability was determined using propidium iodide (PI) exclusion flow cytometry assay. PI- = live; PI+ = dead. Rat primary immature cortical neurons (B-D) were either treated or not with α-tocotrienol (100 nM) or BL15 (2.5 μM) for 5 min and challenged either with glutamate (10 mM; B); L-homocysteic acid (1 mM; C) or buthionine sulfoximine (0.15 mM; BSO; D) for 24 h. Arachidonic acid, 50 μM for 24h. BL15, Baicalein 5,6,7-trihydroxy-flavone. Both α-tocotrienol and BL15 protected neurons against glutamate challenge despite loss of cellular glutathione (GSH; E). B-E: †, lower compared to the corresponding control non-treated group; *, higher compared to the corresponding toxin-treated group. P<0.05.
Figure 4. Primary immature cortical neurons isolated from 12-lipoxygenase knock out mice are resistant to glutamate-induced death.
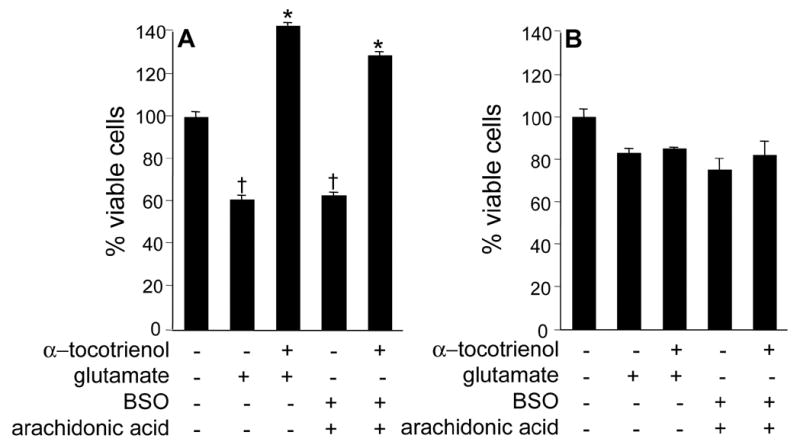
Murine primary immature cortical neuronal cells (C57BL/6, A; B6.129S2-Alox15 tm1Fun, B) were challenged with glutamate (10mM) for 24 h. Cell viability was assessed by lactate dehydrogenase assay. Treatment specifications are described in legend of Figure 1. α-tocotrienol, 100 nM. †, lower compared to the corresponding control non-treated group, also lower compared to corresponding group in 12-lipoxygenase deficient neurons; *, higher compared to the corresponding toxin-treated group. P<0.05.
Figure 5. Products of 12-lipoxygenase activity in glutamate-treated neurons.
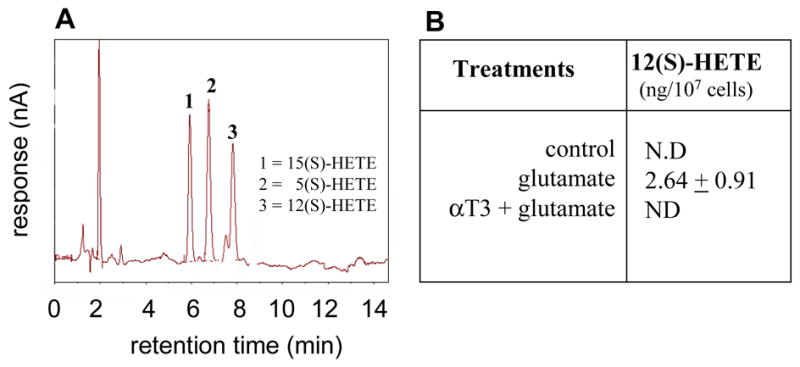
A, representative chromatogram for HETE, a key by-product of lipoxygenase activity. B, glutamate treatment for 12h resulted in elevation of 12(S)-HETE levels, a product of 12-lipoxygenase activity, in HT4 neurons. ND, not detectable.
Figure 6. 12-Lipoxygenase: over-expression, localization and sensitivity to α-tocotrienol.
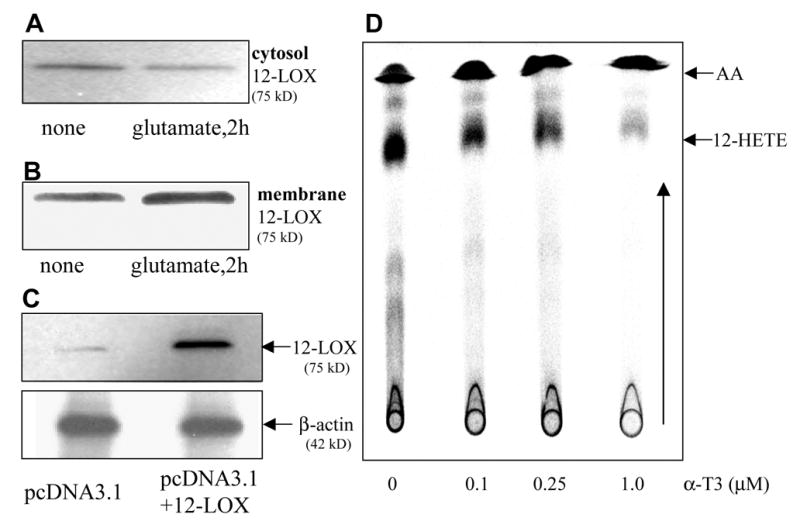
In HT4 cells, glutamate treatment for 2h resulted in diminished presence of 12-lipoxygenase in the cytosol (A) and increased presence in the membrane (B) suggesting mobilization of the enzyme from the cytosol to the membrane. C, successful over-expression of 12-lipoxygenase in HT4 cells. D, dose-dependent inhibition of pure 12-lipoxygenase activity by α-tocotrienol. Purified 12-lipoxygenase (porcine leukocyte; 10 units) was incubated with [14C]-arachidonic acid (25 μM) for 30 min at 37°C. Arachidonic acid and 12-HETE were resolved using thin layer chromatography as described in Materials & Methods.
The N-terminal domain of lipoxygenases is comprised of an eight-stranded antiparallel β-barrel and its molecular size varies with its genomic origin (mammalian or plant) (39). The description of size and structure for the theoretical model matches the crystal structure of 1YGE. In mammalian species, the protein C-terminus forms catalytic domain of the enzyme and consists of about 18–22 helices and one antiparallel β-barrel sheet. Two long central helices cross at the active site and include histidines for binding the iron ligand (39). These histidines were observed in our theoretical model at positions 360, 365 and 540 (Fig. 7A). The terminal isoleucine plays an important role in maintaining the size of active site cavity (40). The cavity for the iron atom can also be observed in the homology model. This is the center for dioxygenation reaction and substrate binding (41). There are 30 solvent cavities that can be observed in theoretical model, with highest cavity size of 124 Cu.Å, which is in the vicinity of the active site. The PROCHECK protein geometry assessment for the theoretical determined that 85% of the residues fall within the allowed region as compared to 88% for 1YGE. The other residues fall within the generously allowed region. Autodock calculates binding free energies for 10 different docking positions and sorted them in increasing order energy of binding (Fig. 7D). The docked energy is calculated from the free energy of binding and internal energy of ligand. The inhibition constant is subsequently correlated to the docked energy. We found that α-tocotrienol is concentrated at the opening of a solvent cavity close to the active site (Figs. 7B & C), thereby effectively blocking the entrance of the substrate for this enzyme, arachidonic acid.
Figure 7. Three-dimensional modeling of 12-lipoxygenase and α-tocotrienol docking analysis.
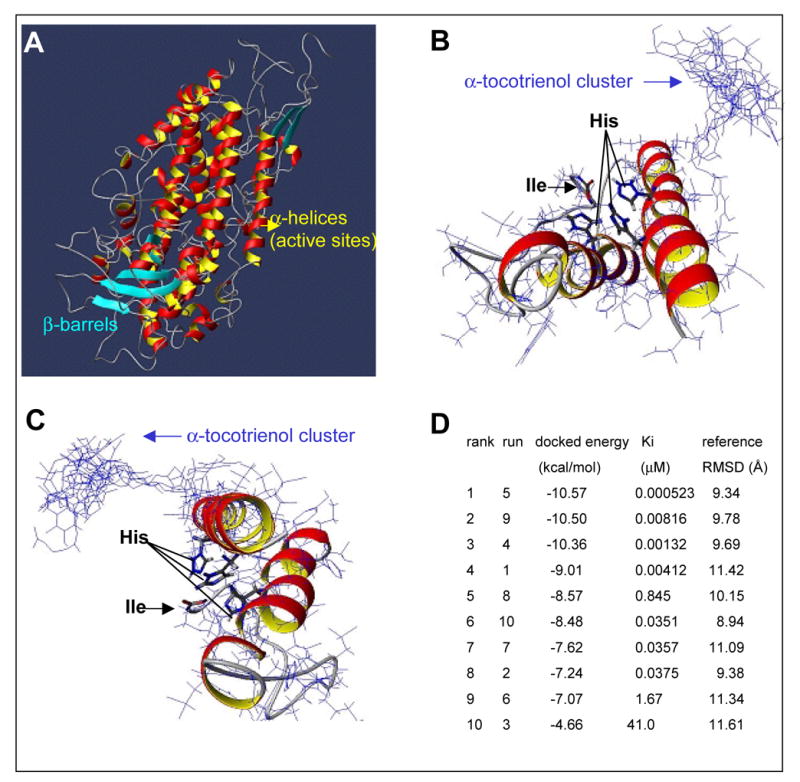
A, three-dimensionsal structure of 12-lipoxygenase. Homology model construction was carried out on a Silicon Graphics O2 with 300MHz MIPS R5000, OS IRIX release 6.5. The theoretical model of 12-lipoxygenase was built using the Sybyl GeneFold module (v6.8, Tripos, Inc., St. Louis, MO). B & C, Theoretical model and α-tocotrienol dockings (two positions B & C shown with 10 different docking positions). Amino acid residues in red are His-360, His-365, His-540 and Ile-663 flanking the iron atom are visualized in bold typeface. D, Autodock calculated binding free energies for 10 different docking positions and sorted in increasing order energy of binding. RMSD, root mean square deviation.
DISCUSSION
Vitamin E is essential for normal neurological function (42,43). One of the major objectives of the study of oxytosis of neurons is to understand the mechanisms underlying stroke related neurodegeneration (15,20). We have previously reported that α−tocotrienol represents a potent neuroprotective form of vitamin E that completely prevents oxytosis of HT4 neurons at nM concentrations. We characterized that inducible neuronal c-Src kinase was a key target of α−tocotrienol (27). In neurons and astrocytes, c-Src is present at 15–20 times higher levels than that found in fibroblasts. The specific activity of the c-Src protein from neuronal cultures is 6–12 times higher than that from astrocyte cultures suggesting key function of this protein in neurons (44). However, the potential role of c-Src in brain pathophysiology remains unknown. Our results proved that glutamate-induced c-Src activation represented a major checkpoint in oxytosis of HT4 cells (27). A subsequent study confirmed in vivo that Src deficiency or blockade of Src activity in mice provides cerebral protection following stroke (45). Our current findings demonstrate that the potent neuroprotective properties of α−tocotrienol are not limited to HT4 cells but apply to primary cortical neurons as well. GSH is a key survival factor in cells of the nervous system and lowered [GSH]i is one of the early markers of neurotoxicity induced by a variety of agonists (46,47). We observed that α−tocotrienol clearly protects primary cortical neurons against a number of GSH-lowering neurotoxins. Of interest, the neurons survived even in the face of GSH loss. These observations leads to the hypothesis that loss of [GSH]i alone is not lethal. Given that pro-GSH agents are known to be neuroprotective in a variety of scenarios (23,47,48) it becomes reasonable to hypothesize that glutamate-induced lowering of [GSH]i triggers downstream responses that execute cell death. Indeed it has been demonstrated that the lowering of neuronal [GSH]i triggers the activation of neuronal 12-LOX, which leads to the production of peroxides, the influx of Ca2+, and ultimately to cell death (16). We report that specific inhibition of 12-LOX by BL15 protects neurons from glutamate-induced degeneration although [GSH]i is compromised by 80%. Similar protective effects of BL15 was noted when BSO, a specific inhibitor of GSH synthesis, was used as the agonist. These lines of observation suggested a critical role of 12-LOX in mediating neurodegeneration caused by GSH-lowering agents such as glutamate. Most of the results supporting the contention were, however, derived from studied using pharmacological inhibitors that are likely to have non-specific effects. Our current results demonstrate that neurons isolated from mice lacking the 12-LOX gene are resistant to glutamate-induced loss of viability. This constitutes a key piece of evidence establishing that indeed 12-LOX represents a critical checkpoint in glutamate-induced neurodegeneration.
Understanding of the intracellular regulation of 12-LOX requires knowledge of the distribution of both enzyme protein and its activity. For example, in human erythroleukemia cells, the membrane fraction contains about 90% of the total cellular 12-LOX activity, whereas only 10% of 12-LOX activity resides in the cytosol. However, the majority of cellular 12-LOX protein is found in the cytosol (49). Upon activation, 12-LOX has been suggested to translocate to the membrane (49). Consistently, we have observed the decreased presence of 12-LOX in the cytosol and increased presence in the membrane of glutamate-treated cells. For 5-LOX, both catalytic function and translocation of the enzyme from the cytosol to the membrane are known to be regulated by tyrosine kinases (50). Although we have demonstrated that α−tocotrienol specifically modulates tyrosine phosphorylation in glutamate-treated neurons (27), the role of such kinases in the translocation of 12-LOX remains to be tested.
Neurons of the central nervous system are rich in arachidonic acid, n-6 20:4 polyunsaturated fatty acid. Lipoxygenases, mainly 5-, 12- and 15-LOX, are named for their ability to insert molecular oxygen at the 5, 12, or 15-carbon atom of arachidonic acid forming a distinct hydroperoxy-eicosatetraenoic (HPETE) acid (51). 12-LOX produces 12(S)-HPETE which is further metabolized into four distinct products: an alcohol [12(S)-HETE], a ketone (12-ketoeicosatetraenoic acid), or two epoxy alcohols (hepoxilin A3 and B3). Immunohistochemical studies revealed the occurrence of 12-LOX in neurons; particularly in hippocampus, striatum, olivary nucleus, as well as in glial and in cerebral endothelial cells (52,53). Using immature cortical neurons and HT cells, it has been shown that a decrease in [GSH]i triggers the activation of neuronal 12-LOX, which leads to the production of peroxides, the influx of Ca2+, and ultimately to cell death (16,20). Sensitivity of lipoxygenases to vitamin E has been previously reported. α-Tocopherol has been shown to strongly inhibit purified 5-LOX with a IC50 of 5 μM. The inhibition is independent of the antioxidant property of tocopherol. Tryptic digestion and peptide mapping of the 5-LOX-tocopherol complex indicated that tocopherol binds strongly to a single peptide (37). Another study reported inhibition of 15-LOX by tocopherol via specific interaction with the enzyme protein (38). Of interest, inhibitors specific for cycloxygenase or 5-LOX are not effective in protecting neuronal cells against glutamate-induced death suggesting a specific role of 12-LOX in glutamate-induced death (16). Our studies addressing the effect of α-tocotrienol on pure 12-LOX suggest the possibility that α−tocotrienol directly interacts with the enzyme to suppress arachidonic acid metabolism. In silico studies examining possible docking sites of α−tocotrienol to 12-LOX support the presence of a α-tocotrienol binding solvent cavity close to the active site. Previously it has been demonstrated in 15-LOX that COOH terminal of arachidonic acid enters this solvent cavity while accessing the catalytic site (40). It is therefore plausible that the binding position of α-tocotrienol prevents access of the natural substrate arachidonic acid to the active site of 12-LOX.
Taken together, at concentrations well within the physiologically relevant range, α−tocotrienol exhibits potent neuroprotective properties in HT4 as well as immature primary cortical neurons. Current results confirm a central role of 12-LOX in executing glutamate-induced oxidative toxicity of neurons and offer α−tocotrienol as a promising tool in nutrition-based therapeutics.
Supplementary Material and Methods
.avi file of 73 frames collected once every 15 mins for 18h. Exported to .avi format at 300 msec per frame. Total length 21.9 secs; Compatible with MS-Windows media player.
.avi file of 33 frames collected once every 15 mins for 18h. Exported to .avi format at 300 msec per frame. Total length 9.9 secs; Compatible with MS-Windows media player.
Acknowledgments
Supported by NIH-NINDS NS42617 to CKS. Modeling studies were additionally supported by NIDDK 56631 to PWS.
Contributor Information
Savita Khanna, Laboratory of Molecular Medicine, Department of Surgery, Dorothy M. Davis Heart and Lung Research Institute, The Ohio State University Medical Center, Columbus, OH 43210.
Sashwati Roy, Laboratory of Molecular Medicine, Department of Surgery, Dorothy M. Davis Heart and Lung Research Institute, The Ohio State University Medical Center, Columbus, OH 43210.
Hoon Ryu, Department of Neurology, Harvard Medical School and The Beth Israel Deaconess Medical Center, Boston, MA 02115..
Praveen Bahadduri, Bioinformatics and Computational Biology Core Laboratory, Dorothy M. Davis Heart and Lung Research Institute, The Ohio State University Medical Center, Columbus, OH 43210.
Peter W. Swaan, Bioinformatics and Computational Biology Core Laboratory, Dorothy M. Davis Heart and Lung Research Institute, The Ohio State University Medical Center, Columbus, OH 43210
Rajiv R. Ratan, Department of Neurology, Harvard Medical School and The Beth Israel Deaconess Medical Center, Boston, MA 02115.
Chandan K. Sen, Laboratory of Molecular Medicine, Department of Surgery, Dorothy M. Davis Heart and Lung Research Institute, The Ohio State University Medical Center, Columbus, OH 43210
References
- 1.Brigelius-Flohe R, Traber MG. FASEB Journal. 1999;13:1145–1155. [PubMed] [Google Scholar]
- 2.Traber MG, Sies H. Annu Rev Nutr. 1996;16:321–347. doi: 10.1146/annurev.nu.16.070196.001541. [DOI] [PubMed] [Google Scholar]
- 3.Traber MG, Packer L. Am J Clin Nutr. 1995;62:1501S–1509S. doi: 10.1093/ajcn/62.6.1501S. [DOI] [PubMed] [Google Scholar]
- 4.Serbinova EA, Packer L. Methods in Enzymology. 1994;234:354–366. doi: 10.1016/0076-6879(94)34105-2. [DOI] [PubMed] [Google Scholar]
- 5.Suarna C, Hood RL, Dean RT, Stocker R. Biochimica et Biophysica Acta. 1993;1166:163–170. doi: 10.1016/0005-2760(93)90092-n. [DOI] [PubMed] [Google Scholar]
- 6.Tomeo AC, Geller M, Watkins TR, Gapor A, Bierenbaum ML. Lipids. 1995;30:1179–1183. doi: 10.1007/BF02536621. [DOI] [PubMed] [Google Scholar]
- 7.O'Byrne D, Grundy S, Packer L, Devaraj S, Baldenius K, Hoppe PP, Kraemer K, Jialal I, Traber MG. Free Radical Biology & Medicine. 2000;29:834–845. doi: 10.1016/s0891-5849(00)00371-3. [DOI] [PubMed] [Google Scholar]
- 8.Azzi A, Boscoboinik D, Marilley D, Ozer NK, Stauble B, Tasinato A. Am J Clin Nutr. 1995;62:1337S–1346S. doi: 10.1093/ajcn/62.6.1337S. [DOI] [PubMed] [Google Scholar]
- 9.Boscoboinik DO, Chatelain E, Bartoli GM, Stauble B, Azzi A. Biochim Biophys Acta. 1994;1224:418–426. doi: 10.1016/0167-4889(94)90277-1. [DOI] [PubMed] [Google Scholar]
- 10.Pearce BC, Parker RA, Deason ME, Dischino DD, Gillespie E, Qureshi AA, Volk K, Wright JJ. Journal of Medicinal Chemistry. 1994;37:526–541. doi: 10.1021/jm00030a012. [DOI] [PubMed] [Google Scholar]
- 11.Pearce BC, Parker RA, Deason ME, Qureshi AA, Wright JJ. Journal of Medicinal Chemistry. 1992;35:3595–3606. doi: 10.1021/jm00098a002. [DOI] [PubMed] [Google Scholar]
- 12.Suzuki YJ, Tsuchiya M, Wassall SR, Choo YM, Govil G, Kagan VE, Packer L. Biochemistry. 1993;32:10692–10699. doi: 10.1021/bi00091a020. [DOI] [PubMed] [Google Scholar]
- 13.Choi DW. Cerebrovasc Brain Metab Rev. 1990;2:105–147. [PubMed] [Google Scholar]
- 14.Tan S, Sagara Y, Liu Y, Maher P, Schubert D. J Cell Biol. 1998;141:1423–1432. doi: 10.1083/jcb.141.6.1423. [DOI] [PMC free article] [PubMed] [Google Scholar]
- 15.Schubert D, Piasecki D. Journal of Neuroscience. 2001;21:7455–7462. doi: 10.1523/JNEUROSCI.21-19-07455.2001. [DOI] [PMC free article] [PubMed] [Google Scholar]
- 16.Li Y, Maher P, Schubert D. Neuron. 1997;19:453–463. doi: 10.1016/s0896-6273(00)80953-8. [DOI] [PubMed] [Google Scholar]
- 17.Murphy TH, Schnaar RL, Coyle JT. Faseb J. 1990;4:1624–1633. [PubMed] [Google Scholar]
- 18.Sagara Y, Ishige K, Tsai C, Maher P. Journal of Biological Chemistry. 2002;277:36204–36215. doi: 10.1074/jbc.M203895200. [DOI] [PubMed] [Google Scholar]
- 19.Dargusch R, Schubert D. Journal of Neurochemistry. 2002;81:1394–1400. doi: 10.1046/j.1471-4159.2002.00950.x. [DOI] [PubMed] [Google Scholar]
- 20.Tan S, Schubert D, Maher P. Current Topics in Medicinal Chemistry. 2001;1:497–506. doi: 10.2174/1568026013394741. [DOI] [PubMed] [Google Scholar]
- 21.Kato S, Negishi K, Mawatari K, Kuo CH. Neuroscience. 1992;48:903–914. doi: 10.1016/0306-4522(92)90278-a. [DOI] [PubMed] [Google Scholar]
- 22.Han D, Handelman G, Marcocci L, Sen CK, Roy S, Kobuchi H, Tritschler HJ, Flohe L, Packer L. Biofactors. 1997;6:321–338. doi: 10.1002/biof.5520060303. [DOI] [PubMed] [Google Scholar]
- 23.Han D, Sen CK, Roy S, Kobayashi MS, Tritschler HJ, Packer L. American Journal of Physiology. 1997;273:R1771–1778. doi: 10.1152/ajpregu.1997.273.5.R1771. [DOI] [PubMed] [Google Scholar]
- 24.Froissard P, Monrocq H, Duval D. Eur J Pharmacol. 1997;326:93–99. doi: 10.1016/s0014-2999(97)00155-6. [DOI] [PubMed] [Google Scholar]
- 25.Pereira CM, Oliveira CR. Free Radic Biol Med. 1997;23:637–647. doi: 10.1016/s0891-5849(97)00020-8. [DOI] [PubMed] [Google Scholar]
- 26.Oka A, Belliveau MJ, Rosenberg PA, Volpe JJ. J Neurosci. 1993;13:1441–1453. doi: 10.1523/JNEUROSCI.13-04-01441.1993. [DOI] [PMC free article] [PubMed] [Google Scholar]
- 27.Sen CK, Khanna S, Roy S, Packer L. Journal of Biological Chemistry. 2000;275:13049–13055. doi: 10.1074/jbc.275.17.13049. [DOI] [PubMed] [Google Scholar]
- 28.Tirosh O, Sen CK, Roy S, Packer L. Neuroscience. 2000;97:531–541. doi: 10.1016/s0306-4522(00)00028-2. [DOI] [PubMed] [Google Scholar]
- 29.Bashan N, Burdett E, Hundal HS, Klip A. American Journal of Physiology. 1992;262:C682–690. doi: 10.1152/ajpcell.1992.262.3.C682. [DOI] [PubMed] [Google Scholar]
- 30.Roy S, Venojarvi M, Khanna S, Sen CK. Methods in Enzymology. 2002;352:326–332. doi: 10.1016/s0076-6879(02)52029-2. [DOI] [PubMed] [Google Scholar]
- 31.Sen CK, Khanna S, Babior BM, Hunt TK, Ellison EC, Roy S. Journal of Biological Chemistry. 2002;277:33284–33290. doi: 10.1074/jbc.M203391200. [DOI] [PubMed] [Google Scholar]
- 32.Eberhard J, Jepsen S, Albers HK, Acil Y. Anal Biochem. 2000;280:258–263. doi: 10.1006/abio.2000.4540. [DOI] [PubMed] [Google Scholar]
- 33.Bernstein FC, Koetzle TF, Williams GJ, Meyer EF, Jr, Brice MD, Rodgers JR, Kennard O, Shimanouchi T, Tasumi M. Eur J Biochem. 1977;80:319–324. doi: 10.1111/j.1432-1033.1977.tb11885.x. [DOI] [PubMed] [Google Scholar]
- 34.Laskowski R, MacArthur MW, Moss DS, Thornton JM. J Appl Cryst. 1993;26:283–291. [Google Scholar]
- 35.Morris GM, Goodsell DS, Halliday RS, Huey R, Hart WE, Belew RK, Olson AJ. Reference manual. Release version 3.0.5. 2001. [Google Scholar]
- 36.Goodsell DS, Morris GM, Olson AJ. J Mol Recognit. 1996;9:1–5. doi: 10.1002/(sici)1099-1352(199601)9:1<1::aid-jmr241>3.0.co;2-6. [DOI] [PubMed] [Google Scholar]
- 37.Reddanna P, Rao MK, Reddy CC. FEBS Letters. 1985;193:39–43. doi: 10.1016/0014-5793(85)80075-2. [DOI] [PubMed] [Google Scholar]
- 38.Grossman S, Waksman EG. International Journal of Biochemistry. 1984;16:281–289. doi: 10.1016/0020-711x(84)90101-0. [DOI] [PubMed] [Google Scholar]
- 39.Minor W, Steczko J, Stec B, Otwinowski Z, Bolin JT, Walter R, Axelrod B. Biochemistry. 1996;35:10687–10701. doi: 10.1021/bi960576u. [DOI] [PubMed] [Google Scholar]
- 40.Borngraber S, Browner M, Gillmor S, Gerth C, Anton M, Fletterick R, Kuhn H. J Biol Chem. 1999;274:37345–37350. doi: 10.1074/jbc.274.52.37345. [DOI] [PubMed] [Google Scholar]
- 41.Gillmor SA, Villasenor A, Fletterick R, Sigal E, Browner MF. Nat Struct Biol. 1997;4:1003–1009. doi: 10.1038/nsb1297-1003. [DOI] [PubMed] [Google Scholar]
- 42.Muller DP, Goss-Sampson MA. Annals of the New York Academy of Sciences. 1989;570:146–155. doi: 10.1111/j.1749-6632.1989.tb14915.x. [DOI] [PubMed] [Google Scholar]
- 43.Muller DP, Goss-Sampson MA. Critical Reviews in Neurobiology. 1990;5:239–263. [PubMed] [Google Scholar]
- 44.Brugge JS, Cotton PC, Queral AE, Barrett JN, Nonner D, Keane RW. Nature. 1985;316:554–557. doi: 10.1038/316554a0. [DOI] [PubMed] [Google Scholar]
- 45.Paul R, Zhang ZG, Eliceiri BP, Jiang Q, Boccia AD, Zhang RL, Chopp M, Cheresh DA. Nature Medicine. 2001;7:222–227. doi: 10.1038/84675. [DOI] [PubMed] [Google Scholar]
- 46.Dringen R, Gutterer JM, Hirrlinger J. European Journal of Biochemistry. 2000;267:4912–4916. doi: 10.1046/j.1432-1327.2000.01597.x. [DOI] [PubMed] [Google Scholar]
- 47.Bains JS, Shaw CA. Brain Research - Brain Research Reviews. 1997;25:335–358. doi: 10.1016/s0165-0173(97)00045-3. [DOI] [PubMed] [Google Scholar]
- 48.Schulz JB, Lindenau J, Seyfried J, Dichgans J. European Journal of Biochemistry. 2000;267:4904–4911. doi: 10.1046/j.1432-1327.2000.01595.x. [DOI] [PubMed] [Google Scholar]
- 49.Hagmann W, Kagawa D, Renaud C, Honn KV. Prostaglandins. 1993;46:471–477. doi: 10.1016/0090-6980(93)90066-g. [DOI] [PubMed] [Google Scholar]
- 50.Lepley RA, Muskardin DT, Fitzpatrick FA. Journal of Biological Chemistry. 1996;271:6179–6184. doi: 10.1074/jbc.271.11.6179. [DOI] [PubMed] [Google Scholar]
- 51.Yamamoto S. Biochimica et Biophysica Acta. 1992;1128:117–131. doi: 10.1016/0005-2760(92)90297-9. [DOI] [PubMed] [Google Scholar]
- 52.Nishiyama M, Watanabe T, Ueda N, Tsukamoto H, Watanabe K. Journal of Histochemistry & Cytochemistry. 1993;41:111–117. doi: 10.1177/41.1.8417106. [DOI] [PubMed] [Google Scholar]
- 53.Nishiyama M, Okamoto H, Watanabe T, Hori T, Hada T, Ueda N, Yamamoto S, Tsukamoto H, Watanabe K, Kirino T. Journal of Neurochemistry. 1992;58:1395–1400. doi: 10.1111/j.1471-4159.1992.tb11355.x. [DOI] [PubMed] [Google Scholar]
Associated Data
This section collects any data citations, data availability statements, or supplementary materials included in this article.
Supplementary Materials
.avi file of 73 frames collected once every 15 mins for 18h. Exported to .avi format at 300 msec per frame. Total length 21.9 secs; Compatible with MS-Windows media player.
.avi file of 33 frames collected once every 15 mins for 18h. Exported to .avi format at 300 msec per frame. Total length 9.9 secs; Compatible with MS-Windows media player.


