

Abstract
Quantification of residual disease by real-time polymerase chain reaction (PCR) will become a pivotal tool in the development of patient-directed therapy. In recent years, various protocols to quantify minimal residual disease in leukemia or lymphoma patients have been developed. These assays assume that PCR efficiencies are equal for all samples. Determining t(14;18) and albumin reaction efficiencies for sixteen follicular lymphoma patient samples revealed higher efficiencies for blood samples than for lymph node samples in general. However, within one sample both reactions had equivalent efficiencies. Differences in amplification efficiencies between patient samples (low efficiencies) and the calibrator in quantitative analyses result in the underestimation of residual disease in patient samples whereby the weakest positive patient samples are at highest error. Based on these findings for patient samples, the efficiency compensation control was developed. This control includes two reference reactions in a multiplex setting, specific for the β-actin and albumin housekeeping genes that are present in a constant ratio within DNA templates. The difference in threshold cycle values for both reference reactions, ie, the ΔCt2 value, is dependent on the amplification efficiency, and is used to compensate for efficiency differences between patient samples and the calibrator. The β-actin reference reaction is also used to normalize for DNA input. Furthermore, the efficiency compensation control facilitates identification of patient samples that are so contaminated with PCR inhibitory compounds that different amplification reactions are affected to a different extent. Accurate quantitation of residual disease in these samples is therefore impossible with the current quantitative real-time PCR protocols. Identification and exclusion of these inadequate samples will be of utmost importance in quantitative retrospective studies, but even more so, in future molecular diagnostic analyses.
Disease-associated chromosomal markers facilitate specific detection of malignant cells in patient tissues and fluids, and have proved useful for diagnostic and prognostic purposes. By means of the polymerase chain reaction (PCR), malignant cells can be detected to a sensitivity limit of about a single malignant cell in a background of 105 to 106 normal cells. 1 Monitoring the number of residual malignant cells during the course of disease may predict for early relapse, preceding apparent clinical manifestation, and may verify the efficacy of treatment regimens. 2, 3, 4 Monitoring by quantitative PCR (QPCR) may become a fundamental tool to support patient directed treatment in future, at least for certain types of malignancies. Various QPCR analyses based on competitive PCR strategies have been developed in the past. 5, 6, 7, 8 However, the use of these assays is frequently hampered by a high risk for contamination and the labor-intensiveness of the technique. Real-time PCR 9, 10 based on Taqman chemistry 11, 12 has innovated PCR technology, allowing faster analysis of patient samples in a closed system, thereby lowering the risk of contamination. The use of an internal fluorescent probe warrants the specificity of the reaction and allows for the determination of sample positivity within the exponential phase of the reaction.
Various quantitative real-time PCR and RT-PCR protocols have recently been developed for the detection of disease associated chromosomal translocations, 13, 14, 15, 16 or disease-associated T cell receptor or Ig gene rearrangements. 17, 18 All protocols developed thus far are based on the assumption that patient samples and calibration samples have equal efficiencies during amplification. At least for the amplification of genomic DNA templates this assumption may not be true, since many patient samples seem contaminated with PCR inhibiting compounds. It is exactly for this reason that competitive PCRs have been developed in the past. 5, 6, 7, 8 Factors like DNA fragmentation, 19 residual RNA in DNA preparations, 20 the presence of PCR inhibiting compounds like residual anti-coagulant heparin 21 or proteinase K-digested heme compounds like hemoglobin 22 or myoglobin 23 will negatively affect PCR efficiency.
In this report, we demonstrate that the amplification efficiency for different DNA templates isolated from whole blood or bone marrow samples is subject to extensive variation, leading to underestimation of minimal residual disease or false negative result in quantitative PCR analyses. We developed a general real-time PCR control, ie, the efficiency compensation control (ECC), to compensate for different efficiencies between patient samples. This approach comprises the inclusion of two different reference reactions, one of which is carried out with mutant primers. Both reference reactions have been developed to amplify with equivalent efficiencies on the same template. The exact difference in the threshold cycle values (Ct) between both reference reactions (ΔCt value) is dependent on the amplification efficiencies. This ΔCt value can, therefore, be used to calculate the exact efficiencies of both reactions for each sample in comparison to a calibrator sample, thus providing a way to compensate for differences in efficiencies between patient samples and the calibrator in quantitative analyses. In this way, accurate estimation of residual disease in patient samples becomes possible, regardless of DNA quality or the presence of PCR-inhibiting compounds.
Materials and Methods
Real-Time PCR
During PCR amplification, the number of molecules that is synthesized (Xn) depends on the number of template molecules present at the beginning of the reaction (X0), the reaction efficiency (E) and the number of amplification cycles (n) (Eq. 1) . 24 In real-time PCR, sample positivity is defined as the cycle number at which emitted fluorescence exceeds the 10 times SD of baseline emissions, and is called the threshold cycle (Ct). The number of molecules synthesized at the threshold cycle (XCt) is specific but constant (C) for each type of reaction and may depend on reporter dye (6-carboxy-fluorescein (FAM) or 27-dimethyl-4,5-dichloro-6-carboxy-fluorescein (JOE)).
 |
Normalization
To correct for differences in DNA or RNA load between patient samples, the target PCR, t(14;18) in this report, is normalized to a reference PCR, β-actin in this report, that is specific for an endogenous housekeeping gene. The t(14;18) and the β-actin reactions outlined in this reporthave equivalent amplification efficiencies, allowing direct normalization of the t(14;18) PCR to the β-actin PCR at the Ct level ( Eq. 2 ; K Livak, personal communication and Applied Biosystems User Bulletin #2).
 |
PCR Efficiency
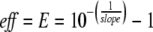
The efficiency (E) of a reaction can be determined by a standard curve. Ct values for serial template dilutions in dH2O are related to the logarithm of the dilution factor, and the slope is a measure for reaction efficiency ( Eq. 3 ; K Livak, personal communication and Applied Biosystems User Bulletin #2):
 |
Quantification Using a Single Calibrator \
For quantification, patient samples can be related to a single calibration sample, facilitating the use of Eq. 4 (ie, the comparative Ct method; K Livak, personal communication and Applied Biosystems User Bulletin #2). However, this method demands equivalent amplification efficiencies between patient samples and the calibrator.
 |
whereby ΔΔCt1 = ΔCt1S − ΔCt1C
The calibrator (X0N,Cal) used for the quantitation of circulating lymphoma cells during the course of disease in follicular non-Hodgkin’s lymphoma (NHL) patients is a 100-fold dilution of t(14;18) positive cell line SUDHL6 DNA into a DNA pool obtained from four EBV-induced lymphoblastoid B cell lines, and equals 750 t(14;18)-carrying lymphoma cells per 0.5 μg of DNA (equivalent to 75,000 cells). 4, 14
The Efficiency Compensation Control (ECC)
The ECC outlined in this report is used to compensate for varying PCR efficiencies between patient samples and the calibrator. The ECC depends on two different reference reactions, ie, the multicopy β-actin gene and the single copy albumin gene. Both reactions amplify with equivalent efficiencies on identical DNA templates (see results), but provide different Ct values. The difference between both Ct values, ie, the ΔCt2 value, is solely dependent on the actual PCR efficiency for that template (Eq. 5) :
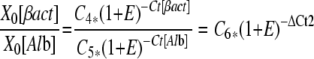 |
whereby ΔCt2 = Ct(βact)−Ct(Alb)
ΔCt2 values can be used to determine amplification efficiencies for patients samples relative to the efficiency of the calibrator, providing a correction factor for different efficiencies between patient samples and the calibrator (Eq 6) :
 |
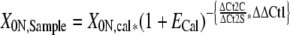
This correction factor can be introduced into Eq. 4 , facilitating the quantification of patient samples relative to a single calibrator with compensation for different efficiencies between patient samples and the calibrator sample (Eq 7) :
 |
DNA Isolation
Patient whole blood sample DNA was isolated by a standard high-salt lysis method as described by Miller et al. 25
t(14;18) PCR Analysis
Amplification reactions are performed in the ABI/Prism 7700 sequence detector (Applied Biosystems, Foster City, CA). Five hundred nanograms of patient sample DNA is amplified in duplicate in the presence of 300 nmol/L oligonucleotides MBR-2 (5′-TCC CTT TGA CCT TGT TTC TTG A-3′; bp 2816–3037 of GenEMBL database entry acc. 14745) and JH-con, 1 160 nmol/L of dual-labeled fluorogenic MBR internal probe 5′-(FAM)-CAC AGA CCC ACC CAG AGC CC-(TAMRA)-p3′, 250 μmol/L dNTPs, 1.25 U of AmpliTaq DNA polymerase and 4 mmol/L MgCl2 in Sample Buffer A (Applied Biosystems) in a volume of 50 μl. Samples are heated for 10 minutes at 95°C and amplified for 50 cycles of 15 seconds at 95°C and 60 seconds at 60°C.
The Efficiency Compensation Control
Five hundred nanograms of patient sample DNA is amplified in duplicate in the presence of 100 nmol/L β-actin forward and reverse primers, 7 100 nmol/L of dual-labeled fluorigenic β-actin probe, 7 300 nmol/L mutant albumin forward (5′-TGA AAC ATA CGT TCC CAA AGA GCC T-3′) and reverse (5′-GAG AGG AAG AGT CTT TCA CAC GTA GA-3′) primers, 100 nmol/L of dual-labeled fluorigenic albumin probe (5′-(JOE)-TGC TGA AAC ATT CAC CTT CCA TGC AGA-(TAMRA)−3′), 250 μmol/L dNTPs, 1.25 U of AmpliTaq DNA polymerase, and 4 mmol/L MgCl2 in Sample Buffer A in a total volume of 50 μl. Amplification conditions are the same as mentioned above.
Results
To study variation in amplification efficiencies among patient DNA samples, the efficiencies of our t(14;18) and albumin PCRs were first tested on cell line DNA. Genomic DNA from the t(14;18)-carrying cell line SUDHL6 was serially diluted in dH20 and amplified in duplicate to construct t(14;18) and albumin standard curves for eight to ten independent experiments. R2 values of all curves exceeded 0.98, and reaction efficiencies were calculated from the slopes (Eq. 3) .The average efficiencies for the t(14;18) reaction (n = 11) and the albumin reaction (n = 8) were E = 0.91 ± 0.05 and E = 0.93 ± 0.04, respectively (Table 2) .We then determined the efficiencies for both reactions on patient DNA samples that were isolated from lymph node biopsies or whole blood specimen (Table 2) . Lymph node DNA samples most likely seem to contain higher contents of PCR inhibiting compounds resulting in lower amplification efficiencies compared to patient whole blood DNA samples. Both reaction efficiencies for each DNA sample compared, showed that a low efficiency for one reaction was accompanied by a low efficiency for the other reaction. For lymph node DNA samples the average efficiencies for the t(14;18) and albumin reactions are E = 0.66 and E = 0.72 respectively, but are E = 0.94 and E = 0.94, respectively, for whole blood DNA samples. The average efficiency difference (ΔE value) between both reactions is ΔE = 0.023 for lymph node DNA samples (n = 3 pairs) and ΔE = −0.009 for whole blood DNA samples (n = 8 pairs).
Table 2.
t(14;18) and Albumin PCR Efficiencies for Follicular NHL Patient Lymph Node and Peripheral Blood DNA Samples
| Patient no. | Patient biopsy | t(14;18) PCR product length (bp)† | Et(14;18) | EAlbumin | ΔE |
|---|---|---|---|---|---|
| SUDHL6 | 385 | 0.91 ± 0.05 | 0.93± 0.04 | −0.02 | |
| (n = 11) | (n = 8) | ||||
| 1 | LN | 312 | 0.75a | 0.70e | 0.05 |
| 2 | LN | 363 | 0.74a | 0.72e | 0.02 |
| 3 | LN | 350 | 0.59a | 0.59e | 0 |
| 4 | LN | 360* | 0.67b/0.59a | ND | — |
| 5 | LN | 267* | 0.63b/0.58a | ND | — |
| 6 | LN | 299 | ND | 0.95e | — |
| 7 | LN | 449 | ND | 0.65e | — |
| Mean | 343 | 0.66 | 0.72 | 0.023 | |
| 8 | PB | 398 | 0.97c | 0.95f/0.91h | 0.04 |
| 9 | PB | 367 | 1.03c | 0.97f | 0.06 |
| 10 | PB | 366 | 0.89c | 1.0f/0.94h | −0.08 |
| 11 | PB | 329 | 0.84c | 0.85f | −0.01 |
| 12 | PB | 313 | 1.05d | 0.96g | 0.09 |
| 13 | PB | 343 | 0.91d | 0.99g | −0.08 |
| 14 | PB | 520 | 0.91d | 0.92g | −0.01 |
| 15 | PB | 337 | 0.89d | 0.97g | −0.08 |
| 16 | PB | 336* | ND | 0.87g | — |
| Mean | 368 | 0.94 | 0.94 | −0.009 |
LN, lymph node; PB, peripheral blood.
Larger PCR products are also formed due to priming of JHcon primer to downstream JH-gene segments.
Product size was determined from the breakpoint sequence and confirmed by gel-electrophoresis.
a–hSamples amplified within the same amplification reaction.
Based on these observed differences in reaction efficiencies between patient samples (Table 2) , we have developed the “efficiency compensation control (ECC)”. This control uses two reference reactions that are specific for the β-actin and the albumin housekeeping genes. When testing both reaction efficiencies on serial B cell line DNA pool dilutions (DNA pool from four EBV-induced B cell lines), both reactions performed with efficiencies of E = 0.95 and E = 0.94 for the β-actin and albumin reaction, respectively. β-actin is a multicopy gene with several pseudogenes and albumin is a single copy gene, and are present in a constant ratio for genomic DNA templates. Both PCRs will therefore produce different Ct values at identical template concentrations (Figure 1) . For genomic DNA templates, the ΔCt value between these reactions (ΔCt2 value) is exclusively determined by the actual amplification efficiencies for both reactions (Figure 1) , and is independent of initial DNA concentration. In the experiment as described above, the ΔCt2 value between the β-actin reaction and the albumin reaction remained constant over all serial B cell line DNA pool dilutions (500 ng - 8 ng) and was ΔCt2 = 3.86 ± 0.08. Samples that amplify with high reaction efficiencies will provide lower ΔCt2 values in comparison to samples that are contaminated with PCR inhibiting compounds and consequently amplify with lower reaction efficiencies (Figure 1) . This ΔCt2 value can therefore be used to compensate for efficiency differences between patient samples and the calibrator in quantitative minimal residual disease studies. The target and reference PCRs should be performed on the same template dilution to exclude differences in reaction efficiencies.
Figure 1.

Theoretical schematic illustration of β-actin and albumin amplification curves at high and low reaction efficiencies (>E). The β-actin (black curves) and albumin (gray curves) amplification curves and Ct values at high (solid lines) and low (stippled lines) reaction efficiencies for a hypothetical genomic DNA template concentration. Low reaction efficiencies result in higher Ct values for both reaction in a non-linear relationship (Eq. 1) . DNA templates with higher efficiencies for both reactions will have lower difference in Ct values between both reference reactions (low ΔCt values) than templates with lower reaction efficiencies (high ΔCt values).
We then calculated the ΔCt2 value that is theoretically needed between two reference PCRs to distinguish between efficiency differences as low as E = 0.05. This will of course depend on the reproducibility of both Ct values for the reference reactions. The standard deviations in Ct values for both reference reactions performed on the serial B cell line DNA pool dilutions as described above ranged between 0.007 cycles for 0.5 μg DNA to 0.11 cycles for the highest dilution (0.8 ng DNA). Assuming a SD in Ct values of 0.11 cycles for both reference reactions, the ΔCt2 value between both reactions needs to be in the order of ten cycles to distinguish between efficiency differences among DNA samples as low as ΔE = 0.05. No combinations of multicopy gene PCRs (β-actin, 18S ribosomal DNA) versus single copy gene PCRs (albumin, RNase-P) were identified that produced a sufficient ΔCt2 value. As an alternative, a mutant albumin primer pair was designed that amplified with an efficiency of E = 0.96, compared to the β-actin PCR (E = 0.95 as described above). The mutant albumin primer pair produced Ct values that were about 6 cycles higher Ct values for each template dilution in comparison to the wild-type albumin reaction. The ΔCt2 values between the β-actin PCR and this mutant albumin PCR was about 9 cycles over all template dilutions tested. This PCR combination may work for the Efficiency Compensation Control. To minimize variation in Ct values for both reactions, a multiplex PCR was developed. Using 100 nmol/L of β-actin primers and 300 nmol/L of mutant albumin primers, both reactions produced Ct values of 19.98 ± 0.10 and 30.06 ± 0.03, respectively, in a multiplex setting, and Ct = 19.25 ± 0.01 and 27.62 ± 0.04, respectively, in separate PCRs.
The ECC was tested in a retrospective study on 47 selected blood and bone marrow DNA samples obtained from 12 follicular NHL patients that had been isolated between 1990–1994 using the high-salt-lysis method. 25 Two of these samples had previously demonstrated severe PCR inhibition as assessed by conventional PCR (not shown). PCR inhibition was not due to DNA degradation as determined by gel electrophoresis (not shown). When performing the ECC multiplex PCR, thirty-two samples produced reasonable Ct values for both reference PCRs with ΔCt2 values (range ΔCt2 = 8.19–9.88; mean ΔCt2 = 9.04). Assuming an average amplification efficiency of E = 0.94 for these samples (Table 2) , the efficiency for each sample was then calculated based on the ΔCt2 value and ranged between E = 0.83 and E = 1.07 (equation 6) . Fifteen remaining patient samples (32%) produced ΔCt2 values lower than ΔCt2 = 8.19 (ΔCt2 = −6.83 to ΔCt2 = 7.82), and theoretically correspond to abnormal efficiencies of E = 1.15 and higher. These samples may suffer from severe PCR inhibition that affects both reference PCRs to a different extent, and can therefore not be corrected for different efficiencies using the ECC. Analysis of ΔCt2 values from freshly isolated patient DNA samples in a prospective study revealed that 2 out of 50 samples (4%) suffered from this same problem (not shown).
The ΔCt2-based efficiencies were compared to efficiencies that were calculated from standard curves. Four samples with high ΔCt2 values (low efficiency) and four with low ΔCt2 values (high efficiency) were selected to construct standard curves. For seven out of eight samples, the ECC determined efficiencies match the efficiencies as determined from the standard curves of the t(14;18) and albumin PCR (Table 3) .For five samples, the ECC based efficiencies fall within the SD of the efficiencies that were derived from standard curves.
Table 3.
Comparison of Reaction Efficiency as Determined from the Efficiency Compensation Control (EECC) and as Determined from the Slope of Standard Curves (ESC)
| Patient no. | ΔCt2 | EECC | ESC |
|---|---|---|---|
| 17* | 9.88 | 0.83 | 0.92 ± 0.01 |
| 17† | 9.47 | 0.88 | 0.84 ± 0.05 |
| 18* | 9.41 | 0.89 | 0.89 ± 0.01 |
| 19* | 9.47 | 0.88 | 0.92 ± 0.01 |
| 1* | 8.32 | 1.05 | 1.04 ± 0.02 |
| 4* | 8.51 | 1.02 | 1.0 ± 0.05 |
| 20* | 8.66 | 1.0 | 1.06 ± 0.08 |
| 21* | 8.56 | 1.01 | 0.96 ± 0.04 |
Patient sample DNA isolated from peripheral blood samples
or bone marrow aspirates.
The experimentally determined efficiency (ESC) is the average efficiency for the β-actin and the mutant albumin reaction as calculated from the slope of the standard curves.
Discussion
In quantitative PCR studies monitoring for minimal residual disease, patient samples are compared to a golden standard that either consists of a well-defined calibrator sample (ie, the comparative Ct method) or consists of a calibrator serial dilution. All real-time quantitative PCR studies performed thus far are based on the assumption that PCR efficiencies are the same for patient samples and the calibrator. However, many factors affect PCR efficiency and consequently the outcome of quantitative PCR analyses. It is commonly believed that amplicon size plays an important role in this matter, as well as contaminating factors in the patient sample that will inhibit the amplification reaction and will therefore delay reaction efficiency. A few of these PCR inhibiting factors have been characterized that interfere with quantitative PCR analyses, especially within the hemato-oncology field. 19, 20, 21, 22, 23
Testing the efficiencies for the t(14;18) target and albumin reference PCR for various patient DNA samples, efficiencies for both reactions varied between different patient samples probably due to contaminating PCR inhibiting compounds. PCR efficiency was not affected by amplicon size (Table 2) , at least for amplicons ranging between 89 and 520 bp, nor was it due to DNA degradation. DNA templates isolated from patient lymph node biopsies amplify with lower efficiencies in comparison to patient whole blood DNA samples (Table 2) . Most importantly, for each DNA sample the efficiencies for both PCRs were equivalent, indicating that a low t(14;18) reaction efficiency for a DNA template is accompanied by a similar low efficiency for the albumin reaction for that same template. This indicates that PCR inhibiting factors affect different reactions performed on the same template to a similar extent. For all t(14;18) and albumin standard curves, the deviations of Ct values for all template dilutions relative to the regression curve were equivalent, and no evidence was found for increasing deviations at higher template dilutions as should be expected in case of dilutable PCR inhibition (all r2 values exceeded 0.98 but in general were in the order of 0.995). PCR inhibition for the samples evaluated in this study was non-dilutable, and is presumably caused by compounds that tightly bind to the DNA like hemoglobin degradation compounds.
Our results show that quantitative studies tend to suffer from efficiency differences between samples, leading to inaccurate results. For instance, lower reaction efficiencies for patient samples resulting in higher Ct values will lead to underestimation of residual disease content. This especially affects patient samples with low residual malignant cell numbers. Normalization of the target PCR (the t(14;18) reaction in this report) to a reference PCR, usually specific for an endogenous housekeeping gene, will only partially compensate for this problem since the number of reference gene copies is always relatively high in comparison to the number of target copies reflecting the amount of malignant cells. The efficiency compensation control (ECC) was developed to compensate for sample specific efficiency variation in comparison to a calibrator (equation 7) , and consists of a multiplex PCR for two endogenous house keeping genes, ie, β-actin and albumin, that are present in a constant ratio in DNA templates but that produce different Ct values (ΔCt2) for identical template. Both reactions performed with equivalent efficiencies on serial template dilutions, and it is reasonable to assume that both ECC reference reactions will be equally affected by contaminating PCR inhibiting substances as is the case for the t(14;18) and wild-type albumin PCR. The ΔCt2 value is therefore independent of initial template concentration, but depends on the exact amplification efficiencies (equation 6) . The ECC can theoretically distinguish between patient samples that differ in amplification efficiencies as low as E = 0.05. Disease associated chromosomal aneuploidy involving the β-actin or albumin genes may affect results obtained by the ECC. This is unlikely for follicular NHL blood or bone marrow samples since the total number of circulating t(14;18) positive lymphoma cells during the course of disease is in general below five percent of total mononuclear cells. 3, 4, 8 However, for leukemias with a high tumor cell percentage in blood and bone marrow samples during apparent disease in contrast to clinical remission phases, this could be a problem.
Patient DNA templates that had been stored for several years produced abnormal ECC ΔCt2 values for 32% of the samples compared to 4% of freshly isolated patient DNA samples. For these samples, the ECC will not be useful to correct for efficiency differences in comparison to a calibrator sample. These samples probably contain so many PCR inhibiting compounds that different PCRs are affected to a different extent. Quantitation of residual disease in these samples will therefore not be possible. The ECC seems very useful in identifying such patient samples in quantitative analyses.
In conclusion, the ECC serves three purposes: first, the β-actin Ct value for each sample is used to normalize for different DNA input. Second, the ECC ΔCt2 value is used to compensate for efficiency difference in comparison to the calibrator. Third, the ECC identifies patient DNA templates that may not be quantifiable for minimal residual disease content due to unequal inhibition of the various amplification reactions. Since the ECC uses two reference PCRs that are specific for endogenous house keeping genes, it may be applicable as a general control in real-time quantitative studies using genomic DNA templates. In our opinion, the ECC approach is a powerful control for TAQMAN-based analyses that can be performed in the ABI PRISM 7700 system (Applied Biosystems) but needs further evaluation in other real-time PCR systems. For probe designs, other fluorescent reporter groups can be used, but FAM in combination with JOE or VIC proved to be a useful combination in a multiplex setting. Hydrolyzing probes may be replaced by molecular beacons or scorpion primers. 26
Table 1.
Definition of Symbols
| Xn | number of molecules at cycle n |
| X0 | initial number of molecules |
| E | efficiency of amplification |
| n | number of cycles |
| Ct | threshold cycle |
| C (C1–C6) | constant |
| XCt | number of molecules at Ct |
| X0N | normalization of target molecules to reference molecules |
| ΔCt1 | =Cttarget − Ctreference |
| ΔΔCt1 | =ΔCt1sample− ΔCt1calibrator |
| ΔCt2 | =Ctβact− CtAlb |
Acknowledgments
We thank Konnie Hebeda, Jeroen van Dijk, Linda de Wit, and Ewald Mensink for critically reading this manuscript.
Address reprint requests to Jules P. P. Meijerink, Ph.D., Department of Pediatrics, Division of Oncology/Hematology, Sophia Children’s Hospital, Erasmus University Rotterdam, Dr. Molewaterplein 60, Rotterdam, The Netherlands. E-mail: meyerink@kgk.fgg.eur.nl.
References
- 1.Crescenci M, Seto M, Herzig G, Weiss P, Griffith R, Korsmeyer SJ: Thermostable DNA polymerase chain amplification of t(14;18) chromosome breakpoints and detection of minimal residual disease. Proc Natl Acad Sci USA 1988, 85:4869-4873 [DOI] [PMC free article] [PubMed] [Google Scholar]
- 2.Lion T, Izraeli S, Henn T, Gaiger A, Mor W, Gadner H: Monitoring of residual disease in chronic myelogenous leukemia by quantitative polymerase chain reaction. Leukemia 1992, 6:495-499 [PubMed] [Google Scholar]
- 3.Meijerink J, Goverde G, Smetsers T, Raemaekers J, Bogman M, de Witte T, Mensink E: Quantification of follicular non-Hodgkin’s lymphoma cells carrying t(14;18) in a patient before and after allogeneic bone marrow transplantation. Ann Oncol 1994, 5(Suppl 1):43-45 [DOI] [PubMed] [Google Scholar]
- 4.Mandigers C, Meijerink J, Raemaekers J, Schattenberg A, Mensink E: Graft-versus-lymphoma effect of donor leukocyte infusion demonstrated by real-time quantitative PCR analysis of t(14;18). Lancet 1998, 352:1522-1523 [DOI] [PubMed] [Google Scholar]
- 5.Wang A, Doyle M, Mark D: Quantitation of mRNA by the polymerase chain reaction. Proc Natl Acad Sci USA 1989, 86:9717-9721 [DOI] [PMC free article] [PubMed] [Google Scholar]
- 6.Gilliland G, Perrin S, Blanchard K, Bunn H: Analysis of cytokine mRNA and DNA: detection and quantitation by competitive polymerase chain reaction. Proc Natl Acad Sci USA 1990, 87:2725-2729 [DOI] [PMC free article] [PubMed] [Google Scholar]
- 7.Thompson J, Brodsky I, Yunis J: Molecular quantitation of residual disease in chronic myelogenous leukemia after bone marrow transplantation. Blood 1992, 79:1629-1635 [PubMed] [Google Scholar]
- 8.Meijerink J, Smetsers T, Raemaekers J, Bogman M, de Witte T, Mensink E: Quantitation of follicular non-Hodgkin’s lymphoma cells carrying t(14;18) by competitive polymerase chain reaction. Br J Haematol 1993, 84:250-256 [DOI] [PubMed] [Google Scholar]
- 9.Gibson U, Heid C, Williams P: A novel method for real time quantitative RT-PCR. Genome Methods: Genome Research. 1996, :pp 995-1001 NY, Cold Spring Harbor Laboratory Press, Cold Spring Harbor [DOI] [PubMed] [Google Scholar]
- 10.Heid C, Stevens J, Livak K, Williams P: Real time quantitative PCR. Genome Methods: Genome Research. 1996, :pp 986-994 NY, Cold Spring Harbor Laboratory Press, Cold Spring Harbor [DOI] [PubMed] [Google Scholar]
- 11.Holland P, Abramson R, Watson R, Gelfand D: Detection of specific polymerase chain reaction products by utilizing the 5′ to 3′ exonuclease activity of Thermus aquaticus DNA polymerase. Proc Natl Acad Sci USA 1991, 88:7276-7280 [DOI] [PMC free article] [PubMed] [Google Scholar]
- 12.Livak K, Flood S, Marmaro J, Giusti W, Deetz K: Oligonucleotides with fluorescent dyes at opposite ends provide a quencher probe system useful for detecting PCR products and nucleic acid hybridization. PCR Methods Applications 1995, 4:357-362 [DOI] [PubMed] [Google Scholar]
- 13.Luthra R, McBride J, Cabanillas F, Sarris A: Novel 5′ exonclease-based real-time PCR assay for the detection of t(14;18)(q32;q21) in patients with follicular lymphoma. Am J Pathol 1998, 153:63-68 [DOI] [PMC free article] [PubMed] [Google Scholar]
- 14.Meijerink J, Mandigers C, Raemaekers J, Tönnissen E, Noordanus C, Mensink E: Molecular diagnostic monitoring of efficacy of intensive treatment for lymphoma using a real-time quantitative assay: advances in critical care testing, 1999:pp 191-201 Switzerland, AVL Medical Instruments AG, Schaffhausen
- 15.Mensink E, Locht A, van de Schattenberg A, Linders E, Schaap N, Geurts van Kessel A, de Witte T: Quantitation of minimal residual disease in Philadelphia chromosome positive chronic leukaemia patients using real-time quantitative RT-PCR. Br J Haematol 1998, 102:768-774 [DOI] [PubMed] [Google Scholar]
- 16.Marcucci G, Livak K, Bi W, Strout M, Bloomfield C, Caligiuri M: Detection of minimal residual disease in patients with AML/ETO-associated acute myeloid leukemia using a novel quantitative reverse transcription polymerase chain reaction assay. Leukemia 1998, 12:1482-1489 [DOI] [PubMed] [Google Scholar]
- 17.Pongers-Willemse M, Verhagen O, Tibbe G, Wijkhuis A, de Haas V, Roovers E, van de Schoot E, van Dongen J: Real-time quantitative PCR for the detection of minimal residual disease in acute lymphoblastic leukemia using junctional region specific Taqman probes. Leukemia 1998, 12:2006-2014 [DOI] [PubMed] [Google Scholar]
- 18.Willems P, Verhagen O, Segeren C, Veenhuizen P, Guikema J, Wiemer E, Groothuis L, Buitenweg-de Jong T, Kok H, Bloem A, Bos N, Vellenga E, Mensink E, Sonneveld P, Lokhorst H, van der Schoot E, Raymakers R, : for the Belgium-Dutch Hematology-Oncology Group: Consensus strategy to quantitate malignant cells in myeloma patients is validated in a multicentre study. Blood 2000, 96:63-70 [PubMed] [Google Scholar]
- 19.Golenberg E, Bickel A, Weihs P: Effect of highly fragmented DNA on PCR. Nucleic Acids Res 1996, 24:5026-5033 [DOI] [PMC free article] [PubMed] [Google Scholar]
- 20.Pikaart M, Villeponteau B: Suppression of PCR amplification by high levels of RNA. Biotechniques 1993, 14:24-25 [PubMed] [Google Scholar]
- 21.Beutler E, Gelbart T, Kuhl W: Interference of heparine with the polymerase chain reaction. Biotechniques 1990, 9:166. [PubMed] [Google Scholar]
- 22.Akane A, Matsubara K, Nakamura H, Takahashi S, Kimura K: Identification of the heme compound copurified with deoxyribonucleic acid (DNA) from blood stains, a major inhibitor of polymerase chain reaction (PCR) amplification. J Forensic Sci 1994, 39:362-372 [PubMed] [Google Scholar]
- 23.Belec L, Authier J, Eliezer-Vanerot M, Piedouillet C, Mohamed A, Gherardi R: Myoglobin as a polymerase chain reaction (PCR) inhibitor: a limitation for PCR from skeletal muscle tissue avoided by the use of Thermus thermophilus polymerase. Muscle Nerve 1998, 21:1064-1067 [DOI] [PubMed] [Google Scholar]
- 24.Erlich H: PCR Technology: Principles and Applications for DNA Amplification. 1989. Stockton Press, New York
- 25.Miller S, Dykes D, Polesky H: A simple salting out procedure for extracting DNA from human nucleated cells. Nucleic Acids Res 1988, 16:1215. [DOI] [PMC free article] [PubMed] [Google Scholar]
- 26.Thelwell N, Millington S, Solinas A, Booth J, Brown T: Mode of action and application of scorpion primers to mutation detection. Nucleic Acids Res 2000, 28:3752-3761 [DOI] [PMC free article] [PubMed] [Google Scholar]