

Abstract
Links between trait disinhibition and high-risk drinking are well established. It is also known that alcohol has disinhibiting effects. Nonetheless, there is no measure in the literature devoted exclusively to assessing disinhibiting effects of alcohol. The multidimensional Drinking-Induced Disinhibition Scale (DIDS) was developed as part of Study I, a prospective survey conducted with undergraduates (N = 337). Study II, a cross-sectional survey (N = 260), allowed for a confirmatory factor analysis and further validation of the measure through comparisons with an expectancies scale. The nine-item DIDS is comprised of three subscales assessing euphoric/social, dysphoric and sexual disinhibition. All three subscales had good internal consistency and adequate test-retest reliability. Convergent and discriminant validity were established in both studies. The subscales had different associations with high-risk drinking: sexual disinhibition predicted heavy episodic drinking; dysphoric disinhibition predicted alcohol-related problems and euphoric/social had associations with both. A cluster analysis revealed four distinct disinhibition profiles (i.e., low effect drinker; high euphoric/social only; high euphoric social and dysphoric; high euphoric/social and sexual), which predicted likelihood of high-risk drinking.
Keywords: disinhibition, undergraduate drinking, psychometrics, alcohol-related problems, heavy episodic drinking
1. Introduction
Trait disinhibition, typically sensation seeking, has been associated repeatedly with alcohol-related problems among undergraduates. For instance, Justus and colleagues (2000) found that sensation seeking was correlated with both alcohol consumption and with risky sexual behavior. Simons and colleagues (2005) found that sensation seeking correlated with alcohol-related problems although this association was mediated by enhancement motives (i.e., to experience pleasurable effects) for drinking. Longitudinally, tendencies toward disinhibition during childhood predict college-aged substance use (Clark, Cornelius, Kirisci & Tarter, 2005).
It has been well established that addictive substances have disinhibiting effects in that they increase the salience of substance-related reinforcers and decrease ability to inhibit impulses (Goldstein & Volkow, 2002; Jentsch & Taylor, 1999; Lyvers, 2000). Findings from several studies suggest that alcohol-induced disinhibition is particularly relevant to undergraduate drinking behavior (Leeman & Wapner, 2001; Nagoshi et al., 1992; Wood et al., 1992). Unlike research on trait disinhibition, there has been little work that attempts to identify different types of disinhibiting effects or to relate disinhibiting effects to high-risk drinking patterns (e.g., alcohol-related problems, heavy episodic drinking). However, the expectancy of disinhibition has been positively correlated with frequency of intoxication (Nagoshi et al., 1992) and alcohol-related problems (Wood et al., 1992). Also, reports of drinking for the purpose of disinhibition have been found to have moderate associations with alcohol-related problems (Labouvie & Bates, 2002). These findings suggest that disinhibiting effects may be associated with high-risk drinking.
To date, no scales devoted exclusively to measuring alcohol-induced disinhibition have been published. Thus, there is also currently no means of assessing different types of alcohol-induced disinhibition. In a report from the National Institute on Alcohol Abuse and Alcoholism (NIAAA) (1998), behavioral disinhibition was identified as a topic requiring further research. In this same report, Finn urged researchers specifically “to capture the multidimensional nature of behavioral disinhibition.” The development of a scale to assess multiple types of alcohol-induced disinhibition would represent a step toward accomplishing this goal. Also, subscales assessing different types of disinhibition would allow for an examination of specific associations with alcohol-related problems and heavy episodic drinking.
Taking into consideration these gaps in the literature, we set out to develop the Drinking-Induced Disinhibition Scale (DIDS) with the intention that the novel measure would assess multiple types of disinhibiting effects of alcohol. In the present research, drinking-induced disinhibition was defined as behaviors, thoughts or feelings occurring while drinking that are typically restricted in one’s everyday, non-drinking life. Thus, a state of drinking-induced disinhibition should differ noticeably from one’s regular experiences and items for this measure were written in such a way as to make this contrast explicit.
Based on a review of the literature, four potential types of disinhibition were considered in the process of developing items for this novel measure. Items were created to assess disinhibition as euphoric or excitatory as it is traditionally considered (e.g., Justus et al., 2000; Wood et al., 1992) and in contrast, items relating to dysphoric effects were also written to capture the experience of the “sad drunk,” who tends to express negative affect to a greater extent while drinking than in everyday life. Providing empirical support for the notion of the “sad drunk,” Young and colleagues (2004) identified a subset of alcohol dependent patients who reported relatively strong expectancies of negative affect resulting from their drinking. According to a number of findings in the literature, heavy drinkers have been found to endorse expectancies that they will be more assertive after consuming alcohol (e.g., Connors et al., 1986). Given this notion of alcohol as “liquid courage” in social interactions, items were written to assess social disinhibition. People’s sense of risk associated with sexual intercourse has been found to decrease when alcohol is consumed (e.g., Fromme, D’Amico & Katz, 1999), thus the possibility of sexual disinhibition associated with drinking also influenced the development of items. While we expected that these four types of disinhibition would be part of the final version of the measure, we were also open to the possibility that other types of disinhibition could emerge in the scale development process.
Disinhibiting effects as measured by the DIDS are conceptually distinct from alcohol-related expectancies and motives. Baer (2002) defines expectancies as “specific beliefs about the behavioral, emotional and cognitive effects of alcohol” (p. 45). Motivational models of alcohol use assume that “people drink in order to attain certain valued outcomes” (Cooper, 1994, p. 117). Disinhibition subscales have been included in two expectancies measures (Southwick et al., 1981; Wood et al., 1992) and in a measure of drinking motives (Labouvie & Bates, 2002), presumably because disinhibiting effects may be held as beliefs about the effects of alcohol and may consciously motivate drinking behavior. However, the DIDS was developed with the assumption that disinhibiting effects need not necessarily be consciously held as beliefs or consciously motivate drinking behavior. The DIDS was designed to assess specific behaviors, thoughts and feelings expressed more freely when under the influence than when one is not drinking. Accordingly, items in this new measure were written to make explicit the difference between disinhibited drinking states and one’s typical non-drinking state. Items in expectancies and motives measures do not consistently make explicit this disparity between drinking and non-drinking states. Also, items in these measures often require respondents to make broad generalizations about the effects they experience while under the influence. For instance, the following item from the Drinking Expectancy Questionnaire (DEQ) (Young & Knight, 1989) may refer to a multiple effects of alcohol: “I often feel sexier after I’ve been drinking.” “Sexier” may refer to one’s physical appearance or urges to flirt, to dance, to engage in sexual activity, etc. An attempt was made to make the items on the DIDS relate to specific effects of alcohol rather than generalizations encompassing a variety of effects.
Despite the distinctions among these types of measures, there is likely to be some degree of overlap among disinhibiting effects, expectancies and motives given that they all relate to effects of alcohol. Disinhibiting effects and motives with similar valences (e.g., social disinhibition and social motives) will likely have greater overlap than in cases of opposing valence. A considerable degree of overlap has been found between expectancies and motives in prior research as well. Read and colleagues (2003) found a highly significant correlation between tension reduction expectancies and coping motives (r = 0.74) and a significant correlation between “social lubrication” expectancies and social motives (r = 0.42). While motives and expectancies both had significant direct effects in predicting alcohol-related problems, neither was a significant predictor with the addition of the other to the model.
The Drinking-Induced Disinhibition Scale (DIDS) was developed as part of Study I, a one-year prospective study assessing risk of alcohol-related problems and heavy episodic drinking in a sample of undergraduates first assessed during Freshman year. As part of Study I, measures were included to permit analyses of convergent and discriminant validity. Criterion validity analyses were conducted both prospectively and concurrently to determine whether the DIDS subscales had different associations with heavy episodic drinking and alcohol-related problems. Of particular interest was the issue of whether distinct profiles of undergraduate drinkers could be differentiated based on DIDS subscale scores and whether these disinhibition profiles were also characterized by differences in problem drinking.
Study II was a cross-sectional survey involving students from all classes. The main objective was to conduct a confirmatory factor analysis of the measure. In addition, internal consistency reliability estimates for the subscales were replicated and further convergent and discriminant validity analyses were conducted. Comparisons between the DIDS and an established measure of drinking-related expectancies were considered important since both relate to effects of alcohol, the DIDS involving reports of alcohol’s effects and expectancies measures assessing drinkers’ beliefs about their experiences of these effects. The use of expectancies measures in alcohol research is common, especially with undergraduates, where expectancies have been found to predict both quantity of consumption and alcohol-related problems (Jones et al., 2001).
2. Methods
2.1 Study I
2.1.1 Item Generation
An initial list of prospective items was generated based on prior research (Leeman & Wapner, 2001) and a review of the literature. A pilot study was then conducted both to obtain data for these items and to solicit suggestions for additional potential items from a sample of undergraduates. The following instructions were given as an introduction to the measure: “Please indicate on the scale below how likely you are to experience each of the following occurrences either while drinking or as a direct result of consuming alcohol. As a point of reference, items rated as a ‘5’ or ‘6’ should be things that you often experience during the course of drinking or as a consequence of alcohol consumption, items rated ‘3’ or ‘4’ should happen from time to time and those marked with a ‘1’ or ‘2’ should be things you either never or have very rarely experienced in conjunction with drinking and have little or no intention of experiencing again.” Then the following prompt question was given just before the items: “How likely are you to experience each of these occurrences either while drinking or as a direct result of consuming alcohol? Please rate each occurrence according to a typical drinking experience for you.” Items were rated on a six-point scale ranging from 1 (“highly unlikely”) to 6 (“highly likely”). A large pool of prospective items were generated, however a decision was made to consider only items that contained the stem “… greater (“more” or “stronger”) than when not drinking” in order to ensure that the measure would be comprised of items that clearly assessed effects experienced while in a disinhibited state induced by alcohol. The two exceptions to this rule were sexual items that could not have been worded in this manner without making the phrasing of the item awkward (e.g., “hooking up with someone you are not dating”). Eighteen such items were considered for inclusion in the final measure.
2.1.2 Participants
At Time 1, participants (N = 337) were Freshmen at the University of Pennsylvania, who were at least 18 years of age and had consumed alcohol at least once since matriculating. Students took part in the Time 1 survey in exchange for partial credit toward the completion of introductory psychology research participation requirements. The Time 1 sample was 59% female and mainly White (75%) with the remainder comprised of East/Southeast Asians (9%), Blacks (4%), Hispanics (4%), South Asians/Indians (2%) and “other” (6%).
Time 2 data collection took place one year later during participants’ Sophomore year. The study ended before all Time 1 participants had an opportunity to take part in the Time 2 survey. A total of 283 Time 1 participants (55% female) were eligible for the Time 2 survey. Of these, 203 students completed Time 2 (72% response rate, 61% female). Eligible females (79% response rate) were significantly more likely than males (62% response rate) to have completed the Time 2 survey, X2 = 10.10, p = .001.
Based on independent samples t-tests, eligible participants not completing Time 2 (n = 80) reported higher weekly alcohol consumption at Time 1 (M = 16.65, SD = 15.90), than those who completed the Time 2 follow-up (M = 12.51, SD = 11.79), t (275) = 2.36, p = .019, and slightly higher alcohol-related problems at Time 1 (M = 6.66, SD = 4.28) than those who completed Time 2 (M = 5.56, SD = 4.11), t (281) = 2.01, p = .045. There were no other differences between those who did and did not complete the follow-up survey for any variables included in the analyses reported here.
2.1.3 Procedures
At Time 1, informed consent was obtained from all participants, then a pencil-and-paper survey was administered. Participants were asked to provide electronic mail addresses so that they could be contacted for follow-up surveys. Participants completing the study with at least 1 month remaining in the semester were contacted via electronic mail to complete a 30-day follow-up survey for the purpose of establishing test-retest reliability for the DIDS. Of the 236 participants who were eligible, 179 (66% female) completed the 30-day follow-up (76% response rate) and were entered into a cash lottery to win 1 of 8 $50 prizes. An online link was provided in an electronic mail message for a secure website where participants could complete the survey. A similar procedure was used for administration of the Time 2 follow-up survey one year later. Participants completing the Time 2 follow up were paid $10. The study was approved by the Institutional Review Board for the protection of human subjects at the University of Pennsylvania.
2.1.4 Measures
Participants were asked to report their typical monthly frequency of alcohol use since matriculating, along with their typical quantity consumed for four classes of alcohol (i.e., beer, wine, straight hard alcohol and mixed drinks). These quantity estimates were summed and multiplied by reported weekly frequency (converted from the monthly estimates) to yield estimates of weekly consumption, to which one was added and a log transformation was taken.
Measures directly pertaining to drinking were included in the Time 1 questionnaire to establish convergent validity for the DIDS. Cooper and colleagues’ (1992) measure of drinking motives (i.e., social, coping and enhancement) was included to assess the extent to which different motives are accompanied by the experience of parallel disinhibiting effects. Participants report on a five-point scale the extent to which they drink for each of 15 reasons provided. The authors reported good internal consistency reliability for the three subscales (social: 0.77, enhancement: 0.85, coping: 0.81). Students were also asked to report the percentage of their sexual encounters that were alcohol-related in response to a single item measure, rated on a six-point scale anchored at “0%” and “76–100%”: “Of those times when you’ve engaged in any kind of sexual activity during the past year, what percentage of those encounters involved one or both of you having consumed a significant amount of alcohol?”
Other measures were included to assess aspects of participants’ everyday lives to establish discriminant validity (e.g., depression, sexual behavior). Given that drinking-induced disinhibition was posited as a set of experiences that diverge from one’s normal, everyday thoughts and behaviors, weak associations were expected between scores on the DIDS and measures assessing aspects of participants’ everyday lives. Sensation seeking—assessed using the disinhibition subscale of the sensation seeking scale, Form V (Zuckerman, 1994) (alpha reported as ranging from .74 to .78)—was included because it is the most popular measure of disinhibition in the undergraduate drinking literature. Items on this scale present two descriptions and participants were asked to report which pertains most closely to them (e.g., “I like wild, uninhibited parties” or “I prefer quiet parties with good conversation”). Each response indicating sensation seeking tendencies was scored “1” and the sum of these scores was taken. Depression was assessed using five items from the depression subscale of the Symptom Checklist (SCL-90) (Derogatis et al., 1973). Items in the SCL-90 are rated on a five-point scale as to their prevalence during the past week. The depression items had good internal consistency reliability in the present study (.84). Extraversion was assessed using the extraversion subscale of Eysenck’s (1958) Extraversion/Neuroticism scale, comprised of six “yes”/”no” items such as “Would you rate yourself as a lively individual?” Affirmative responses were scored as “1” and summed to yield an overall score. Eysenck (1958) reported a split-half reliability of 0.71. For sexual activities, participants were asked to report on the following item using a six-point scale anchored with “0” and “100 or more”: “Regardless of how many partners you have had, approximately how many times have you engaged in sexual activity of any kind (including ‘hooking up,’ intercourse and oral sex) during the past year?”
Associations between the DIDS and two criterion validity measures were evaluated. Alcohol-related problems were assessed using the Rutgers Alcohol Problem Index (RAPI), developed by White and Labouvie (1989). The RAPI is a unidirectional scale comprised of 23 adverse alcohol-related events (e.g., “not able to do your homework or study for a test”). Each event that has occurred at least once or twice during the past three months as a result of alcohol use was scored as a “1” and these were totaled to yield an overall score out of a possible 23. The authors reported an internal consistency estimate of .92 for the scale. To arrive at estimates of heavy episodic drinking at Time 1 and Time 2, participants were asked to report how many times per month they consume five drinks at a single sitting (four for females) including all classes of alcohol. These were also converted to weekly estimates.
2.1.5 Analyses
Principal component analysis with both oblique and varimax rotations were used to assess the extent to which the individual items could be grouped into distinct factors. Factors formed from the rotations were considered as possible subscales if their eigenvalues were one or higher (Kaiser, 1960) and they were characterized by a conceptually clear underlying theme (Hatcher & Stepanski, 1994).
Coefficient alpha was used to assess internal consistency reliability for the subscales. Correlation coefficients were used to assess relationships between Time 1 and 30-day follow-up scores for the individual subscales in order to establish test-retest reliability. Zero-order correlations were used to assess associations between DIDS subscales and the validity measures in order to establish criterion, convergent and discriminant validity. The prospective nature of the study allowed for analyses of both concurrent and predictive validity. Partial correlations holding gender and drinking motives constant were used to assess incremental validity for the DIDS subscales in the prediction of heavy episodic drinking. These same variables in addition to weekly alcohol consumption were held constant to assess incremental validity in the prediction of alcohol-related problems.
Cluster analyses were conducted on Time 1 and Time 2 data in order to determine whether distinct profiles of undergraduate drinkers could be identified based on DIDS subscale scores. Cluster analysis is a procedure that can be used to differentiate classes of participants with respect to a particular variable or group of variables (Mayr, 1982). In accordance with Morral and colleagues’ (1997) approach, repeated k means cluster analyses were run seeking the largest possible number of clusters with none containing less than 10% of the sample. One-way ANOVA with Bonferroni comparisons were used to determine whether clusters differed in frequency of heavy episodic drinking or in alcohol-related problems at Time 1 or Time 2.
2.2 Study II
2.2.1 Participants
As in the pilot and prospective studies, participants (N = 260) were undergraduates at the University of Pennsylvania who were at least 18 years of age and had consumed alcohol at least once since matriculating. Participants completed the survey in exchange for partial credit toward the completion of introductory psychology research participation requirements. The sample was 60% female and mainly White (70%) with the remainder comprised of East/Southeast Asians (15%), Blacks (2%), Hispanics (3%), South Asians/Indians (5%) and “other” (5%). Unlike the pilot and prospective studies, participants were recruited from all classes with 57% of the sample coming from the Freshman class, 27% Sophomores, 11% Juniors and 5% Seniors.
2.2.2 Procedures
Participants were directed to a secure website to complete the survey. Before beginning, participants read an informed consent form and indicated their willingness to participate. Unlike the prospective study, participants’ names/email address could not be linked to their responses. The study was approved by the Institutional Review Board for the protection of human subjects at the University of Pennsylvania.
2.2.3 Measures
The final version of the DIDS was included. The Alcohol Effects Questionnaire (AEQ) (Rohsenow, 1983) was included in the survey for the purposes of further establishing convergent and discriminant validity for the DIDS. Rohsenow’s AEQ is a revision and extension of the Alcohol Expectancy Questionnaire developed by Brown and colleagues (1980). Participants indicated whether or not they believe that a series of 40 experiences pertain to their own drinking behavior. Affirmative responses were scored as “1” and summed to yield subscale scores. The measure is comprised of the following eight subscales (with alphas provided by Rohsenow in parentheses): global positive (0.49), relaxation/tension reduction (0.58), sexual enhancement (0.74), social expressiveness (0.73) and social/physical pleasure (0.66), aggression and power (0.66), cognitive and physical impairment (0.64) and careless unconcern (0.64).
2.2.4 Analyses
A confirmatory factor analysis was conducted to evaluate the factor model determined from principal component analysis in Study I. Confirmatory factor analyses were performed using SAS 9.1 for Windows (SAS Institute, Inc., 2003). For the confirmatory factor analytic model, both covariance and correlation matrices were calculated using the CALIS procedure and parameters were estimated using maximum likelihood. The covariance matrix was analyzed to compute all of the fit indices except the Standardized Root Mean Square Residual (SRMR), for which the correlation matrix was used.1 The following model fit indices were considered: the chi-square statistic (Hatcher, 1994), the Goodness of Fit Index (GFI; Mulaik, James, Van Alstine, Bennett, Lind, & Stilwell, 1989), the Non-Normed Fit Index (NNFI; Bentler & Bonett, 1980), the Comparative Fit Index (CFI; Bentler, 1990), the SRMR (Hu & Bentler, 1999), and the Root Mean Square Error of Approximation (RMSEA; Brown & Cudeck, 1993). To show a good fit for the model, the chi-square statistic should be non-significant (Floyd & Widaman, 1995). The GFI, NNFI, and CFI range between 0 and 1, with values closer to 1 indicating a better fit for the model. For these indices, values of .95 or higher are most desirable, and values of .90 or greater represent an acceptable model fit to the data (Hu & Bentler, 1999; McDonald & Ho, 2002). To demonstrate good fit, the SRMR should be less than .08 (Hu & Bentler, 1999). Regarding the RMSEA as a measure of good fit, Brown and Cudeck (1993) suggest that a reasonable value for the RMSEA is less than or equal to .08, and they posit that the RMSEA should never be greater than .10.
Coefficient alpha was used to verify internal consistency reliability for the individual subscales. To further establish convergent and discriminant validity, correlation coefficients were used to assess associations between the DIDS and AEQ subscales.
3. Results
3.1 Study I
3.1.1 Factor Structure of the DIDS
Principal component analyses conducted on the 18 items considered for inclusion in the DIDS yielded three factors with eigenvalues greater than one according to both the varimax and oblique rotations. All items loaded onto one and only one of the three factors at a level greater than 0.40. One factor was comprised of euphoric and social items (10 items), the second of dysphoric items (4 items) and the third of sexual items (4 items). One item was removed from consideration for the sexual subscale because its factor loading (0.41) was considerably lower than the next lowest sexual item (0.68). A dysphoric item pertaining to feelings of worthlessness was eliminated due to concern that it was much more negatively valenced than any of the other three items. For uniformity with the other two subscales, three items were selected to comprise the euphoric/social subscale as well. Items were selected that represented a range of effects that could be deemed euphoric and/or social disinhibition. Another principal component analysis with both varimax and oblique rotation was conducted involving the nine items selected for the final version of the DIDS. As presented in Table 1, the three factors all had eigenvalues considerably higher than 1 with high item factor loadings. The three subscales all had good internal consistency reliability according to coefficient alpha (euphoric/social: 0.76, dysphoric: 0.80 and sexual: 0.70) and adequate test-retest reliability (euphoric/social: 0.61, dysphoric: 0.64 and sexual: 0.79).
Table 1.
Time 1 Descriptives, Principal Component Analysis and Confirmatory Factor Analysis Results for Final Version of DIDS
| Scale Item | Mean | SD | Rotated Factor Loading Varimax | Rotated Factor Loading Oblique | Confirmatory Factor Loading |
|---|---|---|---|---|---|
| Euphoric/Social (eigenvalue varimax = 2.12, eigenvalue oblique = 2.36) | 3.91 | 1.08 | |||
| Acting more friendly or outgoing around others than when not drinking | 4.56 | 1.18 | 0.77 | 0.78 | 0.61 |
| Expressing more optimism than when not drinking | 3.50 | 1.37 | 0.85 | 0.87 | 0.84 |
| Greater feelings of personal freedom than when not drinking | 3.69 | 1.39 | 0.79 | 0.79 | 0.67 |
| Dysphoric (eigenvalue varimax = 2.15, eigenvalue oblique = 2.27) | 1.92 | 0.97 | |||
| Expressing more disappointment in yourself or others than when not drinking | 1.86 | 1.13 | 0.85 | 0.87 | 0.73 |
| Expressing stronger feelings of sadness than when not drinking | 2.20 | 1.30 | 0.83 | 0.82 | 0.66 |
| Feeling more depressed than when not drinking | 1.74 | 1.03 | 0.83 | 0.83 | 0.88 |
| Sexual (eigenvalue varimax = 1.95, eigenvalue oblique = 2.09) | 2.15 | 1.06 | |||
| Engaging in casual, consensual sex with someone who you are not dating | 1.80 | 1.28 | 0.89 | 0.91 | 0.68 |
| Engaging in consensual sex acts that you would be less likely to take part in when not drinking | 1.44 | 0.94 | 0.79 | 0.80 | 0.85 |
| Hooking up with someone who you are not dating | 3.22 | 1.69 | 0.70 | 0.67 | 0.88 |
N = 337 for all analyses except confirmatory factor analysis where N = 260
While the euphoric/social subscale was moderately correlated with the dysphoric (r = 0.28, p < .001) and sexual (r = 0.29, p < .001) subscales, the latter two subscales had only a small correlation (r = 0.11, p = .039). Subscale scores showed moderate stability from Time 1 to Time 2 (all p’s < .001). The correlation between euphoric/social at Time 1 (M = 3.91, SD = 1.08) and at Time 2 (M = 3.49, SD = 1.28) was r = 0.44. Dysphoric scores at Time 1 (M = 1.92, SD = 0.97) and Time 2 (M = 1.90, SD = 0.95) had a 0.45 correlation and sexual scores between Time 1 (M = 2.07, SD = 1.03) and Time 2 (M = 2.35, SD = 1.30) had a correlation of 0.53.
Males (M = 2.36, SD = 1.30) reported significantly higher sexual disinhibition than females (M = 2.01, SD = 0.98) at Time 1, t (334) = 2.99, p = .003, but not at Time 2. There were no significant gender differences for the other two DIDS subscales. Males (Time 1: M = 1.22, SD = 0.95; Time 2: M = 1.18, SD = 0.82) reported a higher frequency of weekly heavy episodic drinking than females at Time 1 and at Time 2 (Time 1: M = 0.76, SD = 0.79; Time 2: M = 0.82, SD = 0.83). Males (M = 6.19, SD = 3.92) reported slightly greater alcohol-related problems than females (M = 5.28, SD = 4.18) at Time 1, t (334) = 2.00, p = .046, but not at Time 2.
3.1.2 Convergent and Discriminant Validity
A number of convergent validity predictions were made. Scores on the sexual subscale were predicted to be positively correlated with the percentage of one’s sexual activity that occurs in conjunction with alcohol. Significant, positive correlations were expected between the social and enhancement motives subscales of the Cooper et al. (1992) measure and the euphoric/social subscale of the DIDS. Similar positive correlations were expected between the dysphoric subscale of the DIDS and coping motives. All concurrent and discriminant validity predictions are displayed in Table 2. According to predictions, euphoric/social was significantly correlated with both social and enhancement motives and the correlation between coping motives and dysphoric disinhibition was also significant. The high correlation between euphoric/social and coping motives was surprising. Scores on the sexual disinhibition scale were significantly correlated with participants’ reported percentage of sexual activity that was alcohol-related.
Table 2.
Convergent and Discriminant Validity Analyses from Prospective Study (Study I, Time 1) and Cross-Sectional Survey (Study II)
| DIDS Subscale | ||||
|---|---|---|---|---|
| Euphoric/Social | Dysphoric | Sexual | ||
| Measures of Other Aspects of Life (Study I, Time 1, N = 337) | Sensation Seeking | .19** | .03 | .46*** |
| Depression | .06 | .26*** | −.10 | |
| # of Sexual Encounters a | .20* | −.09 | .15 | |
| Extraversion b | .06 | −.08 | .24 | |
| Alcohol-Related Measures (Study I, Time 1) | Social Motives | .33*** | .22*** | .19** |
| Coping Motives | .42*** | .27*** | .23*** | |
| Enhancement Motives | .49*** | .25*** | 28*** | |
| % of Sexual Encounters That Were Alc.-Related a | .32*** | .16 | .50*** | |
| Alcohol-Related Measures (Study II N = 260) | AEQ Global Positive | .38*** | .16* | .20** |
| AEQ Soc./Phys. Pleasure | 37*** | .13* | 20** | |
| AEQ Sexual Enhance | .46*** | .09 | .34*** | |
| AEQ Aggression | .28*** | .24*** | .23*** | |
| AEQ Social Express | .56*** | .20** | .26*** | |
| AEQ Relaxation | .43*** | .14* | .13* | |
| AEQ Cognitive & Physical Impairment | .16* | .04 | .08 | |
| AEQ Careless Unconcern | .45*** | .22*** | .28*** | |
Only included in part of Time 1 data collection, n = 130
Only included in part of Time 1 data collection, n = 42
bold type = significant positive correlation predicted
italics = non-significant positive or significant/non-significant negative correlation predicted
regular type = no prediction
Statistically significant at p < .05 level
Statistically significant at p < .01 level
Statistically significant at p < .001 level
Drinking-induced disinhibition was posited as a set of drinking-related experiences that diverge from one’s everyday life. Accordingly, non-significant associations were expected with sensation seeking for all subscales, assuming that one would be less disinhibited by alcohol if one is already a risk-taker in everyday life. Along similar lines, it was predicted that the euphoric/social subscale would not be significantly correlated with extraversion. It was expected that the dysphoric score would not be significantly associated with ratings of depression. Also, negative or non-significant positive associations were expected between dysphoric disinhibition and both enhancement and social motives on the assumption that dysphoric disinhibition contradicts these motives. No significant correlations were expected between sexual disinhibition and reported number of sexual encounters in the past year. As predicted, euphoric/social disinhibition was not significantly correlated with extraversion. The correlation between euphoric/social and sensation seeking was slightly higher than expected. The non-significant correlation between dysphoric disinhibition and sensation seeking conformed to predictions, although the correlations dysphoric disinhibition had with social and enhancement motives were higher than expected. The significant correlation between dysphoric disinhibition and depression was also higher than expected. As predicted, sexual disinhibition was not significantly correlated with number of sexual encounters in the past year. Against predictions, the association between sexual disinhibition and sensation seeking was significant.
3.1.3 Criterion Validity
As shown in Table 3, associations were examined between DIDS scores at Time 1 and criterion validity measures (i.e., RAPI score and frequency of heavy episodic drinking) at Time 1 and at Time 2. Weekly frequency of heavy episodic drinking remained stable from Time 1 (M = 0.95, SD = 0.89) to Time 2 (M = 0.97, SD = 0.88), while reports of alcohol-related problems declined somewhat from Time 1 (M = 5.68, SD = 4.10) to Time 2 (M = 4.98, SD = 4.68). Sexual disinhibition had the strongest correlation with heavy episodic drinking at both Time 1 and Time 2. Associations between euphoric/social and heavy episodic drinking were smaller but still significant at both time points and there were no significant correlations between dysphoric and heavy episodic drinking. Euphoric/social and dysphoric had the same correlation with alcohol-related problems at Time 1. While the association between alcohol-related problems and euphoric/social remained stable, the association with dysphoric declined at Time 2. The association with sexual was significant at both time points with a small increase at Time 2.
Table 3.
Correlations between DIDS Subscales at Time 1 and Criterion Validity Measures at Time 1 and Time 2 (Study I)
| DIDS Subscale | |||||||||||||
|---|---|---|---|---|---|---|---|---|---|---|---|---|---|
| Euphoric/Social at Time 1 | Dysphoric at Time 1 | Sexual at Time 1 | |||||||||||
| Zero Order | Partial SM | Partial CM | Partial EM | Zero Order | Partial SM | Partial CM | Partial EM | Zero Order | Partial SM | Partial CM | Partial EM | ||
| Criterion Measures at Time 1 (N = 337) | Heavy episodic drinkinga | .21*** | .17** | .13* | .02 | .04 | .02 | .02 | −.02 | .32*** | .28*** | .26*** | .22*** |
| Alcohol-Related Probsb | .33*** | .14* | .09 | .11 | 33*** | .26*** | .23*** | .26*** | .22*** | .01 | −.01 | .00 | |
| Criterion Measures at Time 2 (N = 203) | Heavy episodic drinkinga | .21** | .14* | .14 | .02 | .06 | .02 | .02 | −.02 | .32*** | .26*** | .26*** | .21** |
| Alcohol-Related Probsb | .30*** | .12 | .07 | .07 | .25*** | .16* | .14 | .15* | .28*** | .10 | .08 | .09 | |
Gender was held constant in all partial correlations involving heavy episodic drinking
Gender and log transformed weekly alcohol consumption were held constant in all partial correlations involving alcohol-related problems
Partial SM: Partial correlation also holding social motives score constant
Partial CM: Partial correlation also holding coping motives score constant
Partial EM: Partial correlation also holding enhancement motive scores constant
Statistically significant at p < .05 level
Statistically significant at p < .01 level
Statistically significant at p < .001 level
In incremental validity analyses, associations between euphoric/social and heavy episodic drinking at Time 1 and Time 2 declined but remained significant when holding social or coping motives constant, but were no longer significant when holding enhancement motives constant (Table 3). Associations between sexual disinhibition and heavy episodic drinking at Time 1 and Time 2 remained significant when holding any of the three drinking motives constant. Holding gender, drinking motives and weekly consumption constant, associations between euphoric/social and alcohol-related problems declined considerably. The same was true for sexual disinhibition. Associations between dysphoric disinhibition and alcohol-related problems declined but tended to remain significant, particularly at Time 1.
3.1.4. Cluster Analysis
According to Morral and colleagues’ (1997) approach, four was the largest number of clusters that could be formed based on DIDS subscale scores at Time 1. All clusters were typified by high euphoric/social scores with the exception of Cluster 2, which featured low mean scores for all three DIDS subscales (see Figure 1). The high euphoric/social scores were paired with relatively high dysphoric scores in Cluster 1 and relatively high sexual scores in Cluster 3. In the largest cluster—Cluster 4—only euphoric/social scores were high. One-way ANOVAs were used to compare heavy episodic drinking and alcohol-related problems by cluster membership. A One-way ANOVA indicated significant differences in heavy episodic drinking across clusters at Time 1, F (3, 328) = 6.77, p < .001. The high euphoria/social and sexual cluster reported the most heavy episodic drinking (see Figure 2). A One-way ANOVA indicated significant differences in alcohol-related problems across clusters at Time 1, F (3, 333) = 14.72, p < .001. The high euphoric/social and dysphoric cluster reported the most alcohol-related problems (see Figure 3).
Figure 1.
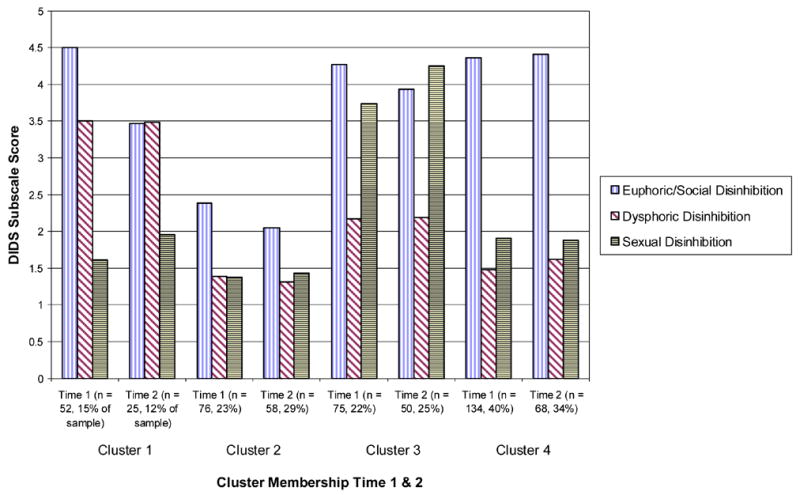
DIDS subscale score by cluster membership at Time 1 and Time 2
Figure 2.
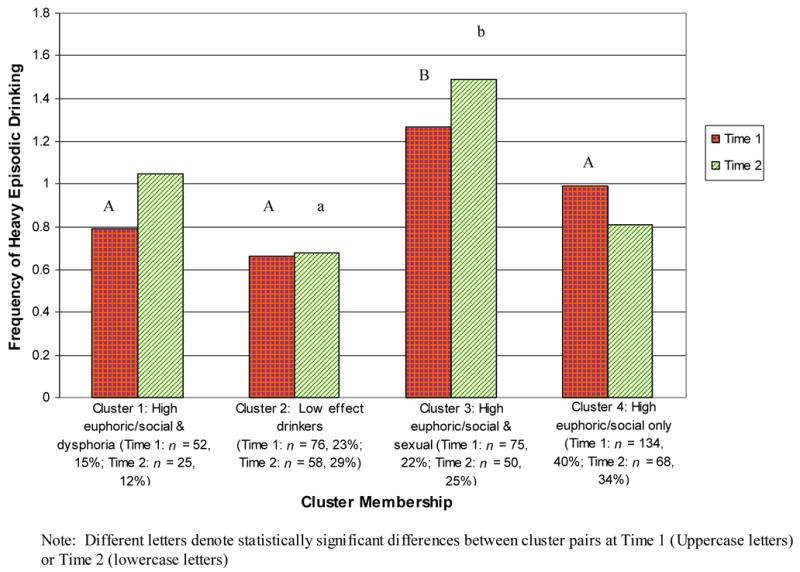
Heavy episodic drinking by disinhibition profile at Time 1 and Time 2
Figure 3.
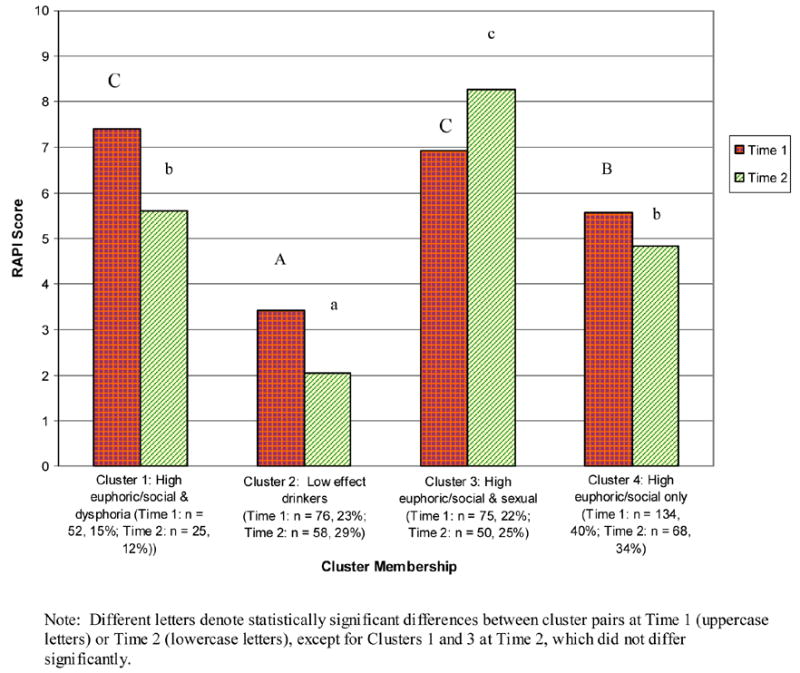
Alcohol-related problems by disinhibition profile at Time 1 and Time 2
The same procedure was repeated with Time 2 data. Clustering was very similar to Time 1 (see Figure 1). The high euphoric/social and dysphoric cluster had a lower mean euphoric/social score at Time 2 than at Time 1. There was a small decrease in mean euphoric/social score in the high euphoric/social and sexual cluster from Time 1 to Time 2 and in the same cluster, mean sexual disinhibition score increased. One-way ANOVA’s indicated significant differences across clusters in both heavy episodic drinking, F (3, 197) = 9.70, p < .001 and in alcohol-related problems, F (3, 197) = 20.66, p < .001. The high euphoric/social and sexual cluster again reported the highest frequency of heavy episodic drinking and at Time 2, also reported the most alcohol-related problems (see Figure 2).
Overall, 45.3% of participants completing both the Time 1 and Time 2 assessments remained in the same cluster at both time points. The low effect (57.8% remaining in the same cluster from Time 1 to Time 2) and high euphoric/social and sexual clusters (57.5% remaining in the cluster) were the most stable, followed by the high euphoric/social only cluster (41.7% stable) and the high euphoric/social and dysphoric cluster (21.9% stable). Of those classified as high euphoric/social only at Time 1, 27.4% shifted to low effect at Time 2, 19% changed to high euphoric/social and sexual and 11.9% went to high euphoric/social and dysphoric. Of those classified as high euphoric/social and dysphoric at Time 1, a majority (53.1%) shifted to high euphoric/social only at Time 2.
3.2 Study II
3.2.1 Confirmatory Factor Analysis
Model fit indices for the 3-factor model found with principal components analysis were: [χ2 (1, 24) = 46.19, p = .004], GFI = 0.96, NNFI = 0.96, CFI = 0.97, SRMR = 0.05, and RMSEA = 0.06. Although the chi-square for this model was significant, with large samples and real world data, the chi-square value is often significant even when the model provides an acceptable representation of the data (Floyd & Widaman, 1995; Hatcher, 1994). Each of the indices that should approach “unity” (i.e., the GFI, NNFI, & CFI) appeared adequate. In addition, the SRMR and the RMSEA were each lower than the cutoff value of .08, indicating an acceptable fit.
Factor structure coefficients were also used to assess the factor structure of the DIDS, and the standardized factor loadings of the scale are presented in Table 1. It has been suggested that factor loadings above .30 are meaningful (Floyd & Widaman, 1995) and all of the items far surpass this criterion. To assess convergence of manifest indicators on a common factor, t tests were conducted on the factor loadings for this confirmatory model. When a t value is greater than 2.0, it suggests that the item is an important component of the stated factor (Jöreskog & Sörbom, 1993). The range of t values was 9.02 to 15.20. Since all t values were above 2.0, this suggests that all items are likely measuring a common construct.
3.2.2 Reliability
Descriptives and internal consistency reliability for the individual subscales were as follows: euphoric/social (M = 3.86, SD = 1.02, alpha = 0.65), dysphoric (M = 2.19, SD = 1.02, alpha = 0.81) and sexual (M = 2.55, SD = 1.25, alpha = 0.80).
3.2.3 Convergent and Discriminant Validity
In terms of convergent validity, all three DIDS subscales were expected to be significantly and positively correlated with the careless unconcern subscale of the AEQ, given that the items in this subscale assess beliefs about experiences that could be described as disinhibiting albeit in a negatively valenced manner (e.g., “alcohol makes me careless about my actions”). Strong positive correlations were expected between sexual disinhibition and the sexual enhancement subscale of the AEQ. Euphoric/social scores were predicted to be significantly and positively correlated with the global positive, social expressiveness and social/physical pleasure subscales of the AEQ. For discriminant validity, the reverse associations were expected with the dysphoric disinhibition subscale (see Table 2).
As predicted, all three DIDS subscales—particularly euphoric/social—were significantly correlated with the careless unconcern subscale of the AEQ (see Table 2). Euphoric/social scores were significantly correlated with the global positive, social expressiveness and social/physical pleasure subscales of the AEQ as predicted. Also in accordance with our predictions, sexual disinhibition was significantly correlated with the sexual enhancement subscale of the AEQ. Associations between dysphoric scores and the global positive, social/physical pleasure and social expressiveness subscales of the AEQ were not non-significant as predicted, but were nonetheless small and borderline significant. There were a number of significant correlations that were not predicted, although most of these were in the 0.20–0.28 range with the exception of associations between euphoric/social and the sexual enhancement and relaxation subscales.
4. General Discussion
The Drinking-Induced Disinhibition Scale (DIDS) is the first scale devoted entirely to assessing disinhibiting effects of alcohol use. The structure of the majority of items in the measure, expressly contrasting alcohol-induced states with non-alcohol-induced states enhances the face validity of the DIDS as a measure of disinhibition. The euphoric/social subscale measures the types of excitatory effects that are typically associated with alcohol-induced disinhibition. Significant correlations between this subscale and coping motives in Study I and with relaxation expectancies in Study II, while not predicted, suggest that the experience of euphoric/social disinhibition offers a release from life stressors. The significant correlation between dysphoric disinhibition and depression does not rule out the possibility that the dysphoric effects captured in the DIDS are disinhibiting. Most of the symptoms assessed in the depression subscale of the Symptom Checklist (Derogatis et al., 1973) (e.g., “feeling low in energy or slowed down,” “feeling blue”) do not involve outward expression of negative affect as in the dysphoric disinhibition subscale. Thus, many individuals who regularly experience dysphoria or depression will require alcohol before outwardly manifesting negative affect. While only one of the items in the sexual subscale expressly contrasted alcohol-induced with non-alcohol-induced states, the strong correlation with reports of alcohol-related sexual encounters but not with sexual activity in general points to the conclusion that this subscale assesses sexual disinhibition specifically.
Principal component analyses with oblique and varimax rotation in Study I and a confirmatory factor analysis in Study II clearly supported a three-factor structure for the DIDS. This contrasted slightly with expectations in that the euphoric and social items loaded onto one factor rather than two separate factors as we expected. All items had high factor loadings on their respective subscales. The three subscales were found to have good internal consistency reliability in both Study I and Study II and adequate test-retest reliability in Study I.
The measure was shown to have both concurrent and predictive validity given its associations with Time 1 and Time 2 alcohol-related problems and heavy episodic drinking. The three subscales had differential associations with these variables. Sexual disinhibition had the strongest associations with heavy episodic drinking at Time 1 and Time 2, followed by euphoric/social with dysphoric having almost no association. Dysphoric effects are not likely to be experienced as reinforcing, making it unlikely that individuals will engage in heavy episodic drinking to experience or to extend these effects. In contrast, sexual and euphoric/social disinhibition are likely to be experienced as reinforcing, potentially increasing the likelihood of heavy drinking. These findings are in accordance with the expectancies literature. Positively-valenced expectancies tend to be positively correlated with heavy drinking whereas negatively-valenced expectancies tend to be negatively correlated with heavy drinking (Jones et al., 2001). While associations between DIDS subscale scores and criterion validity measures declined in the incremental validity analyses, unique variance in heavy episodic drinking at both Time 1 and Time 2 was explained by sexual disinhibition and to a lesser extent by euphoric/social disinhibition. Unique variance in alcohol-related problems was explained by dysphoric disinhibition, particularly at Time 1. Some degree of overlap between disinhibiting effects and drinking motives was expected, similar to the high degree of overlap observed between expectancies and motives measures (Read et al., 2003).
Reports of euphoric/social disinhibition decreased from Time 1 to Time 2. Notably, these decreases could be observed in all clusters except for the high euphoric/social only cluster. Perhaps for students other than those in this cluster, euphoric/social disinhibition typified a period of experimentation with new patterns of alcohol use upon entering college, the experience of which tended to decline by the second year. It is important to note though that euphoric/social had stable, significant positive correlations with alcohol-related problems. These correlations are in line with the expectancies literature where positive expectancies have been linked consistently with alcohol-related problems (Jones et al., 2001). Dysphoric disinhibition was also significantly associated with alcohol-related problems at Time 1 and 2, although the strength of this association declined between the two time points. These findings are in accordance with Young and colleagues (2004), who found that a subset of their alcohol dependent patients (who presumably had experienced many alcohol-related problems) had expectations of negative affect when they drank. Unlike the dysphoric subscale, associations between alcohol-related problems and the sexual subscale increased, paralleling increases in reports of sexual disinhibition from Time 1 to Time 2. Overall, the concurrent and predictive validity findings suggest that the types of disinhibiting effects one typically experiences can help to predict likelihood of heavy episodic drinking and alcohol-related problems.
Results of the cluster analysis suggest that undergraduate drinkers fall into distinguishable profiles based on the types of disinhibition they typically experience and that these disinhibition profiles predicted heavy episodic drinking and alcohol related problems at both Time 1 and Time 2. The high euphoric/social and sexual cluster showed the most consistently high level of problem drinking risk. The increases in both heavy episodic drinking and alcohol-related problems in this cluster between Time 1 and Time 2 are of particular interest. Frequency of heavy episodic drinking was similar between the high euphoric/social and dysphoric cluster and the high euphoric/social only cluster at both time points. While the former cluster reported more alcohol-related problems at Time 1, these levels converged at Time 2. It may be that most students reporting high levels of dysphoric disinhibition at Time 1 found this experience aversive and changed accordingly, in most cases to the euphoric/social only cluster with a small minority of students reporting high dysphoric disinhibition at both time points. This is in accordance with Baer’s (2002) contention that a small minority of undergraduates can be classified as negative affect drinkers. The euphoric/social only cluster appeared to be something of a drinking “weigh station” with about 2/5th of students remaining in the cluster with the others scattered across the other three clusters at Time 2. While less than half of the sample remained in the same cluster from Time 1 to Time 2, the level of problem drinking risk associated with each cluster tended to be similar at both time points. Differences between students who remain in clusters versus those who shift would make an interesting topic for future research. The cluster analysis findings reveal the important clinical implications of the scale, showing that the DIDS may potentially be used as a screening tool, targeting which undergraduates are at risk for different types of disinhibiting effects. Treatments could then be tailored to meet the needs of these students.
Convergent validity conformed to predictions to a greater extent than discriminant validity. Associations with motives for drinking in Study I mainly conformed to expectations and as predicted, sexual disinhibition was associated with the percentage of one’s sexual activity that was alcohol-related. While convergent validity associations with expectancies subscales in Study II largely emerged as predicted, a number of associations we did not predict were also significant. Convergent validity correlations with euphoric/social were higher than with the other two subscales suggesting that this subscale may overlap with positively-valenced motives for drinking and expectancies to a greater extent than dysphoric or sexual disinhibition do.
The overall prediction was that the DIDS would not be significantly associated with participants’ affect and behavior when not drinking, given that drinking-induced disinhibition should differ from one’s typical patterns. Accordingly, sexual disinhibition was not significantly associated with overall amount of sexual activity in the past year and euphoric/social disinhibition was not significantly associated with extraversion. Other discriminant validity findings did not adhere as closely to predictions. Non-significant associations with sensation seeking applied to the dysphoric subscale as predicted, but not to euphoric/social and particularly not to sexual disinhibition. Although contrary to predictions, the significant correlation between sensation seeking and sexual disinhibition conforms to prior findings relating sensation seeking with alcohol consumption and with risky sexual behavior (Justus et al., 2000). Other measures of trait disinhibition such as trait impulsivity could be included in subsequent studies to further validate the measure. A pattern of findings similar to correlations with sensation seeking would be expected with sexual disinhibition having stronger correlations with trait impulsivity than the other two subscales.
This study had a number of limitations, including the recruitment of participants from a university with highly selective admissions and the high proportion of females in the sample, both of which may limit the generalizability of the results. Another limitation is the modest response rates for the Time 2 assessment in Study I and the differences between responders and non-responders in overall weekly alcohol consumption and alcohol-related problems. It is important to note though that the sample completing the Time 2 follow-up was nonetheless comprised of many heavy drinkers, consuming between 12–13 drinks per week on average and endorsing an average of 5–6 alcohol-related problems.
A number of future directions for research are suggested by the present findings. Continuation of the prospective study with a Senior year follow-up will enable observations of changes in disinhibiting experiences and their associations with high-risk drinking across the 4 years of the undergraduate experience. The moderate test-retest associations for the DIDS subscales suggest a degree of variability in the types of disinhibitory experiences one reports as a result of drinking. A daily diary study would help to address whether the circumstances of their daily lives (e.g., stress) influence the types of disinhibiting effects students report when they drink. The moderate correlations between euphoric/social and dysphoric disinhibition along with the emergence of a cluster with high scores on both strongly suggests that these effects are not mutually exclusive. While a daily diary study would permit conclusions as to whether drinkers tend to experience primarily one type of disinhibition per drinking day, an alcohol challenge study would allow for a determination of whether different types of disinhibition are more or less common during the ascending or descending limbs of the blood-alcohol curve. Our prediction would be that euphoric/social disinhibition would be more common on the ascending limb with dysphoric disinhibition being more common on the descending limb (Dunn & Earlywine, 2001).
Acknowledgments
Thanks to Paul Rozin, Melanie Green and special thanks to Ingrid Waldron, whose advice regarding statistical analyses and interpretation of the findings was invaluable. Thanks also to Bob Gallop for statistical advice and to Will Corbin, Stephanie O’Malley and anonymous reviewers for helpful comments on earlier drafts of the manuscript.
Footnotes
One concern when computing the Root Mean Square Residual (RMR), which uses the covariance matrix, is that it is calculated using unstandardized variables. Consequently, its range is dependent upon the scales of the observed variables. However, the Standardized Root Mean Square Residual (SRMR) uses the correlation matrix to compute a measure of the mean absolute correlation residual, which is the difference between predicted and observed correlations (Kline, 2005). Therefore, the correlation matrix was used to compute the SRMR.
This research was supported by NIAAA grant # F31 AA14743 to R. Leeman and R. Leeman received support from NIDA grant # T32 DA07238 during the drafting of the manuscript.
Publisher's Disclaimer: This is a PDF file of an unedited manuscript that has been accepted for publication. As a service to our customers we are providing this early version of the manuscript. The manuscript will undergo copyediting, typesetting, and review of the resulting proof before it is published in its final citable form. Please note that during the production process errors may be discovered which could affect the content, and all legal disclaimers that apply to the journal pertain.
References
- Baer JS. Student factors: Understanding individual variation in college drinking. Journal of Studies on Alcohol. 2002;(Supplement No 14):40–54. doi: 10.15288/jsas.2002.s14.40. [DOI] [PubMed] [Google Scholar]
- Bentler PM. Comparative fit indexes in structural models. Psychological Bulletin. 1990;107:238–246. doi: 10.1037/0033-2909.107.2.238. [DOI] [PubMed] [Google Scholar]
- Bentler PM, Bonett DG. Significance tests and goodness of fit in the analysis of covariance structures. Psychological Bulletin. 1980;88:588–606. [Google Scholar]
- Brown MW, Cudeck R. Alternative ways of assessing model fit. In: Bollen KA, Long JS, editors. Testing structural equation models. Newbury Park, CA: Sage; 1993. pp. 136–162. [Google Scholar]
- Brown SA, Goldman MS, Inn A, Anderson LR. Expectations of reinforcement from alcohol: Their domain and relation to drinking patterns. Journal of Consulting and Clinical Psychology. 1980;48:419–426. doi: 10.1037//0022-006x.48.4.419. [DOI] [PubMed] [Google Scholar]
- Clark DB, Cornelius JR, Kirisci L, Tarter RE. Childhood risk categories for adolescent substance involvement: A general liability typology. Drug and Alcohol Dependence. 2005;77:13–21. doi: 10.1016/j.drugalcdep.2004.06.008. [DOI] [PubMed] [Google Scholar]
- Connors GJ, O’Farrell TJ, Cutter HS, Thompson DL. Alcohol expectancies among male alcoholics, problem drinkers, and non-problem drinkers. Alcoholism: Clinical & Experimental Research. 1986;10:667–671. doi: 10.1111/j.1530-0277.1986.tb05165.x. [DOI] [PubMed] [Google Scholar]
- Cooper ML. Motivations for alcohol use among adolescents: Development and validation of a four-factor model. Psychological Assessment. 1994;6:117–128. [Google Scholar]
- Cooper ML, Russell M, Skinner JB, Windle M. Development and validation of a three-dimensional measure of drinking motives. Psychological Assessment. 1992;4:123–132. [Google Scholar]
- Derogatis LR, Lipman RS, Covi L. SCL-90, an outpatient psychiatric rating scale—preliminary report. Psychopharmacology Bulletin. 1973;9:13–28. [PubMed] [Google Scholar]
- Dunn ME, Earlywine M. Activation of alcohol expectancies in memory in relation to limb of the blood alcohol curve. Psychology of Addictive Behaviors. 2001;15:18–24. doi: 10.1037/0893-164x.15.1.18. [DOI] [PubMed] [Google Scholar]
- Eysenck HJ. A short questionnaire for the measurement of two dimensions of personality. Journal of Applied Psychology. 1958;42:14–17. [Google Scholar]
- Floyd FJ, Widaman KF. Factor analysis in the development and refinement of clinical assessment instruments. Psychological Assessment. 1995;7:286–299. [Google Scholar]
- Fromme K, D’Amico EJ, Katz EC. Intoxicated sexual risk taking: An expectancy or cognitive impairment explanation. Journal of Studies on Alcohol. 1999;60:54–63. doi: 10.15288/jsa.1999.60.54. [DOI] [PubMed] [Google Scholar]
- Goldstein RZ, Volkow ND. Drug addiction and its underlying neurobiological basis: Neuroimaging evidence for the involvement of the frontal cortex. American Journal of Psychiatry. 2002;159:1642–1652. doi: 10.1176/appi.ajp.159.10.1642. [DOI] [PMC free article] [PubMed] [Google Scholar]
- Hatcher L. A step-by-step approach to using the SAS system for factor analysis and structural equation modeling. Cary, NC: SAS Institute Inc; 1994. [Google Scholar]
- Hatcher L, Stepanski EJ. A step-by-step approach to using the SAS system for univariate and multivariate statistics. Cary, NC: SAS Institute; 1994. [Google Scholar]
- Hu L, Bentler PM. Cutoff criteria for fit indexes in covariance structure analysis: Conventional versus new alternatives. Structural Equation Modeling. 1999;6:1–55. [Google Scholar]
- Jentsch JD, Taylor JR. Impulsivity resulting from frontostriatal dysfunction in drug abuse: Implications for the control of behavior by reward-related stimuli. Psychopharmacology. 1999;146:373–390. doi: 10.1007/pl00005483. [DOI] [PubMed] [Google Scholar]
- Jones BT, Corbin W, Fromme K. A review of expectancy theory and alcohol consumption. Addiction. 2001;96:57–72. doi: 10.1046/j.1360-0443.2001.961575.x. [DOI] [PubMed] [Google Scholar]
- Jöreskog KG, Sörbom D. LISREL 8 User’s Reference Guide. Chicago: Scientific Software; 1993. [Google Scholar]
- Justus AN, Finn PR, Steinmetz JE. The influence of traits of disinhibition on the association between alcohol use and risky sexual behavior. Alcoholism: Clinical and Experimental Research. 2000;24:1028–1035. [PubMed] [Google Scholar]
- Kaiser HF. The application of electronic computers to factor analysis. Educational and Psychological Measurement. 1960;20:141–151. [Google Scholar]
- Kline RB. Principles and Practice of Structural Equation Modeling. 2. New York: The Guilford Press; 2005. [Google Scholar]
- Labouvie E, Bates ME. Reasons for alcohol use in young adulthood: Validation of a three-dimensional measure. Journal of Studies on Alcohol. 2002;63:145–155. doi: 10.15288/jsa.2002.63.145. [DOI] [PubMed] [Google Scholar]
- Leeman RF, Wapner S. Some factors involved in alcohol consumption of first-year undergraduates. Journal of Drug Education. 2001;31:249–262. doi: 10.2190/T3HB-7J57-KG3T-3BL0. [DOI] [PubMed] [Google Scholar]
- Lyvers M. “Loss of control” in alcoholism and drug addiction: A neuroscientific interpretation. Experimental and Clinical Psychopharmacology. 2000;8:225–240. doi: 10.1037//1064-1297.8.2.225. [DOI] [PubMed] [Google Scholar]
- Mayr E. The growth of biological thought. Cambridge, MA: Belknap Press; 1982. [Google Scholar]
- McDonald RP, Ho MHR. Principles and practice in reporting structural equation analyses. Psychological Methods. 2002;7:64–82. doi: 10.1037/1082-989x.7.1.64. [DOI] [PubMed] [Google Scholar]
- Morral AR, Iguchi MY, Belding MA, Lamb RJ. Natural classes of treatment response. Journal of Counseling and Clinical Psychology. 1997;65:673–685. doi: 10.1037//0022-006x.65.4.673. [DOI] [PubMed] [Google Scholar]
- Mulaik SA, James LR, Van Alstine J, Bennett N, Lind S, Stilwell CD. Evaluation of goodness-of-fit indices for structural equation models. Psychological Bulletin. 1989;105:430–445. [Google Scholar]
- Nagoshi CT, Noll RT, Wood MD. Alcohol expectancies and behavioral and emotional responses to placebo versus alcohol administration. Alcoholism: Clinical and Experimental Research. 1992;16:255–260. doi: 10.1111/j.1530-0277.1992.tb01372.x. [DOI] [PubMed] [Google Scholar]
- National Institute on Alcohol Abuse and Alcoholism. Report of a subcommittee of the National Advisory Council on Alcohol Abuse and Alcoholism on the review of the extramural research portfolio for neuroscience and behavior. [Accessed March 28, 2003];NIAAA website. 1998 May 11; Available at: http://www.niaaa.nih.gov/extramural/report-text.htm.
- Read JP, Wood MD, Kahler CW, Maddock JE, Palfai TP. Examining the role of drinking motives in college student alcohol use and problems. Psychology of Addictive Behaviors. 2003;17:13–23. doi: 10.1037/0893-164x.17.1.13. [DOI] [PubMed] [Google Scholar]
- Rohsenow DJ. Drinking habits and expectancies about alcohol’s effects for self versus others. Journal of Consulting and Clinical Psychology. 1983;51:752–756. doi: 10.1037//0022-006x.51.5.752. [DOI] [PubMed] [Google Scholar]
- SAS Institute, Inc. The SAS System for Windows, Version 9.1. Cary, NC: SAS Institute, Inc; 2003. [Google Scholar]
- Simons JS, Gaher RM, Correia CJ, Hansen CL, Christopher MS. An affective-motivational model of marijuana and alcohol problems among college students. Psychology of Addictive Behaviors. 2005;19:326–334. doi: 10.1037/0893-164X.19.3.326. [DOI] [PubMed] [Google Scholar]
- Southwick L, Steele C, Marlatt A, Lindell M. Alcohol-related expectancies: Defined by phase of intoxication and drinking experience. Journal of Consulting and Clinical Psychology. 1981;49:713–721. doi: 10.1037//0022-006x.49.5.713. [DOI] [PubMed] [Google Scholar]
- White HR, Labouvie EW. Towards the assessment of adolescent problem drinking. Journal of Studies on Alcohol. 1989;50:30–37. doi: 10.15288/jsa.1989.50.30. [DOI] [PubMed] [Google Scholar]
- Wood MD, Nagoshi CT, Dennis DA. Alcohol norms and expectations as predictors of alcohol use and problems in a college student sample. American Journal of Drug and Alcohol Abuse. 1992;18:461–476. doi: 10.3109/00952999209051042. [DOI] [PubMed] [Google Scholar]
- Young R, Knight RG. The Drinking Expectancy Questionnaire (DEQ): A revised questionnaire of alcohol related beliefs. Journal of Psychopathology and Behavioral Assessment. 1989;11:99–112. [Google Scholar]
- Young RM, Lawford BR, Feeney GFX, Ritchie T, Noble EP. Alcohol-related expectancies are associated with the D2 dopamine receptor and GABAA receptor 3 subunit genes. Psychiatry Research. 2004;127:171–183. doi: 10.1016/j.psychres.2003.11.004. [DOI] [PubMed] [Google Scholar]
- Zuckerman M. Sensation seeking: Beyond the optimum level of arousal. Mahwah, NJ: Lawrence Erlbaum; 1994. [Google Scholar]