

Abstract
Synthesis, storage and release of acetylcholine (ACh) require the expression of several specialized enzymes, including choline acetyltransferase (ChAT), vesicular acetylcholine transporter (VAChT) and the high-affinity choline transporter (CHT). Extracellular factors that regulate CHT expression and their signaling pathways remain poorly characterized. Using the NSC-19 cholinergic cell line, derived from embryonic spinal cord, we compared the effects of the second messenger cAMP on the expression of CHT and the cholinergic locus containing the ChAT and VAChT genes. Treatment of NSC-19 cells with dbcAMP and forskolin, thus increasing intracellular cAMP levels, significantly reduced CHT mRNA expression, while it upregulated ChAT/VAChT mRNA levels and ChAT activity. The cAMP-induced CHT downregulation was independent of PKA activity, as shown in treatments with the PKA inhibitor H-89. The alternative Epac-Rap pathway, when stimulated by a specific Epac activator, led to significant downregulation of CHT and ChAT, and, to a lesser extent, VAChT. In contrast, the PKA activator 6-BNZ-cAMP stimulated the expression of all three genes, but with varying concentration-dependence profiles. Our results indicate that elevations of intraneuronal cAMP concentration have differential effects on the cholinergic phenotype, depending on the involvement of different downstream effectors. Interestingly, although CHT is expressed predominantly in cholinergic cells, its regulation appears to be distinct from that of the cholinergic locus.
Keywords: choline acetyltransferase, vesicular acetylcholine transporter, protein kinase A, Epac, motor neuron, NSC-19 cells
1. INTRODUCTION
Choline is an essential nutrient and plays a critical role in the development and function of the brain (Blusztajn, 1998). It is the precursor of membrane components, such as phosphatidylcholine and sphingomyelin, as well as of signaling molecules (e.g. diacylglycerol and ceramide) and of the neurotransmitter acetylcholine (ACh). Choline does not permeate cell membranes and therefore requires a carrier-mediated transport system. Choline for synthesis of membrane lipids is transported by a ubiquitous low-affinity transport system, while in cholinergic neurons, choline is taken up by a high-affinity choline transporter, termed CHT, which is localized in the presynaptic terminals. This high-affinity choline uptake is Na+- and Cl−-dependent, sensitive to hemicholinium-3 (HC-3), and is thought to be the rate-limiting step in ACh synthesis (Okuda and Haga, 2003). CHT is a member of the SLC5 family of mammalian Na+-dependent transporters and is designated in humans as SLC5A7 (solute carrier family 5, member 7). Molecular cloning of several mammalian cDNAs encoding CHT enabled studies on CHT cellular distribution and regulation (Apparsundaram et al., 2001; Apparsundaram et al., 2000; Oda et al., 2004; Okuda et al., 2000). Northern blot analysis revealed that CHT mRNA is expressed as a single transcript of ~5kb, with the highest expression detected in regions that are rich in cholinergic cell bodies, such as the spinal cord, brainstem and forebrain. We demonstrated recently that CHT mRNA is expressed very early in mouse development, predominantly in the regions containing cholinergic neurons (Berse et al., 2005). The earliest and strongest expression was observed in the spinal cord, where CHT mRNA was present at close to adult levels on embryonic day 14 (E14) and showed almost no changes after birth. This is in contrast to the expression of choline acetyltransferase (ChAT) mRNA, which significantly increases during postnatal development. The overall pattern of CHT expression in development points to CHT mRNA, alongside that of vesicular acetylcholine transporter (VAChT), as an important marker of early cholinergic differentiation. However, transient CHT expression occurs also in other parts of the CNS (e.g. cerebellum). Moreover, it was shown in recent studies, that CHT is expressed in several non-neuronal tissues, such as the rat trachea, rat and human arteries, rat placenta as well as rat and human skin (Haberberger et al., 2002; Lips et al., 2002; Lips et al., 2003; Pfeil et al., 2003a; Pfeil et al., 2003b).
The mechanisms that regulate CHT expression still remain largely unknown. It has been shown that CHT and ChAT are coordinately upregulated in superior cervical ganglia when treated with LIF (Lecomte et al., 2005). We observed simultaneous upregulation of CHT and VAChT when primary septal cells were exposed to NGF (Berse et al., 2005). Moreover, this action of NGF was prevented through inhibition of the PI3K-pathway, indicating that this signaling pathway mediates the stimulatory effect of NGF on CHT expression, as it does on the expression of the cholinergic locus containing the ChAT and VAChT genes (Berse et al., 2005; Madziar et al., 2005). This coordinated upregulation led to the suggestion that the two genes may be characterized by comparable regulatory genomic regions. However, there is also growing evidence that the regulation of CHT and the cholinergic locus are not identical. Treatment of superior cervical ganglia neurons with retinoic acid resulted in a significant downregulation of CHT, while ChAT expression was increased (Lecomte et al., 2005). Furthermore, treatment of primary septal cells with 0.1 μM retinoic acid had no effect on CHT mRNA expression, whereas VAChT expression was increased (Berse et al., 2005). Another example of differential regulation of CHT in comparison to ChAT was observed in ChAT heterozygotes, where ChAT expression is reduced by 50% and CHT is significantly upregulated (Brandon et al., 2004).
Cyclic AMP (cAMP) is a second messenger that is produced from ATP by adenylyl cyclase in response to a variety of extracellular signals such as hormones, growth factors and neurotransmitters. It regulates a number of different cellular processes including metabolism, cell growth, cell shape and differentiation, ion channel conductivity, synaptic release of neurotransmitters, and gene transcription (Chin et al., 2002; Kopperud et al., 2003; Skalhegg and Tasken, 2000). Furthermore, cAMP plays an important role in various neuronal functions, including survival (Bok et al., 2003; Rydel and Greene, 1988), modulation of axonal guidance (Ming et al., 1997; Nishiyama et al., 2003) and enhancement of neurite outgrowth (Chijiwa et al., 1990; Kao et al., 2002). Additionally, it has been reported that cAMP upregulates the expression of the cholinergic locus in neuroblastoma x glioma NG108-15 hybrid cells (Castell et al., 2003; Misawa et al., 1993), PC12 cells (Shimojo et al., 1998) and the murine septal cell line SN56 (Berse and Blusztajn, 1995). Several lines of evidence revealed that the effects of cAMP on transcription of the cholinergic locus are mediated by the protein kinase A (PKA, cAPK) signaling pathway in PC12 cells and in NG108-15 cells (Quirin-Stricker et al., 1997; Shimojo et al., 1998). Another pathway activated by cAMP utilizes the exchange proteins directly activated by cAMP (Epacs) (de Rooij et al., 1998), also designated as RapGEF3/4 or cAMP-GEF1/2 (Kawasaki et al., 1998). Epacs are guanine exchange factors for the Ras-like small GTPases Rap1 and Rap2, and they also signal through the Ras-related protein Rit (Shi et al., 2006). Northern blotting revealed ubiquitous expression of Epac1 in human solid tissues (i.e. not in peripheral blood leukocytes or bone marrow), with the highest levels found in kidney, ovary, thyroid, heart and spinal cord (de Rooij et al., 1998; Kawasaki et al., 1998). Overall expression in the brain is much lower, but locally high in specific regions (i.e. cortex, amygdala, caudate nucleus and corpus callosum). Broad, low-level expression was also detected in rat brain by in situ hybridization (Kawasaki et al., 1998). Human Epac2 is predominantly expressed in the adrenal gland and the brain, with the highest levels present in the cortex (frontal lobe, temporal lobe, occipital pole), amygdala, putamen, hippocampus, and cerebellum. In situ hybridization analysis demonstrated strong expression of Epac2 in mature as well as developing rat brain, with high levels in the cerebral cortex, hippocampus, habenula, and cerebellum (Kawasaki et al., 1998). This pattern of expression suggests a role for Epac signaling in the nervous system. Independently, Rap has been strongly implicated in the control of neuronal differentiation in the pheochromocytoma PC12 cell model (Vaudry et al., 2002; York et al., 1998).
In this paper, we studied the effects of cAMP signaling pathways on CHT, ChAT and VAChT expression in the mouse spinal cord-derived NSC-19 cells. We demonstrate that, in contrast to the cholinergic locus, the CHT gene is downregulated by cAMP, in a manner dependent on the Epac pathway, but not on the PKA pathway.
2. RESULTS
1. Effect of cAMP on CHT and cholinergic locus expression
In vivo, the spinal cord is one of the major sites of CHT expression (Apparsundaram et al., 2001; Apparsundaram et al., 2000; Oda et al., 2004; Okuda et al., 2000; (Berse et al., 2005). Therefore, we used the spinal cord-derived cell line NSC-19 as a model for studies on CHT regulation. NSC-19 cells exhibit many of the morphological and physiological properties of primary motor neurons, including expression of several neurofilament proteins and formation of neurites, generation of action potentials in response to electrical stimulation, and establishment of synapses with co-cultured myotubes (Cashman et al., 1992). Furthermore, they express ChAT, synthesize and store ACh, and are capable of ACh release upon depolarization induced by elevating extracellular K+. In order to study the effects of cAMP signaling on the cholinergic phenotype, we treated NSC-19 cells with various compounds that modulate the cAMP pathway, and then assayed ChAT, VAChT and CHT expression. First, NSC-19 cells were treated with 1 mM dibutyryl-cAMP (dbcAMP) for 72 h. Phase-contrast microscope images taken after 36 h of treatment demonstrate that dbcAMP induced distinct neurite outgrowth, which was already visible two hours after the treatment commenced (Fig. 1A and data not shown). ChAT activity was examined after 72 h of dbcAMP treatment. In agreement with the results obtained with other cell types (Berse and Blusztajn, 1995; Castell et al., 2003; Misawa et al., 1993; Shimojo et al., 1998), ChAT activity was increased by 2-fold in cells stimulated with dbcAMP (Fig. 1B). The dbcAMP treated groups were significantly different from control as determined by a paired t-test (p < 0.005). To evaluate the effect of cAMP on CHT and VAChT mRNA expression, total RNA was isolated and subjected to RT-PCR reactions with PCR primers derived from the CHT and VAChT coding region. Following RT-PCR, the products were separated on an agarose gel and analyzed with the Kodak Image Station Software. To control for total mRNA content in the samples, RT-PCR with mouse β-actin primers was performed in parallel to CHT and VAChT amplification. CHT mRNA levels were downregulated by approximately 45% in cells treated with dbcAMP, whereas VAChT mRNA levels were increased by 43% in the presence of the test compound (Fig. 1C). The treated groups were significantly different from corresponding controls as determined by a paired t-test (p<0.01).
Figure 1. cAMP induces neurite outgrowth and produces differential regulation of CHT and the cholinergic locus expression in NSC-19 cells.
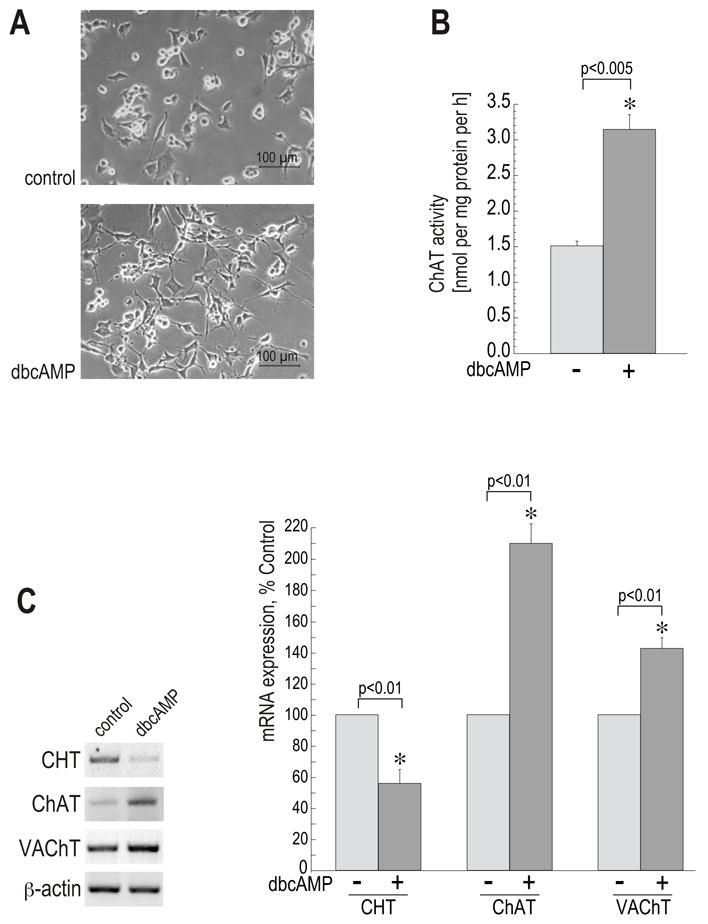
(A) Phase-contrast microscope pictures were taken after 36 h of treatment. Objective lens 20 x. Size bars: 100 μM. (B) ChAT activity was assayed in cell extracts as described in Experimental Procedures. Data are shown in the bar graph as means ± SEM of two independent cultures (each experiment was performed in duplicate). (*) significantly different from corresponding untreated control. (C) Total RNA preparations were subjected to RT-PCR reactions with CHT, ChAT and VAChT primers. RT-PCR with β-actin primers served as a loading control. PCR product band intensities were quantified by the Kodak Image Station Software. Results are expressed as means ± SEM of three experiments. (*) significantly different from corresponding untreated control.
Hydrolysis of dbcAMP yields free butyrate which has been shown to modulate cholinergic properties of cultured neuronal cells (Blusztajn et al., 1992; Casper and Davies, 1989; Prasad and Kumar, 1974; Szutowicz et al., 1983). In order to exclude the possibility that the dibutyryl-compound of the cAMP-derivative was responsible for the observed changes in CHT and VAChT mRNA expression and ChAT activity in NSC-19 cells, the treatment was repeated using forskolin, a cell-permeable diterpenoid that is able to activate adenylyl cyclase, thereby increasing intracellular cAMP concentrations (Seamon and Daly, 1981). First, NSC-19 cells were exposed to different concentrations of forskolin, ranging from 10 to 30 μM, for 72 h. CHT mRNA levels were analyzed by RT-PCR on total RNA preparations. Control RT-PCRs with β-actin primers demonstrated nearly equal content of total mRNA in the samples. The strongest downregulation of CHT expression was obtained with the 30 μM concentration, where the mRNA level was reduced by almost 60% in comparison to control (Fig. 2A). Consequently, the 30 μM forskolin concentration was used in subsequent experiments. The effects of forskolin on CHT and cholinergic locus mRNAs were compared in RT-PCR reactions with CHT, ChAT and VAChT primers (Fig. 2B). Subsequent analysis of the agarose gel images with the Kodak Image Station Software revealed that CHT mRNA expression was reduced by 52% in the presence of forskolin, whereas the ChAT and VAChT mRNA levels were increased by 71% and 35%, respectively, in comparison to the untreated control. The forskolin-treated groups were significantly different from control groups as determined by a paired t-test. The results of the RT-PCR reactions were consistent with the data previously obtained with the dbcAMP treatment. Thus, an increased level of intracellular cAMP induces differential regulation of CHT and cholinergic locus expression in NSC-19 cells. Interestingly, VAChT expression is the least affected by cAMP, in contrast to our findings in the septum-derived cell line SN56, where dbcAMP treatment had a significantly greater effect on the level of VAChT mRNA than on that of ChAT (Berse and Blusztajn, 1995). Furthermore, both dbcAMP and forskolin induced distinct neurite outgrowth in NSC-19 cells, which has been reported previously in other cell lines (Blusztajn et al., 1992; Chijiwa et al., 1990; Gunning et al., 1981; Kao et al., 2002; Kim et al., 2002; Piiper et al., 2002).
Figure 2. Effect of forskolin on CHT and VAChT mRNA expression in NSC-19 cells.
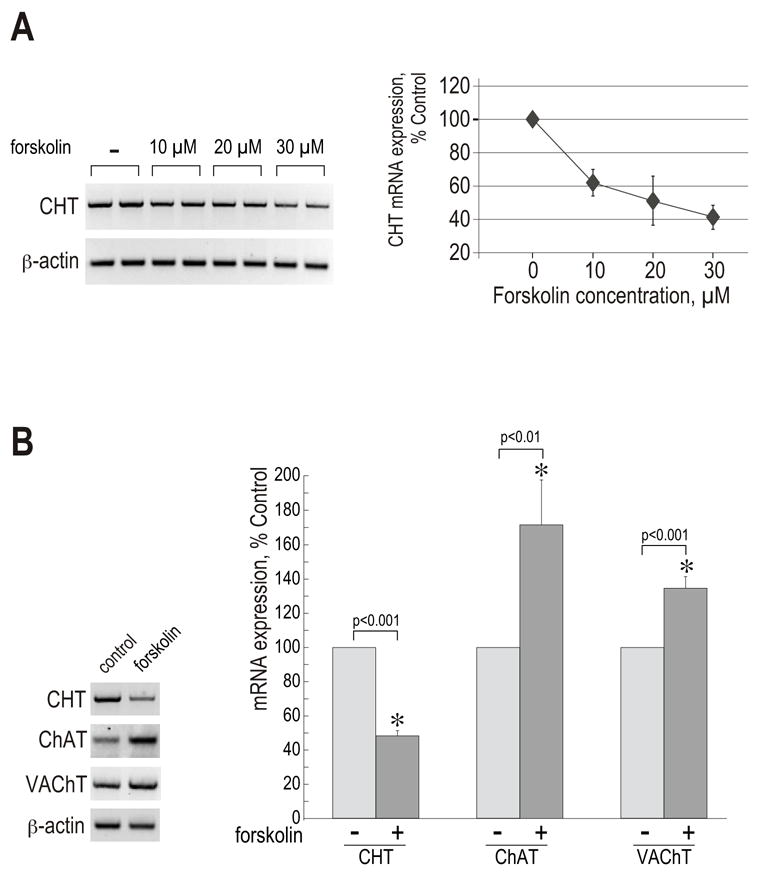
(A) NSC-19 cells were treated with increasing concentrations of forskolin, as indicated, for 72 h. Total RNA preparations were subjected to RT-PCR reactions with CHT and β-actin primers. Band intensities were quantified by the Kodak Image Station Software. Each treatment was performed in duplicate, hence it is represented by two lanes. Data are shown in the linear graph as means ± range of two samples. (B) The cells were stimulated with 30 μM forskolin for 48 h. RT-PCR reactions were done on total RNA preparations with CHT, ChAT, VAChT and β-actin primers. Band intensities were quantified by the Kodak Image Station Software and presented as means ± SEM; n (CHT) = 12; n (ChAT) = 8; n (VAChT) = 10. (*) significantly different from corresponding untreated control (paired t-test).
2. Effects of PKA inhibition on cAMP-induced changes in CHT, ChAT and VAChT gene expression
The activation of the cAMP-dependent kinases (PKA) by cAMP is responsible for ChAT and VAChT activation in the phaeochromocytoma PC12 cells (Shimojo et al., 1998). Therefore, we decided to use H-89, the cell-permeable and potent inhibitor of PKA (Chijiwa et al., 1990; Geilen et al., 1992; Leemhuis et al., 2002), to compare the involvement of this pathway in the cAMP-induced changes in CHT, VAChT and ChAT expression in spinal NSC-19 cells.
NSC-19 cells were pre-treated with 20 μM H-89 for 1 h, then 30 μM forskolin was added. The treatment was repeated after 36 h and total RNA was isolated after 72 h. Trypan Blue staining showed no difference between the samples, indicating that the H-89 treatment did not reduce cell viability (data not shown). Significant formation of dendrites was visible, which already started 2–3 hours after the treatment was initiated. Phase-contrast microscope pictures taken after 24 h of stimulation demonstrate the neurite outgrowth, similar to that with the dbcAMP treatment, in cells treated with forskolin both in the absence and in the presence of the inhibitor (Fig. 3A). Of note, H-89 is not exclusively PKA-specific, as it also has the potential to inhibit the Rho kinase ROCK-II which signals downstream of PKA. Through this effect, H-89 can cause neurite outgrowth independently of the PKA status (Leemhuis et al., 2002). Our results, demonstrating cAMP-induced neurite outgrowth in the presence of H-89, were in accordance with those findings.
Figure 3. Forskolin-induced upregulation of the cholinergic locus, but not the downregulation of CHT expression, depends on the PKA pathway.
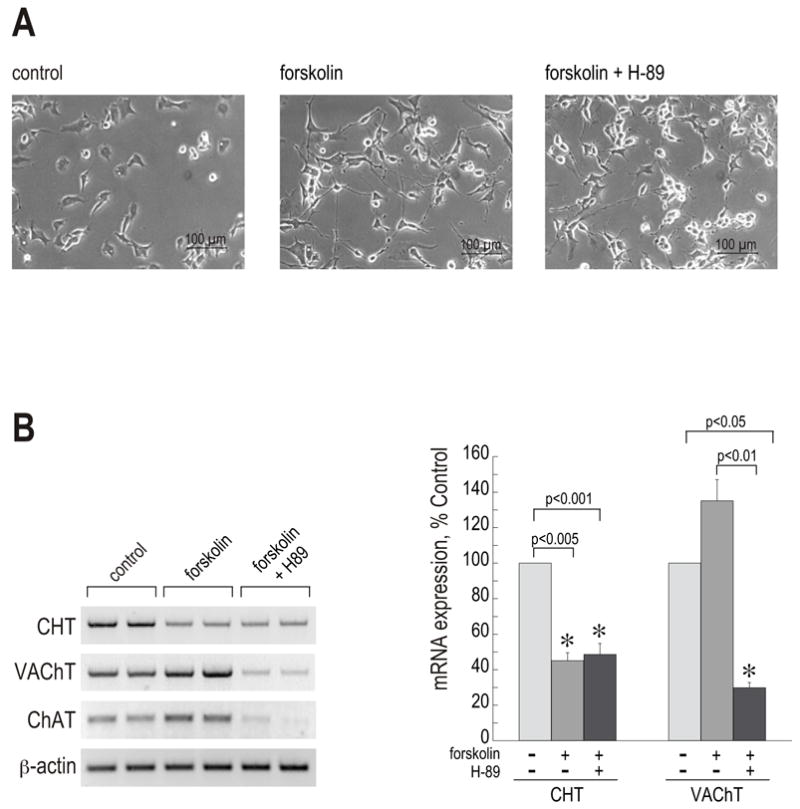
NSC-19 cells were pre-treated with 20 μM H-89 for 1 h, and then stimulated with 30 μM forskolin for 72 h. (A) Phase-contrast microscope pictures were taken after 24 h of treatment. Objective lens 20 x. Size bars: 100 μM. (B) RT-PCR reactions with CHT, VAChT, ChAT and β-actin primers were performed on total RNA preparations. Each treatment is represented by two lanes. Band intensities were determined by the Kodak Image Station Software. Data are expressed as means ± SEM of three independent experiments (each in duplicate). (*) statistically different from the corresponding untreated control.
CHT, VAChT and ChAT mRNA levels were determined by RT-PCR reactions (Fig. 3B). RT-PCR with β-actin primers confirmed equal content of total mRNA in the samples. In agreement with the results described above, one-way ANOVA revealed a significant overall effect of the forskolin treatment on both CHT and VAChT mRNA levels (p < 0.001 and p < 0.01, respectively). A subsequent Tukey test revealed statistically significant differences between groups as marked in Fig. 3B (right panel). The H-89 treatment did not alter the forskolin-induced downregulation in CHT expression. The CHT mRNA level was reduced to about 45% in forskolin- as well as forskolin/H-89-treated groups in comparison to control. No statistical difference was obtained between the forskolin-treated samples and those treated with forskolin/H-89 (p = 0.80). Thus, the cAMP-induced downregulation of CHT expression is independent of the PKA pathway. In contrast to CHT, the forskolin-stimulated increases in VAChT and ChAT mRNA expression were abolished when the PKA pathway was blocked. In H-89-treated cells, ChAT/VAChT expression decreased below control levels, suggesting that the PKA pathway is also involved in the basal transcription of the cholinergic locus.
3. Effects of specific PKA and Epac-Rap pathway activators on the expression of CHT and the cholinergic locus
The results described above indicate that the cAMP-induced downregulation of CHT expression is mediated by a signaling pathway independent of PKA, possibly the Epac-Rap pathway. In order to test a possible involvement of Epac signaling in this process, we used the cAMP analogue 8-pCPT-2′-O-Me-cAMP, capable of selective Epac activation (Enserink et al., 2002), and compared its effects to those of the specific PKA activator 6-BNZ-cAMP, capable of stimulating both PKAI and PKAII. Neither compound had a negative effect on cell number or viability. The PKA activator (at 100 μM) caused modest neurite elongation, whether administered on its own (Fig. 4) or in combination with another cAMP analog, Sp-8-CPT-cAMP, which confers specificity towards PKAII (data not shown). We did not observe significant morphological changes in cells grown in the presence of 200 μM 8CPT-2Me-cAMP (data not shown), however, the 400 μM concentration of the drug stimulated visible neurite outgrowth (Fig. 4).
Figure 4.
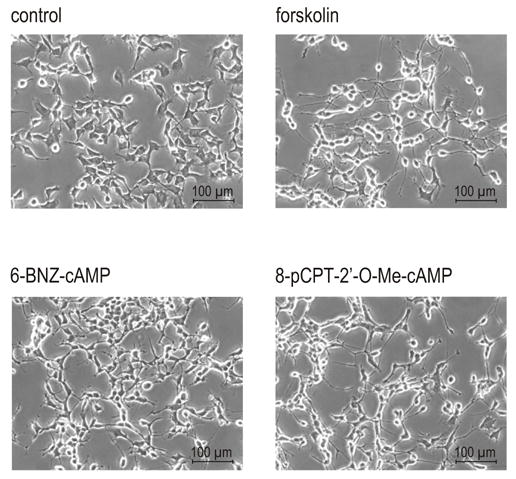
Morphology of NSC-19 cells treated with various inducers of cAMP signaling. The cells were cultured in the presence of 30 μM adenylyl cyclase activator forskolin, 100 μM PKA activator 6-BNZ-cAMP, or 400 μM Epac activator 8-pCPT-2′-O-Me-cAMP. Phase-contrast microscope pictures were taken after 72 h of treatment. Objective lens 20 x. Size bars: 100 μM.
In order to compare the effects of PKA and Epac signaling on cholinergic genes, NSC-19 cells were treated with a range of concentrations of either 6-BNZ-cAMP or 8-pCPT-2′-O-Me-cAMP for 72 h. Total RNA was isolated and RT-PCR reactions were performed in order to examine CHT, ChAT and VAChT gene expression. RT-PCR with β-actin primers demonstrated that the treatment did not affect the expression of this housekeeping gene. As shown in Fig. 5A, the PKA activator exerts dramatically different effects on the three cholinergic markers. ChAT and VAChT expression is stimulated by approximately 6-fold and 2-fold, respectively, and saturation is reached at the 20 μM and 80 μM concentration of 6-BNZ-cAMP, respectively. In contrast, the effect of 6-BNZ-cAMP on CHT expression is biphasic, with a peak at 20 mM, suggesting the involvement of more than one intracellular signaling component affected by the drug. These results indicate that the three genes are differentially affected by PKA.
Figure 5. Effect of PKA and Epac activators on the expression of CHT and the cholinergic locus mRNAs in NSC-19 cells.
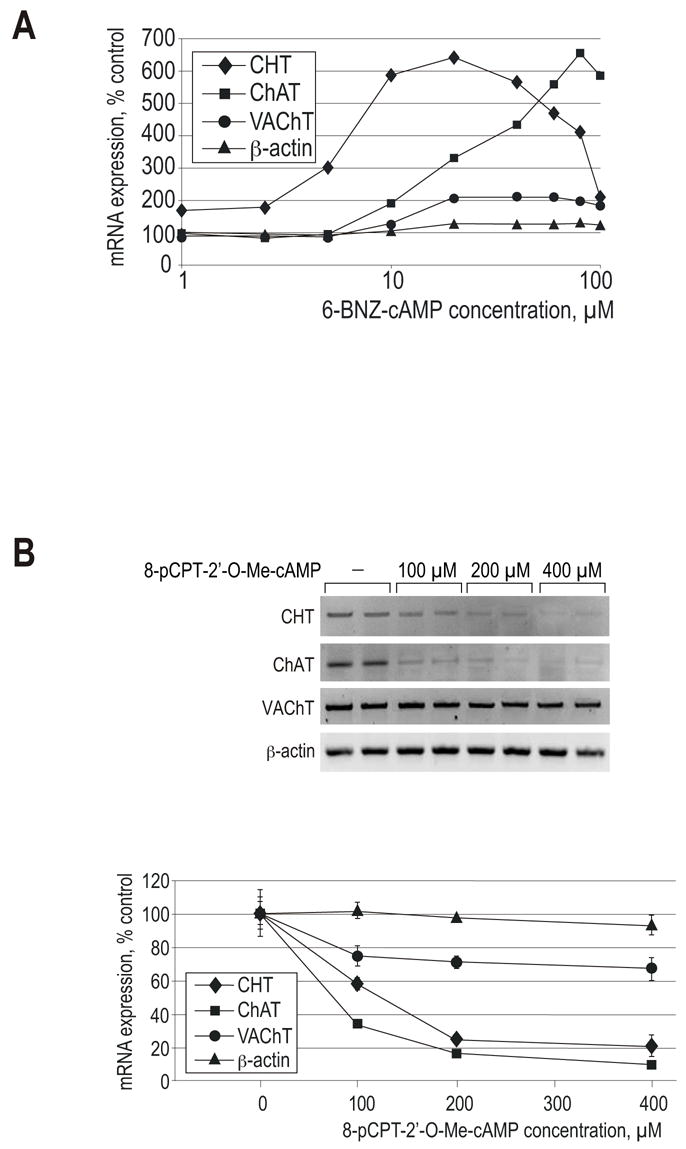
(A) The cells were exposed to a range of concentrations of 6-BNZ-cAMP, for 72 h. Total RNA preparations were subjected to RT-PCR reactions with the CHT, VAChT, ChAT and β-actin primers and analyzed by gel electrophoresis. Band intensities were determined by the Kodak Image Station Software. The graph combines data from three experiments and presents relative mRNA expression for each gene as a function of 6-BNZ-cAMP concentration (logarithmic scale). (B) The cells were exposed to various concentrations of the Epac activator 8-pCPT-2′-O-Me-cAMP, as indicated, for 72 h. Total RNA preparations were subjected to RT-PCR reactions with the CHT, VAChT, ChAT and β-actin primers. Each treatment is represented by two lanes. Band intensities were determined by the Kodak Image Station Software. Data in the graph are expressed as means ± range of two samples.
In contrast to the effect of PKA activation, stimulation of Epac signaling by 8-pCPT-2′-O-Me-cAMP caused downregulation in all three mRNA levels (Fig. 5B). This downregulation does not appear to be the result of a general effect on cell viability, as 8-pCPT-2′-O-Me-cAMP-treated cells exhibited normal morphology with neurite formation, divided at the rate comparable to the control cells and expressed β-actin at normal levels. This result suggests that the Epac pathway is involved in the downregulation of CHT gene expression produced by dbcAMP or forskolin treatment as described above. The Epac activator also inhibited the accumulation of ChAT and, to a lesser extent, VAChT mRNA, demonstrating the opposite effects of PKA and Epac signaling on cholinergic genes. Of note, 8-pCPT-2′-O-Me-cAMP is capable of stimulating PKAI and PKAII in vitro, albeit at much higher concentrations than those sufficient for Epac binding (Enserink et al., 2002).
In conclusion, cAMP-evoked signaling pathways cause differential regulation of the CHT gene and the cholinergic locus in NSC-19 cells. The basal transcription and cAMP-induced coordinated upregulation of VAChT and ChAT are drastically reduced when the PKA pathway is blocked, and the expression of both genes is stimulated by a specific PKA activator, while the response of the CHT gene to the same activator is biphasic. On the other hand, factors that increase intracellular cAMP levels downregulate CHT gene expression in a PKA-independent manner. Epac signaling significantly reduces the expression of all three genes.
3. DISCUSSION
The majority of the data available to date from several mammalian species has revealed coordinated expression of CHT and the other two cholinergic genes, ChAT and VAChT, contained within the cholinergic locus (Apparsundaram et al., 2001; Apparsundaram et al., 2000; Berse et al., 2005; Oda et al., 2004; Okuda et al., 2000). The results presented here demonstrate that, in spinal cord-derived NSC-19 cells, cAMP-evoked signaling pathways differentially regulate CHT and the cholinergic locus. Elevating intracellular cAMP levels (through a treatment with dbcAMP or forskolin) resulted in upregulation of the cholinergic locus with simultaneous downregulation of CHT expression. These results are interesting because they suggest that, in some cell populations, the cholinergic locus might be expressed in the absence of CHT expression, and vice versa. This opens the possibility that CHT is not merely a cholinergic marker, but potentially has other biological functions, e.g. providing choline for phosphatidylcholine (PC) synthesis. Indeed, biochemical evidence indicates that the retinal photoreceptor cells, known not to synthesize ACh, accumulate choline by a high-affinity process, likely to represent CHT (Masland and Mills, 1980). In cholinergic neurons this reciprocal regulation of CHT and ChAT/VACHT expression might represent a mechanism of fine-tuning the rates of ACh synthesis that depends on both the availability of choline (supplied chiefly by CHT) and the activity of ChAT. This formulation predicts that under conditions of low ChAT activity, CHT expression becomes upregulated, whereas when ChAT activity is high, CHT expression is attenuated. The overall result of the two processes would be a tight control of ACh synthesis. Indeed, in mice endowed with only 50% of normal ChAT activity (heterozygous for a null mutation in the Chat gene), CHT expression is upregulated and no impairments in ACh synthesis and release are observed (Brandon et al., 2004)
The results that ChAT and VAChT mRNA expression decreased below control levels in the presence of the PKA inhibitor H-89 suggest that not only cAMP-stimulated upregulation, but also basal expression of the cholinergic locus is controlled by the PKA pathway. Our results are in agreement with those of Shimojo et al. (1998), who reported that PKAII mediates basal expression as well as the cAMP-induced coordinated upregulation of the cholinergic locus in PC12 cells. An alternative pathway may involve phosphorylation of the transcription factor CREB by PKA, followed by direct activation of the cholinergic locus transcription by CREB. Accordingly, Misawa et al. identified a sequence homologous to a CRE (i.e. CREB-binding motif) within the proximal cAMP-responsive region of the mouse cholinergic locus (Misawa et al., 1993). Other CRE-like sites are present within the regulatory regions of the cholinergic locus, however their functional significance remains to be tested.
The present study clearly demonstrates differential effects of the PKA agonist 6-BNZ-cAMP on CHT and the cholinergic locus (Fig. 5A). In contrast to ChAT and VAChT, the response of CHT to 6-BNZ-cAMP is not monotonic, but follows a biphasic curve of an inverted U shape. Biphasic dose response curves have been reported in some biological studies in vivo, especially in the fields of toxicology and ionizing radiation, giving rise to the controversial concept of hormesis (low-dose stimulation/high-dose inhibition) (Calabrese and Baldwin, 2003). This type of response indicates a complex action of the stimulus, involving more than one cellular target. More research is needed, using various PKA agonists of known specificity and purity, in order to establish whether the effect of 6-BNZ-cAMP on CHT mRNA expression is a bona fide biphasic effect of PKA activation, or rather the result of cross-talk with other pathways.
The overall outcome of increasing intracellular cAMP is different for each cholinergic marker studied here and appears to be the net result of the effects of PKA and Epac signaling in each case. The selective Epac activator 8-pCPT-2′-O-Me-cAMP significantly downregulates all three genes, with ChAT and CHT expression affected much more than that of VAChT. Although Epac-Rap signaling is only beginning to be elucidated, recent studies on various biological models have documented its role in several intracellular processes (Bos, 2003) (Holz et al., 2006), including neurite formation in PC12 cells (Christensen et al., 2003; Kiermayer et al., 2005). A number of genes are either induced or repressed following Epac activation in several cell types including mouse microglia (Chen et al., 2005; Fuld et al., 2005; Moon et al., 2005), but no neuron-specific genes regulated by Epacs have been identified to date. Not much is known about the specific mechanism of these effects of Epac on gene expression. In some cases it appears to involve integration of PKA and Epac signaling, whereas in others the Epac effects are independent of PKA. The downstream signals involved in the Epac-mediated downregulation of cholinergic gene expression remain to be investigated.
In summary, our results constitute the first example of the regulation of neuronal-specific genes by the cAMP/Epac pathway. Elevations of intraneuronal cAMP concentration can be evoked by multiple factors (e.g. neurotransmitters and trophic factors), including calcium – a messenger related to neuronal firing. Given that the expression pattern of the adenylyl cyclases is highly heterogeneous within the brain, the responses to the extracellular factors will depend on the particular combination of G protein-coupled receptors and adenylyl cyclase isoforms that a given neuron expresses. It will be interesting to determine what are the specific physiological stimuli that modulate the expression of the cholinergic locus and CHT via cAMP in cholinergic neurons (including motor neurons) and how they recruit the PKA and Epac pathways.
4. EXPERIMENTAL PROCEDURE
Cell Culture and Treatments
The mouse neural hybrid cell line NSC-19 has been developed by fusing the neuroblastoma cell line N18TG2 with motor-neuron enriched primary embryonic day 12–14 spinal cord cells (Cashman et al., 1992). The cells were maintained at 37 °C in an atmosphere of 95% air and 5% CO2 in Dulbecco’s modified Eagle’s medium (DMEM) containing 10% (v/v) fetal bovine serum (FBS). The cells were subcultured every 3–4 days by dissociation with 0.25% trypsin. One day prior to treatment with test compounds, the cells were plated on 35 mm tissue culture dishes. The cells were treated with 1 mM dibutyryl-cAMP (dbcAMP), 10–30 μM forskolin (both obtained from Sigma, Saint Louis, MO, USA), 1–100 μM 6-BNZ-cAMP, 100–400 μM 8-pCPT-2′-O-Me-cAMP (both from BIOLOG Life Science Institute, Bremen, Germany) and/or 20 μM H-89, a PKA inhibitor (Calbiochem, San Diego, CA, USA). The inhibitor was added 1 h prior to forskolin addition. The treatments were initiated at 20–30% confluency and were conducted in the presence of serum. The medium was changed and the test compounds were added again after 36 h. Cells were collected for RNA purification and/or ChAT activity assay after 72 h of treatment. Cell morphology pictures were taken using a Nikon phase contrast microscope and a SPOT RTKE camera (Diagnostic Instruments, Inc., Sterling Heights, MI, USA). Because with longer treatments neurites were partially obscured by higher cell density, the photographs were taken at the time points when the neurites could be best appreciated (24–36 h). Final figures were produced using Adobe Photoshop (Adobe Systems Inc., Mountain View, CA, USA).
RNA Isolation and Quantification
Total RNA was isolated with the RNeasy Mini Kit (Qiagen, Valencia, CA, USA) according to the manufacturer’s protocol for animal cells. RNA was eluted in 30–50 μl of RNase-free water. To exclude a DNA contamination, an optional on-column DNase digest was performed for most of the samples using the RNase-free DNase Set (Qiagen, Valencia, CA, USA) according to the manufacturer’s instructions. RNA quantity was determined using the Quant-iT™ RiboGreen® RNA assay kit (Molecular Probes Inc., Eugene, OA, USA) and the Wallac Victor3 Multilabel Plate Reader (PerkinElmer, Boston, MA, USA).
RT PCR
Reverse transcription-polymerase chain reactions (RT-PCR) were conducted with the SuperScript™ One-Step RT-PCR System with Platinum Taq DNA polymerase (Invitrogen, Carlsbad, CA, USA) according to the manufacturer’s recommendations. 25-μl reaction mixtures were incubated at 48 °C for 45 min for first-strand cDNA synthesis, then subjected to a denaturing step for 2 min at 94 °C followed by 36 cycles of 1 min at 94°C, 1 min at 57 °C (for ChAT) or 58 °C (for VAChT and CHT), 2 min at 72 °C and terminated by an elongation step at 72 °C for 7 min to ensure the completion of synthesis.
The following primer pairs were used for cDNA amplification:
for CHT: forward 5′-CGG GGA ACC ATT GAA TTC GTT GAA GTC TAC-3′ reverse 5′-GGG GCA AGC TTC CAC TTT CAA ATA GAT ACT-3′ (PCR product corresponding to nt 685–1525, GenBank accession number AJ401467).
for VAChT: forward 5′-GGG CGT CAT GTT CGG ATC CAC AGT CAT GT-3′ reverse 5′-GCG GGG AAT TCG TCC ACC AGA AAG G-3′ (PCR product corresponding to nt 1335–2100, GenBank accession number NM 031663).
for ChAT: forward 5′-TGA GGA GGT GCT GGA CTT ACC -3′ reverse 5′-GCA CAC CAG AGA TGA GGC TG -3 (PCR product corresponding to nt 385–738, GenBank accession number NM 009891).
The CHT and VAChT primer sequences have been modified to include restriction sites in order to facilitate subcloning of the PCR products for future projects. The CHT- and ChAT-specific primers were derived from two different exons, thus eliminating the possibility that the CHT PCR product originated from genomic DNA amplification. This approach was not possible for VAChT-specific RT-PCR, since the VAChT open reading frame is intronless. In order to exclude possible DNA amplification, an on-column DNase digest was carried out during the RNA isolation procedure and negative control reactions were carried out with VAChT primers, in the presence of Platinum Taq DNA polymerase, but in the absence of reverse transcriptase. Additional negative control reactions, carried out for all primer pairs, contained both enzymes but no RNA. The amplification products were analyzed by separation on 1.5% agarose gels containing 0.3 μg/ml ethidium bromide and visualized by scanning in the Kodak Image Station 440CF. Band intensities were quantified with Kodak 1D Image Analysis Software (Kodak Digital Science, Rochester, NY, USA).
ChAT Activity Assay
ChAT activity was measured in the cell homogenates by a modification of the radio-enzyme assay of Fonnum (Fonnum, 1975), which involves the incorporation of [14C] acetyl-CoA into ACh, as described before (Madziar et al., 2005).
Statistical Analysis
Results were expressed as mean values ± standard error of the mean (SEM). The significance of difference between means was determined by using either a paired t-test or a one-way analysis of variance (ANOVA) and a post-hoc Tukey’s test with the help of SYSTAT statistical software (SPSS Inc., Chicago, IL, USA) using Macintosh computers.
Acknowledgments
This work was supported by NIH grants NS44238 from National Institute of Neurological Disorders and Stroke (to B.B.) and AG09525 from National Institute of Aging (to J.K.B.).
Abbreviations
- ACh
acetylcholine
- AD
Alzheimer’s disease
- cAMP
cyclic AMP
- ChAT
choline acetyltransferase
- CHT
choline transporter 1
- CNS
central nervous system
- CNTF
ciliary neurotrophic factor
- CRE
cAMP response element
- CREB
cAMP response element-binding protein
- dbcAMP
dibutyryl cAMP
- DN
dominant-negative
- Epac
exchange protein directly activated by cAMP
- ERK
extracellular signal-regulated kinase
- FBS
fetal bovine serum
- GEF
guanine nucleotide exchange factor
- GPRC
G protein-coupled receptor
- MAPK
mitogen-activated protein kinase
- MEK
MAPK kinase
- NGF
nerve growth factor
- nt
nucleotide
- NRSF
neuron-restrictive silencer factor
- PCR
polymerase chain reaction
- PDK
3-phosphoinositide-dependent kinase
- PI3K
phosphatidylinositol 3′-kinase
- PKA
protein kinase A
- PLD
phospholipase D
- PtdIns
phosphatidylinositol
- REST
RE-1-silencing transcription factor
- RT
reverse transcription
- SCG
superior cervical ganglia
- VAChT
vesicular acetylcholine transporter
Footnotes
Publisher's Disclaimer: This is a PDF file of an unedited manuscript that has been accepted for publication. As a service to our customers we are providing this early version of the manuscript. The manuscript will undergo copyediting, typesetting, and review of the resulting proof before it is published in its final citable form. Please note that during the production process errors may be discovered which could affect the content, and all legal disclaimers that apply to the journal pertain.
LITERATURE REFERENCES
- Apparsundaram S, Ferguson SM, Blakely RD. Molecular cloning and characterization of a murine hemicholinium-3-sensitive choline transporter. Biochem Soc Trans. 2001;29:711–6. doi: 10.1042/0300-5127:0290711. [DOI] [PubMed] [Google Scholar]
- Apparsundaram S, Ferguson SM, George AL, Jr, Blakely RD. Molecular cloning of a human, hemicholinium-3-sensitive choline transporter. Biochem Biophys Res Commun. 2000;276:862–7. doi: 10.1006/bbrc.2000.3561. [DOI] [PubMed] [Google Scholar]
- Berse B, Blusztajn JK. Coordinated up-regulation of choline acetyltransferase and vesicular acetylcholine transporter gene expression by the retinoic acid receptor alpha, cAMP, and leukemia inhibitory factor/ciliary neurotrophic factor signaling pathways in a murine septal cell line. J Biol Chem. 1995;270:22101–4. doi: 10.1074/jbc.270.38.22101. [DOI] [PubMed] [Google Scholar]
- Berse B, Szczecinska W, Lopez-Coviella I, Madziar B, Zemelko V, Kaminski R, Kozar K, Lips KS, Pfeil U, Blusztajn JK. Expression of high affinity choline transporter during mouse development in vivo and its upregulation by NGF and BMP-4 in vitro. Brain Res Dev Brain Res. 2005;157:132–40. doi: 10.1016/j.devbrainres.2005.03.013. [DOI] [PubMed] [Google Scholar]
- Blusztajn JK. Choline, a vital amine. Science. 1998;281:794–5. doi: 10.1126/science.281.5378.794. [DOI] [PubMed] [Google Scholar]
- Blusztajn JK, Venturini A, Jackson DA, Lee HJ, Wainer BH. Acetylcholine synthesis and release is enhanced by dibutyryl cyclic AMP in a neuronal cell line derived from mouse septum. J Neurosci. 1992;12:793–9. doi: 10.1523/JNEUROSCI.12-03-00793.1992. [DOI] [PMC free article] [PubMed] [Google Scholar]
- Bok J, Zha XM, Cho YS, Green SH. An extranuclear locus of cAMP-dependent protein kinase action is necessary and sufficient for promotion of spiral ganglion neuronal survival by cAMP. J Neurosci. 2003;23:777–87. doi: 10.1523/JNEUROSCI.23-03-00777.2003. [DOI] [PMC free article] [PubMed] [Google Scholar]
- Bos JL. Epac: a new cAMP target and new avenues in cAMP research. Nat Rev Mol Cell Biol. 2003;4:733–8. doi: 10.1038/nrm1197. [DOI] [PubMed] [Google Scholar]
- Brandon EP, Mellott T, Pizzo DP, Coufal N, D’Amour KA, Gobeske K, Lortie M, Lopez-Coviella I, Berse B, Thal LJ, Gage FH, Blusztajn JK. Choline transporter 1 maintains cholinergic function in choline acetyltransferase haploinsufficiency. J Neurosci. 2004;24:5459–66. doi: 10.1523/JNEUROSCI.1106-04.2004. [DOI] [PMC free article] [PubMed] [Google Scholar]
- Calabrese EJ, Baldwin LA. The hormetic dose-response model is more common than the threshold model in toxicology. Toxicol Sci. 2003;71:246–50. doi: 10.1093/toxsci/71.2.246. [DOI] [PubMed] [Google Scholar]
- Cashman NR, Durham HD, Blusztajn JK, Oda K, Tabira T, Shaw IT, Dahrouge S, Antel JP. Neuroblastoma x spinal cord (NSC) hybrid cell lines resemble developing motor neurons. Dev Dyn. 1992;194:209–21. doi: 10.1002/aja.1001940306. [DOI] [PubMed] [Google Scholar]
- Casper D, Davies P. Mechanism of activation of choline acetyltransferase in a human neuroblastoma cell line. Brain Res. 1989;478:85–94. doi: 10.1016/0006-8993(89)91479-0. [DOI] [PubMed] [Google Scholar]
- Castell X, Cheviron N, Barnier JV, Diebler MF. Exploring the regulation of the expression of ChAT and VAChT genes in NG108-15 cells: implication of PKA and PI3K signaling pathways. Neurochem Res. 2003;28:557–64. doi: 10.1023/a:1022829608540. [DOI] [PubMed] [Google Scholar]
- Chen L, Wang P, Andrade CF, Zhao IY, Dube PE, Brubaker PL, Liu M, Jin T. PKA independent and cell type specific activation of the expression of caudal homeobox gene Cdx-2 by cyclic AMP. Febs J. 2005;272:2746–59. doi: 10.1111/j.1742-4658.2005.04694.x. [DOI] [PubMed] [Google Scholar]
- Chijiwa T, Mishima A, Hagiwara M, Sano M, Hayashi K, Inoue T, Naito K, Toshioka T, Hidaka H. Inhibition of forskolin-induced neurite outgrowth and protein phosphorylation by a newly synthesized selective inhibitor of cyclic AMP-dependent protein kinase, N-[2-(p-bromocinnamylamino)ethyl]-5-isoquinolinesulfonamide (H-89), of PC12D pheochromocytoma cells. J Biol Chem. 1990;265:5267–72. [PubMed] [Google Scholar]
- Chin KV, Yang WL, Ravatn R, Kita T, Reitman E, Vettori D, Cvijic ME, Shin M, Iacono L. Reinventing the wheel of cyclic AMP: novel mechanisms of cAMP signaling. Ann N Y Acad Sci. 2002;968:49–64. doi: 10.1111/j.1749-6632.2002.tb04326.x. [DOI] [PubMed] [Google Scholar]
- Christensen AE, Selheim F, de Rooij J, Dremier S, Schwede F, Dao KK, Martinez A, Maenhaut C, Bos JL, Genieser HG, Doskeland SO. cAMP analog mapping of Epac1 and cAMP kinase. Discriminating analogs demonstrate that Epac and cAMP kinase act synergistically to promote PC-12 cell neurite extension. J Biol Chem. 2003;278:35394–402. doi: 10.1074/jbc.M302179200. [DOI] [PubMed] [Google Scholar]
- de Rooij J, Zwartkruis FJ, Verheijen MH, Cool RH, Nijman SM, Wittinghofer A, Bos JL. Epac is a Rap1 guanine-nucleotide-exchange factor directly activated by cyclic AMP. Nature. 1998;396:474–7. doi: 10.1038/24884. [DOI] [PubMed] [Google Scholar]
- Enserink JM, Christensen AE, de Rooij J, van Triest M, Schwede F, Genieser HG, Doskeland SO, Blank JL, Bos JL. A novel Epac-specific cAMP analogue demonstrates independent regulation of Rap1 and ERK. Nat Cell Biol. 2002;4:901–6. doi: 10.1038/ncb874. [DOI] [PubMed] [Google Scholar]
- Fonnum F. A rapid radiochemical method for the determination of choline acetyltransferase. J Neurochem. 1975;24:407–9. doi: 10.1111/j.1471-4159.1975.tb11895.x. [DOI] [PubMed] [Google Scholar]
- Fuld S, Borland G, Yarwood SJ. Elevation of cyclic AMP in Jurkat T-cells provokes distinct transcriptional responses through the protein kinase A (PKA) and exchange protein activated by cyclic AMP (EPAC) pathways. Exp Cell Res. 2005;309:161–73. doi: 10.1016/j.yexcr.2005.05.016. [DOI] [PubMed] [Google Scholar]
- Geilen CC, Wieprecht M, Wieder T, Reutter W. A selective inhibitor of cyclic AMP-dependent protein kinase, N-[2-bromocinnamyl(amino)ethyl]-5-isoquinolinesulfonamide (H-89), inhibits phosphatidylcholine biosynthesis in HeLa cells. FEBS Lett. 1992;309:381–4. doi: 10.1016/0014-5793(92)80811-t. [DOI] [PubMed] [Google Scholar]
- Gunning PW, Landreth GE, Bothwell MA, Shooter EM. Differential and synergistic actions of nerve growth factor and cyclic AMP in PC12 cells. J Cell Biol. 1981;89:240–5. doi: 10.1083/jcb.89.2.240. [DOI] [PMC free article] [PubMed] [Google Scholar]
- Haberberger RV, Pfeil U, Lips KS, Kummer W. Expression of the high-affinity choline transporter, CHT1, in the neuronal and non-neuronal cholinergic system of human and rat skin. J Invest Dermatol. 2002;119:943–8. doi: 10.1046/j.1523-1747.2002.00182.x. [DOI] [PubMed] [Google Scholar]
- Holz GG, Kang G, Harbeck M, Roe MW, Chepurny OG. Cell physiology of cAMP sensor Epac. J Physiol. 2006 doi: 10.1113/jphysiol.2006.119644. [DOI] [PMC free article] [PubMed] [Google Scholar]
- Kao HT, Song HJ, Porton B, Ming GL, Hoh J, Abraham M, Czernik AJ, Pieribone VA, Poo MM, Greengard P. A protein kinase A-dependent molecular switch in synapsins regulates neurite outgrowth. Nat Neurosci. 2002;5:431–7. doi: 10.1038/nn840. [DOI] [PubMed] [Google Scholar]
- Kawasaki H, Springett GM, Mochizuki N, Toki S, Nakaya M, Matsuda M, Housman DE, Graybiel AM. A family of cAMP-binding proteins that directly activate Rap1. Science. 1998;282:2275–9. doi: 10.1126/science.282.5397.2275. [DOI] [PubMed] [Google Scholar]
- Kiermayer S, Biondi RM, Imig J, Plotz G, Haupenthal J, Zeuzem S, Piiper A. Epac activation converts cAMP from a proliferative into a differentiation signal in PC12 cells. Mol Biol Cell. 2005;16:5639–48. doi: 10.1091/mbc.E05-05-0432. [DOI] [PMC free article] [PubMed] [Google Scholar]
- Kim G, Choe Y, Park J, Cho S, Kim K. Activation of protein kinase A induces neuronal differentiation of HiB5 hippocampal progenitor cells. Brain Res Mol Brain Res. 2002;109:134–45. doi: 10.1016/s0169-328x(02)00550-8. [DOI] [PubMed] [Google Scholar]
- Kopperud R, Krakstad C, Selheim F, Doskeland SO. cAMP effector mechanisms. Novel twists for an ‘old’ signaling system. FEBS Lett. 2003;546:121–6. doi: 10.1016/s0014-5793(03)00563-5. [DOI] [PubMed] [Google Scholar]
- Lecomte MJ, De Gois S, Guerci A, Ravassard P, Faucon Biguet N, Mallet J, Berrard S. Differential expression and regulation of the high-affinity choline transporter CHT1 and choline acetyltransferase in neurons of superior cervical ganglia. Mol Cell Neurosci. 2005;28:303–13. doi: 10.1016/j.mcn.2004.09.014. [DOI] [PubMed] [Google Scholar]
- Leemhuis J, Boutillier S, Schmidt G, Meyer DK. The protein kinase A inhibitor H89 acts on cell morphology by inhibiting Rho kinase. J Pharmacol Exp Ther. 2002;300:1000–7. doi: 10.1124/jpet.300.3.1000. [DOI] [PubMed] [Google Scholar]
- Lips KS, Pfeil U, Haberberger RV, Kummer W. Localisation of the high-affinity choline transporter-1 in the rat skeletal motor unit. Cell Tissue Res. 2002;307:275–80. doi: 10.1007/s00441-002-0520-4. [DOI] [PubMed] [Google Scholar]
- Lips KS, Pfeil U, Reiners K, Rimasch C, Kuchelmeister K, Braun-Dullaeus RC, Haberberger RV, Schmidt R, Kummer W. Expression of the high-affinity choline transporter CHT1 in rat and human arteries. J Histochem Cytochem. 2003;51:1645–54. doi: 10.1177/002215540305101208. [DOI] [PubMed] [Google Scholar]
- Madziar B, Lopez-Coviella I, Zemelko V, Berse B. Regulation of cholinergic gene expression by nerve growth factor depends on the phosphatidylinositol-3′-kinase pathway. J Neurochem. 2005;92:767–779. doi: 10.1111/j.1471-4159.2004.02908.x. [DOI] [PubMed] [Google Scholar]
- Masland RH, Mills JW. Choline accumulation by photoreceptor cells of the rabbit retina. Proc Natl Acad Sci U S A. 1980;77:1671–5. doi: 10.1073/pnas.77.3.1671. [DOI] [PMC free article] [PubMed] [Google Scholar]
- Ming GL, Song HJ, Berninger B, Holt CE, Tessier-Lavigne M, Poo MM. cAMP-dependent growth cone guidance by netrin-1. Neuron. 1997;19:1225–35. doi: 10.1016/s0896-6273(00)80414-6. [DOI] [PubMed] [Google Scholar]
- Misawa H, Takahashi R, Deguchi T. Transcriptional regulation of choline acetyltransferase gene by cyclic AMP. J Neurochem. 1993;60:1383–7. doi: 10.1111/j.1471-4159.1993.tb03299.x. [DOI] [PubMed] [Google Scholar]
- Moon EY, Oh SY, Han GH, Lee CS, Park SK. Epac1-mediated Rap1 activation is not required for the production of nitric oxide in BV2, murine microglial cells. J Neurosci Res. 2005;81:38–44. doi: 10.1002/jnr.20535. [DOI] [PubMed] [Google Scholar]
- Nishiyama M, Hoshino A, Tsai L, Henley JR, Goshima Y, Tessier-Lavigne M, Poo MM, Hong K. Cyclic AMP/GMP-dependent modulation of Ca2+ channels sets the polarity of nerve growth-cone turning. Nature. 2003;423:990–5. doi: 10.1038/nature01751. [DOI] [PubMed] [Google Scholar]
- Oda Y, Muroishi Y, Misawa H, Suzuki S. Comparative study of gene expression of cholinergic system-related molecules in the human spinal cord and term placenta. Neuroscience. 2004;128:39–49. doi: 10.1016/j.neuroscience.2004.06.002. [DOI] [PubMed] [Google Scholar]
- Okuda T, Haga T. High-affinity choline transporter. Neurochem Res. 2003;28:483–8. doi: 10.1023/a:1022809003997. [DOI] [PubMed] [Google Scholar]
- Okuda T, Haga T, Kanai Y, Endou H, Ishihara T, Katsura I. Identification and characterization of the high-affinity choline transporter. Nat Neurosci. 2000;3:120–5. doi: 10.1038/72059. [DOI] [PubMed] [Google Scholar]
- Pfeil U, Haberberger RV, Lips KS, Eberling L, Grau V, Kummer W. Expression of the high-affinity choline transporter CHT1 in epithelia. Life Sci. 2003a;72:2087–90. doi: 10.1016/s0024-3205(03)00088-2. [DOI] [PubMed] [Google Scholar]
- Pfeil U, Lips KS, Eberling L, Grau V, Haberberger RV, Kummer W. Expression of the high-affinity choline transporter, CHT1, in the rat trachea. Am J Respir Cell Mol Biol. 2003b;28:473–7. doi: 10.1165/rcmb.2002-0190OC. [DOI] [PubMed] [Google Scholar]
- Piiper A, Dikic I, Lutz MP, Leser J, Kronenberger B, Elez R, Cramer H, Muller-Esterl W, Zeuzem S. Cyclic AMP induces transactivation of the receptors for epidermal growth factor and nerve growth factor, thereby modulating activation of MAP kinase, Akt, and neurite outgrowth in PC12 cells. J Biol Chem. 2002;277:43623–30. doi: 10.1074/jbc.M203926200. [DOI] [PubMed] [Google Scholar]
- Prasad KN, Kumar S. Cyclic AMP and the differentiation of neuroblastoma cells in culture. In: Clarkson B, Baserga R, editors. Cyclic AMP and the differentiation of neuroblastoma cells in culture vol. Cold Spring Harbor Laboratory; Cold Spring Harbor, N.Y: 1974. pp. 58–594. [Google Scholar]
- Quirin-Stricker C, Mauvais C, Schmitt M. Transcriptional activation of human choline acetyltransferase by AP2- and NGF-induced factors. Brain Res Mol Brain Res. 1997;49:165–74. doi: 10.1016/s0169-328x(97)00141-1. [DOI] [PubMed] [Google Scholar]
- Rydel RE, Greene LA. cAMP analogs promote survival and neurite outgrowth in cultures of rat sympathetic and sensory neurons independently of nerve growth factor. Proc Natl Acad Sci U S A. 1988;85:1257–61. doi: 10.1073/pnas.85.4.1257. [DOI] [PMC free article] [PubMed] [Google Scholar]
- Seamon KB, Daly JW. Forskolin: a unique diterpene activator of cyclic AMP-generating systems. J Cyclic Nucleotide Res. 1981;7:201–24. [PubMed] [Google Scholar]
- Shi GX, Rehmann H, Andres DA. A novel cyclic AMP-dependent Epac-Rit signaling pathway contributes to PACAP38-mediated neuronal differentiation. Mol Cell Biol. 2006;26:9136–47. doi: 10.1128/MCB.00332-06. [DOI] [PMC free article] [PubMed] [Google Scholar]
- Shimojo M, Wu D, Hersh LB. The cholinergic gene locus is coordinately regulated by protein kinase A II in PC12 cells. J Neurochem. 1998;71:1118–26. doi: 10.1046/j.1471-4159.1998.71031118.x. [DOI] [PubMed] [Google Scholar]
- Skalhegg BS, Tasken K. Specificity in the cAMP/PKA signaling pathway. Differential expression, regulation, and subcellular localization of subunits of PKA. Front Biosci. 2000;5:D678–93. doi: 10.2741/skalhegg. [DOI] [PubMed] [Google Scholar]
- Szutowicz A, Morrison MR, Srere PA. The enzymes of acetyl-CoA metabolism in differentiating cholinergic (s-20) and noncholinergic (NIE-115) neuroblastoma cells. J Neurochem. 1983;40:1664–70. doi: 10.1111/j.1471-4159.1983.tb08140.x. [DOI] [PubMed] [Google Scholar]
- Vaudry D, Stork PJ, Lazarovici P, Eiden LE. Signaling pathways for PC12 cell differentiation: making the right connections. Science. 2002;296:1648–9. doi: 10.1126/science.1071552. [DOI] [PubMed] [Google Scholar]
- York RD, Yao H, Dillon T, Ellig CL, Eckert SP, McCleskey EW, Stork PJ. Rap1 mediates sustained MAP kinase activation induced by nerve growth factor. Nature. 1998;392:622–6. doi: 10.1038/33451. [DOI] [PubMed] [Google Scholar]