

Abstract
Over the past several years, multivariate approaches have been developed that address the problem of disease diagnosis. Here, we report an integrated approach to the problem of prognosis that uses protein microarrays to measure a focused set of molecular markers and non-parametric methods to reveal non-linear relationships among these markers, clinical variables, and patient outcome. As proof-of-concept, we applied our approach to the prediction of early mortality in patients initiating kidney dialysis. We found that molecular markers are not uniformly prognostic, but instead vary in their value depending on a combination of clinical variables. This may explain why reports in this area aiming to identify prognostic markers, without taking into account clinical variables, are either conflicting or show that markers have marginal prognostic value. Just as treatments are now being tailored to specific subsets of patients, our results show that prognosis can also benefit from a ‘personalized' approach.
Keywords: dialysis, end-stage renal disease (ESRD), non-parametric regression, prognosis, protein microarray
Introduction
The problem of prognosis differs from that of diagnosis in two important ways. First, the goal of diagnosis is to assign patients to discrete categories (affected or unaffected), whereas the goal of prognosis is to provide a probability that a given outcome will occur. Second, for many diseases that have been characterized by molecular markers, clinical parameters (such as age or race) are not relevant to their diagnosis, but are often of substantial prognostic value. Since recent studies have shown that diagnosis can be enhanced by multivariate approaches (Alizadeh et al, 2000; Ramaswamy et al, 2001; Hanash, 2003; Liang et al, 2005), we set out to develop a strategy that addresses the challenges unique to prognosis. Our strategy incorporates information from clinical variables as well as molecular markers, is not biased by assumptions about the relationships between variables and outcome, and can be implemented in the clinic without introducing new and expensive technology.
As proof-of-concept, we developed a prognostic test for patients initiating kidney dialysis. In the United States alone, end-stage renal disease (ESRD) affects ∼100 000 individuals per year and there are at present ∼400 000 individuals undergoing chronic hemodialysis (USRDS, 2006). Of patients with ESRD, ∼10% die within the first 3–4 months of initiating treatment and there is currently no way to predict early mortality. In general, patients with renal failure have excess inflammation, and inflammation has been implicated in cardiovascular events and infection—the two leading causes of death among ESRD patients (Ridker et al, 2002; Ritz, 2004; USRDS, 2006). As such, many dialysis-related studies have focused on cytokines as potential prognostic markers (Kimmel et al, 1998; Huraib et al, 1999; Zimmermann et al, 1999; Zoccali et al, 2000; Papagianni et al, 2003; Peng et al, 2005; Tripepi et al, 2005). To date, no single marker has been discovered that accurately predicts outcome, and cytokine levels are not used routinely in the clinical management of dialysis patients. We set out to develop a model that predicts which patients are most at risk of dying within the first 15 weeks of initiating treatment. Critical decisions may be aided by such a model, including setting priorities for renal transplantation, changing the frequency or dose of dialysis, and identifying a subset of patients at whom clinical trials could be directed.
Results and discussion
Measuring molecular markers using protein microarrays
To address this problem, we turned to Accelerated Mortality on Renal Replacement (ArMORR), a prospective study of ESRD patients that initiate dialysis at any one of >1000 dialysis centers in 34 US states (Thadhani and Tonelli, 2006). ArMORR contains detailed demographic and clinical data, as well as serum samples, for all participants. For this study, we selected 208 consecutive patients who died within 15 weeks of initiating dialysis to serve as cases, and 260 consecutive patients who survived for at least 15 weeks to serve as controls. Serum samples were collected within 14 days of initiating dialysis.
To identify putative prognostic markers, we searched the literature for cytokines or other blood proteins whose levels correlate with kidney disease. We also included proteins associated with hypertension or diabetes, the two leading causes of ESRD (USRDS, 2006). From this initial list of proteins, we chose 14 that are present in the serum of dialysis patients and for which matched pairs of antibodies, as well as purified antigens, are commercially available: angiogenin (Ang), EGF, Fet-A, ICAM, interleukin-12 (IL-12), IL-1α, IL-8, MIP-1β, RANTES, TNF-β, TNFR2, TNFR1, vascular cell adhesion molecule-1 (VCAM-1), and VEGF (Supplementary Table 1).
To facilitate rapid and accurate measurement of all 14 markers in all 468 patient samples, we developed a high-throughput, multiplexed assay that mimics a sandwich immunoassay, but in a microarray format. Capture antibodies were arrayed at high spatial density in each well of 96-well microtiter plates (Figure 1A), and serum samples were applied to each array. Captured cytokines were detected using a cocktail of biotinylated antibodies, which were then visualized with a fluorescent conjugate of streptavidin. By using a very bright fluorophore (PBXL-3), we were able to achieve exquisite sensitivity without requiring enzyme-mediated signal amplification: most cytokines could be detected at a concentration of ∼1 pg/ml. This greatly facilitated the rapid processing of hundreds of arrays. In addition, multiplexing did not compromise the assay; biotinylated detection antibodies did not cross-react with capture antibodies and capture antibodies did not cross-react with non-cognate antigens when tested individually.
Figure 1.

Serum cytokine levels measured using antibody microarrays. (A) Microarrays of 14 anti-cytokine antibodies, printed in quintuplicate in each well of a 96-well microtiter plate. Serum samples were applied to each well in columns 1–11 and two-fold serial dilutions of a mixture of the 14 cognate cytokines were applied to the wells in column 12. (B) Standard curves generated from the purified cytokines in column 12 of the microtiter plate. (C) Serum cytokine levels of 468 patients. For visualization only, each cytokine was normalized relative to its mean over all the samples and the patients were ordered according to the first principal component of the cytokine profiles. The outcome of each patient is shown at the top (red: died within 15 weeks of initiating dialysis; black: survived more than 15 weeks). (D) Box-and-whiskers plots showing the distribution of each cytokine in the two patient populations. The boxes indicate the first, second, and third quartiles and the whiskers indicate the full range of the data.
The absolute concentration of each cytokine in each sample was determined by relating the fluorescence intensity of microarray spots to a standard curve, generated for each cytokine in a multiplexed fashion using one column of each microtiter plate (Figure 1A and B). This strategy minimized both plate-to-plate and day-to-day variation, since a separate standard curve was generated on each assay plate. For redundancy, each array contained five replicate spots of the capture antibodies and every sample was analyzed on two arrays. Overall, the average coefficient of variation was 6.6% for replicate spots within an array and 11% for replicate samples on separate arrays.
Using these microarrays, cytokine levels were measured in all 468 patient samples (Figure 1C and Supplementary Table 2). A cursory inspection of the data showed that for all 14 cytokines, their distribution in the population of patients who died closely matched their distribution in the population of patients who survived (Figure 1D). This is consistent with previous studies showing that no single marker is predictive of early mortality. Although it is possible that prognostic information is embedded in correlations between pairs of biomarkers, including cross-terms in any analysis would increase the number of variables from 14 to 182, and thus substantially increase the false discovery rate. We therefore focused our efforts on the 14 first-order terms, which are also more readily interpretable.
We found that standard data-mining methods (Duda and Hart, 1973), including hierarchical clustering, k-means clustering, nearest-neighbor methods, and principal components analysis, all failed to distinguish those who died from those who survived. These methods rely on metrics that quantify the ‘distance' between patient profiles and hence require arbitrary rescaling of variables. More important variables are not weighted appropriately, and hence these methods are weakened by noise and outliers. Decision trees and adaptive boosting with decision stumps (Freund and Schapire, 1997) also failed to segregate those who survived from those who died. While these methods do not require rescaling of variables, they work by converting continuous variables into binary data and so discard much of the information embedded in the quantitative dataset. More importantly, all of these methods are best suited to classifying samples, but our goal was to develop a continuous predictor of early mortality. We therefore turned to regression methods as a way to extract the relationships between variables and outcome.
Variable selection
To enable a rapid, exhaustive search for the most significant subset of variables, we started by building linear, additive models, using logistic regression. The log-odds that a patient within our study dies is given by the following equation:
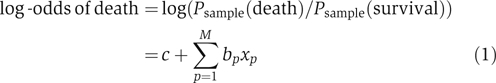 |
where xp is the value of the p-th variable (e.g., age or IL-12 concentration) and c and bp are constants. It is important to note that the probabilities in equation (1) are calculated with respect to the patients in our nested case–control study and not with respect to the general population. We intentionally over-sampled patients who died (stratified sampling); we correct for this difference later based on an early mortality rate of 10%.
Since clinical data are routinely collected on each patient, we started by building an additive model using these data alone. We focused on 11 clinical parameters previously shown to be associated with dialysis-related mortality (Teng et al, 2003, 2005; USRDS, 2006): gender, age, race, body mass index, diastolic blood pressure, underlying disease, method of vascular access, serum albumin level, serum calcium level, serum phosphate level, and blood hemoglobin content. To avoid over-fitting and to construct a model that incorporates only as many variables as are necessary, we adopted the following strategy. If M is the number of variables in the model, we started with M=1 and, in an incremental manner, performed an exhaustive search for the best M-variable model. We continued to increment M until no M-variable model could be found in which all of the parameters were significant (P<0.05 for each bp). Based on this criterion, the best model was obtained using four clinical parameters: age, diastolic blood pressure, serum albumin, and method of vascular access (arm or neck). We then repeated this procedure using the serum cytokine levels measured on our microarrays. In this case, we found that the best model was obtained using three cytokines: angiogenin (Ang), interleukin-12 (IL-12), and vascular cell adhesion molecule-1 (VCAM-1).
Non-parametric models and non-linearity
Although linear models are easy to implement, there is no reason a priori why risk should vary linearly with any clinical or molecular variable. Indeed, there is no reason why any parametric function should describe these relationships. To capture non-linearities, we refined our efforts by building generalized additive models (Buja et al, 1989), in which the log-odds of death is given by the following equation:
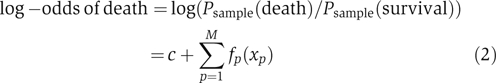 |
where fp(xp) is a spline, composed of piecewise cubic polynomials, with the requirement that two connected polynomials have the same slope where they meet. Since any curve can be approximated by a spline, generalized additive models are not constrained by investigator bias. Since they are non-parametric, however, there is no straightforward way to calculate a P-value for each variable. We therefore relied on our previous variable selection and used non-parametric methods to refine the models. To avoid over-fitting, we constrained the nominal degrees of freedom of each spline to 2. The two degrees of freedom were not concentrated at any part of the spline, but were instead spread evenly across the spline. In addition, since minimizing the sum-of-squared error tends to skew the model to outliers, we took a maximum likelihood approach. As anticipated, the generalized models picked up fine features in the relationship between death risk and each variable, providing further clinical insight. We found that the death risk increases abruptly when age increases above ∼60 years, when diastolic blood pressure drops below ∼80 mmHg, and when serum albumin levels drop below ∼3.5 g/dl (Figure 2A). These inflection points, which cannot be identified using linear models, provide therapeutic goals for clinicians striving to optimally manage diastolic blood pressure or serum albumin levels.
Figure 2.

Generalized additive models. (A) Model built using the clinical variables that represent the best four-variable model. (B) Model built using the cytokine levels that represent the best three-variable model. The solid lines are the mean of 100 bootstrap samples and the dashed lines show the variance. Numerical values for the mean curves are provided as Supplementary information.
The same non-parametric method applied to cytokines shows that the slopes of the splines vary as cytokine levels change (Figure 2B). Interestingly, we found that high levels of IL-12 and Ang are associated with low risk of early mortality. IL-12 is primarily produced by peripheral blood mononuclear cells such as macrophages (Hsieh et al, 1993) and enhances the cytotoxic activity of NK cells and the activation of T cells. The serum level of IL-12 is therefore an indicator of immune capability, which is often impaired in patients with renal failure. Similarly, Ang, although originally implicated in tumor angiogenesis, has been shown to be protective against bacterial and fungal pathogens (Hooper et al, 2003) and appears in circulation during the acute phase response to infection (Olson et al, 1998). Ang also protects against neutrophil degranulation, a side effect of dialysis (Horl, 2002).
Unlike IL-12 and Ang, increased levels of VCAM-1 were found to be associated with increased risk of death. VCAM-1 is normally absent from resting endothelium. Uremia (excessive urea in the blood stream) induces an increase in the expression of adhesion molecules on vascular endothelial cells and shedding of these molecules into the circulation (Serradell et al, 2002). In addition, VCAM-1 is involved in atherosclerosis (Nahrendorf et al, 2006). Since cardiovascular events are the most common causes of death among dialysis patients, it is possible that antagonizing VCAM-1 will have beneficial therapeutic effects. Interestingly, the three molecular markers are produced by and act on different cell populations. This may explain why a simple additive model is sufficient to capture their associations with early mortality. Cytokines acting on the same cell often exhibit synergistic or antagonistic effects (Natarajan et al, 2006), but IL-12, Ang, and VCAM-1 are, to a first approximation, independent.
A combined model through kernel smoothing
As a first step toward a unified model, we prepared a scatter plot in which the two models are presented jointly, with the clinical predictor on the horizontal axis and the cytokine predictor on the vertical axis (Figure 3A). These predictors, which provide the probability of early mortality within the sample population, were obtained by first calculating the log-odds of death by adding each variable's contribution, as well as the appropriate constant term, c (Figure 2 and equation 2). Log-odds was then converted to a probability by taking the inverse logit according to the following equation:
Using only seven parameters, the combined model is able to separate patient outcomes effectively. While there are outliers in any human population, the centroids of the two patient populations are well separated (Figure 3B). Since the goal of our approach is to provide a continuous predictor of outcome, we estimated probability densities for death ( ) and survival (
 ) using kernel methods. Kernel methods amount to convolving discrete data with a Gaussian window to obtain continuous estimates for densities. In other words, the density estimate at each location is a weighted average of all the discrete samples, with the weight of each sample decreasing with increase in distance between the sample and that location.
Figure 3.

Predictors based on generalized additive models. The clinical and cytokine predictors assign patients probabilities of death with respect to the current study. (A) Scatter plot of 468 incident dialysis patients, colored according to outcome (red: died within 15 weeks; black: survived more than 15 weeks). (B) Contour plot of the scatter plot shown in panel A. The ‘x' indicates the data centroid and the closed curves contain, from inside out, 30, 50, and 70% of the patients, respectively. (C) Continuous predictor built using a combination of clinical and cytokine data. Numerical values are provided as Supplementary data. (D) Probability of death as a function of cytokine predictor, plotted at four different values of the clinical predictor. If the clinical predictor is low (0.3 or 0.5), cytokines do not provide substantial information. If the clinical predictor is high (0.7 or 0.9), however, cytokines provide further risk stratification. (E) Strategy for patient management. New patients are assigned a risk of mortality based on their clinical parameters. Those that fall in the medium-to-high risk category are further stratified based on their serum cytokine levels.
To ensure that our density estimations are not biased by sample size, we generated 100 bootstrap data sets (sampling with replacement) and performed kernel density estimation on each data set. The final density estimate is the average of all 100 bootstrap density estimates. This procedure is often referred to as ‘bagging'. Based on  and
and  , and adjusting for our over-sampling of patients who died, we went on to compute predictors that give the overall risk of death among new dialysis patients in the general population, based on an orthogonal combination of clinical and cytokine data (Figure 3C). Numerical values for our model are provided as Supplementary information.
Although a continuous predictor is more appropriate for prognosis than a binary classifier, there are situations in which it is useful to classify patients based on their expected outcome. For example, high-risk patients can be selected for clinical trials aimed at altering their outcome. To classify patients, a simple decision boundary can be applied to our model: patients with a risk of early mortality above the boundary are projected to die, whereas those below the boundary are projected to survive. Clearly these projections will sometimes be incorrect, especially for patients who are close to the boundary, but model-based selection should prove more accurate than random selection. In order to assess the accuracy of our model with respect to binary classification, we performed five-fold cross-validation, each time using 80% of the data for model fitting and 20% of the data as a naïve sample for model testing. The five runs gave near-identical results, indicating that our approach is robust (Supplementary Figure 1A and B). At a decision boundary equal to the overall risk of early mortality (0.10), our model classifies patients in the general population with 73±2.5% (s.e.m.) sensitivity, 76±1.8% specificity, and a positive predictive value (PPV) of 25±1.4% (for definitions, see legend to Supplementary Figure 1).
When it is desirable to favor specificity over sensitivity, a decision boundary of 0.20 enables patients to be selected with reasonable sensitivity (39±4.3%) and high specificity (94±1.1%), yielding a PPV of 43±6.4% (Supplementary Figure 1A and B). This strategy can be used to enrich high-risk cases in a clinical trial by 4.3-fold relative to a trial run without patient selection, thereby substantially decreasing expenditures. This is particularly relevant given that several recent trials designed to improve survival among dialysis patients were negative (Besarab et al, 1998; Eknoyan et al, 2002; Wanner et al, 2005).
Non-linear relationship between clinical and molecular variables
In addition to defining non-linear relationships between variables and outcome, our method also highlights non-linearity in the relationship between clinical variables and molecular markers (Figure 3C and D) and suggests a simple strategy for patient management (Figure 3E). As highlighted by the combined model, serum cytokine levels are most useful among patients that are identified as being at risk based on their clinical variables. If the clinical predictor is low (left side of Figure 3C), little additional information is gained by measuring the patient's cytokine levels (Figure 3D). If the clinical predictor is high (right side of Figure 3C), serum cytokine levels markedly improve risk assessment (Figure 3D). Thus, we find that cytokine levels are informative, but only in a subset of patients. This may explain why reports aiming to identify prognostic markers without taking into account clinical variables are either conflicting or find that cytokine levels have marginal prognostic value (Kimmel et al, 1998; Zimmermann et al, 1999; Tripepi et al, 2005).
Our combined model highlights potentially important interactions between clinical variables and cytokine levels that are readily interpretable. At a broad level, patients at risk of early mortality based on advanced age or vascular access through the neck are more susceptible to additional insults, such as excess inflammation (IL-12), infection (Ang), or cardiovascular compromise (VCAM-1). We can also speculate on more specific, synergistic interactions between the clinical and cytokine variables. Low serum albumin levels have been strongly linked to impaired immune function, bacteremia, and sepsis in hemodialysis patients (Zeltzer et al, 1997; Katneni and Hedayati, 2007). In the context of impaired immunity, low levels of IL-12 and Ang could exacerbate a predisposition to infection. Similarly, low diastolic blood pressure is thought to reflect an underlying impairment of cardiac reserve (Poldermans et al, 1999). Impaired cardiac reserve, superimposed on endothelial dysfunction and accelerated atherosclerosis (high VCAM-1), would render patients especially vulnerable to cardiac-related mortality. Thus, specific cytokine alterations are particularly important among patients otherwise predisposed to related adverse outcomes. This finding converges with the current trend toward personalized medicine: just as certain drugs are only effective in specific subsets of patients (Million, 2006), so too prognostic tests based on molecular markers may be most informative following patient selection (Figure 3E). Since commercial assays already exist for Ang, IL-12, and VCAM-1, our model can be implemented without introducing new and expensive technology into clinical laboratories.
The approach taken here can also be applied to other problems in prognosis. We used protein microarrays to measure a focused set of molecular markers and logistic regression to identify the most informative variables. We then built two generalized additive models, one based on clinical parameters and the other on molecular markers. By combining the models in an orthogonal manner and estimating probability density functions, we computed a continuous predictor of patient outcome. Importantly, no assumptions were made in the final model concerning the relationships between variables and outcome. The result was an easily interpretable model that suggests new strategies for therapeutic intervention, provides clear guidelines for patient management, and offers a way to select patients for clinical trials. We anticipate that the approach described here will prove useful not only for prognosis but also for understanding other complex data sets in which the relationships between variables and outcome are non-linear or unknown.
Materials and methods
ArMORR
ArMORR is a nationally representative prospective cohort study of US patients who initiate chronic hemodialysis at any one of >1000 dialysis centers operated by Fresenius Medical Care, North America. Clinical data are collected prospectively and entered into a central database uniformly by practitioners at the point of care. Likewise, all patient blood samples are uniformly shipped to and processed by Spectra East (Rockland, NJ), a GCP-accredited central laboratory.
Protein microarrays
Antibodies were spotted onto aldehyde-displaying glass substrates using a piezoelectric microarrayer. Ninety-six identical microarrays were fabricated in a 12 × 8 pattern on the glass substrate, and the glass was subsequently attached to the bottom of a bottomless 96-well microtiter plate using an intervening silicone gasket. Serum samples were diluted 1:3 with HBS (10 mM HEPES, 10 mM NaCl, 0.004% NaN3, pH 7.4) supplemented with 1% bovine serum albumin (w/v) and applied to the arrays. To generate eight-point standard curves for each cytokine, recombinant cytokines were mixed, diluted in HBS supplemented with 25% fetal bovine serum, and applied to the wells in column 12 of the microtiter plate. Captured cytokines were detected with a cocktail of biotinylated detection antibodies, followed by a PBXL3 conjugate of streptavidin. Replicate spots from duplicate wells were averaged and related back to the appropriate standard curve to obtain the concentration for each antigen in each sample.
Data preprocessing
For non-cytokine variables, missing data and outliers (∣x−Q2∣>2(Q3−Q1)) were mostly due to uncorrectable errors in clerkship, and were replaced with Q2 (Q1, Q2, and Q3 represent the first, second, and third quartiles, respectively). For cytokines, undetectable levels were replaced with 1/10 of the lowest non-zero value measured, while outliers (∣x−Q2∣>5(Q3−Q1)) were replaced with Q2±5(Q3−Q1) to minimize their influence on model fitting. Outliers and missing data represented less than 2.5% of the data.
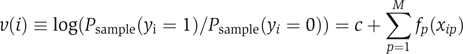
Generalized additive models
Let xip (1⩽i⩽N, 1⩽p⩽M) be the value of the p-th variable of the i-th patient, and yi be the outcome of the i-th patient: yi=0 for survival and yi=1 for death. Linear additive models were fit using the ‘glmfit' function of MatLab (The MathWorks Inc.). Variable selection was based on the p-values of bp's. To discover non-linearity in the relationship between variables and outcome, the linear models were refined by fitting generalized additive models (Buja et al, 1989) of the form
 |
where c is a constant, and fp(xip) is a smoothing spline. To ensure uniqueness of the fitting,  was constrained to be zero for each p. To avoid over-fitting, the nominal degree of freedom for fp(xip) was constrained to be two for each p (the trace of the smoother matrix was set to three by adjusting the smoothing parameter). Minimizing deviance (−2•(log-likelihood)), the solution was attained by backfitting (Buja et al, 1989). To mimic Bayesian posterior calculations, a collection of B=100 bootstrap samples was generated from the original data set and fit to the models. This resulted in a collection of fits, from which we computed the means and variances of the constants, c's, and the splines, fp(xip)'s.
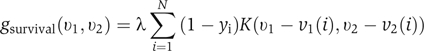
Kernel density estimation
Let v1(i) and v2(i) be the values of the non-cytokine and cytokine predictors for the i-th patient, respectively. The density of death cases in the two-dimensional v1−v2 space at point (v1, v2), where v1 and v2 are the values of non-cytokine and cytokine predictors, was estimated by
 |
and that of survival cases by
 |
where γ and λ were normalization factors such that
 |
and the kernel K was chosen to be Gaussian. Variance of the density estimates was minimized by bagging (averaging estimates over a collection of 100 bootstrap samples). We denote the ‘bagged' estimates as  and
and  . The probability of death Dpopulation as a function of v1 and v2 was computed using the following equation:
where δ=0.1 is the overall death rate of hemodialysis patients by the 15th week of therapy. Further details for all methods are provided as Supplementary methods.
Contributions
JRC and TK are co-first authors. TK developed and performed protein microarray experiments. JRC carried out data analysis and model building. RT orchestrated the ArMORR sample collection and database. GM directed and supervised the study. JRC and GM wrote the manuscript, with contributions from TK and RT. All four authors contributed to interpretation of the results.
Supplementary Material
Supplementary Methods
Supplementary Table 1
Supplementary Table 2
Supplementary Figure 1
Supplementary Data
Acknowledgments
We thank Patrick Wolfe, Xiao-Li Meng, and Kenneth Kaushansky for discussions. This work was supported by awards from the WM Keck Foundation and the Arnold and Mabel Beckman Foundation, and by grants from the National Institutes of Health. TK is the recipient of an Eli Lilly graduate student fellowship, JRC is the recipient of a Corning CoStar graduate student fellowship and was supported by the Genetics and Genomics training program at Harvard University, and RT was supported by DK071674 and DK068465.
References
- Alizadeh AA, Eisen MB, Davis RE, Ma C, Lossos IS, Rosenwald A, Boldrick JC, Sabet H, Tran T, Yu X, Powell JI, Yang L, Marti GE, Moore T, Hudson J Jr, Lu L, Lewis DB, Tibshirani R, Sherlock G, Chan WC, Greiner TC, Weisenburger DD, Armitage JO, Warnke R, Levy R, Wilson W, Grever MR, Byrd JC, Botstein D, Brown PO, Staudt LM (2000) Distinct types of diffuse large B-cell lymphoma identified by gene expression profiling. Nature 403: 503–511 [DOI] [PubMed] [Google Scholar]
- Besarab A, Bolton WK, Browne JK, Egrie JC, Nissenson AR, Okamoto DM, Schwab SJ, Goodkin DA (1998) The effects of normal as compared with low hematocrit values in patients with cardiac disease who are receiving hemodialysis and epoetin. N Engl J Med 339: 584–590 [DOI] [PubMed] [Google Scholar]
- Buja A, Hastie T, Tibshirani R (1989) Linear smoothers and additive models (with discussion). Ann Statist 17: 453–555 [Google Scholar]
- Duda RO, Hart PE (1973) Pattern Classification and Scene Analysis. New York: John Wiley & Sons [Google Scholar]
- Eknoyan G, Beck GJ, Cheung AK, Daugirdas JT, Greene T, Kusek JW, Allon M, Bailey J, Delmez JA, Depner TA, Dwyer JT, Levey AS, Levin NW, Milford E, Ornt DB, Rocco MV, Schulman G, Schwab SJ, Teehan BP, Toto R (2002) Effect of dialysis dose and membrane flux in maintenance hemodialysis. N Engl J Med 347: 2010–2019 [DOI] [PubMed] [Google Scholar]
- Freund Y, Schapire RE (1997) A decision-theoretic generalization of on-line learning and an application to boosting. J Comp Syst Sci 55: 119–139 [Google Scholar]
- Hanash S (2003) Disease proteomics. Nature 422: 226–232 [DOI] [PubMed] [Google Scholar]
- Hooper LV, Stappenbeck TS, Hong CV, Gordon JI (2003) Angiogenins: a new class of microbicidal proteins involved in innate immunity. Nat Immunol 4: 269–273 [DOI] [PubMed] [Google Scholar]
- Horl WH (2002) Hemodialysis membranes: interleukins, biocompatibility, and middle molecules. J Am Soc Nephrol 13 (Suppl 1): S62–S71 [PubMed] [Google Scholar]
- Hsieh CS, Macatonia SE, Tripp CS, Wolf SF, O'Garra A, Murphy KM (1993) Development of TH1 CD4+ T cells through IL-12 produced by Listeria-induced macrophages. Science 260: 547–549 [DOI] [PubMed] [Google Scholar]
- Huraib S, Tanimu D, Romeh SA, Quadri K, Al Ghamdi G, Iqbal A, Abdulla A (1999) Interferon-alpha in chronic hepatitis C infection in dialysis patients. Am J Kidney Dis 34: 55–60 [DOI] [PubMed] [Google Scholar]
- Katneni R, Hedayati SS (2007) Central venous catheter-related bacteremia in chronic hemodialysis patients: epidemiology and evidence-based management. Nat Clin Pract Nephrol 3: 256–266 [DOI] [PubMed] [Google Scholar]
- Kimmel PL, Phillips TM, Simmens SJ, Peterson RA, Weihs KL, Alleyne S, Cruz I, Yanovski JA, Veis JH (1998) Immunologic function and survival in hemodialysis patients. Kidney Int 54: 236–244 [DOI] [PMC free article] [PubMed] [Google Scholar]
- Liang Y, Diehn M, Watson N, Bollen AW, Aldape KD, Nicholas MK, Lamborn KR, Berger MS, Botstein D, Brown PO, Israel MA (2005) Gene expression profiling reveals molecularly and clinically distinct subtypes of glioblastoma multiforme. Proc Natl Acad Sci USA 102: 5814–5819 [DOI] [PMC free article] [PubMed] [Google Scholar]
- Million RP (2006) Impact of genetic diagnostics on drug development strategy. Nat Rev Drug Discov 5: 459–462 [DOI] [PubMed] [Google Scholar]
- Nahrendorf M, Jaffer FA, Kelly KA, Sosnovik DE, Aikawa E, Libby P, Weissleder R (2006) Noninvasive vascular cell adhesion molecule-1 imaging identifies inflammatory activation of cells in atherosclerosis. Circulation 114: 1504–1511 [DOI] [PubMed] [Google Scholar]
- Natarajan M, Lin KM, Hsueh RC, Sternweis PC, Ranganathan R (2006) A global analysis of cross-talk in a mammalian cellular signalling network. Nat Cell Biol 8: 571–580 [DOI] [PubMed] [Google Scholar]
- Olson KA, Verselis SJ, Fett JW (1998) Angiogenin is regulated in vivo as an acute phase protein. Biochem Biophys Res Commun 242: 480–483 [DOI] [PubMed] [Google Scholar]
- Papagianni A, Kalovoulos M, Kirmizis D, Vainas A, Belechri AM, Alexopoulos E, Memmos D (2003) Carotid atherosclerosis is associated with inflammation and endothelial cell adhesion molecules in chronic haemodialysis patients. Nephrol Dial Transplant 18: 113–119 [DOI] [PubMed] [Google Scholar]
- Peng YS, Chiang CK, Hsu SP, Pai MF, Hung KY, Kao JH (2005) Influence of hepatitis C virus infection on soluble cellular adhesion molecules in hemodialysis patients. Blood Purif 23: 106–112 [DOI] [PubMed] [Google Scholar]
- Poldermans D, Man in ‘t Veld AJ, Rambaldi R, Van Den Meiracker AH, Van Den Dorpel MA, Rocchi G, Boersma E, Bax JJ, Weimar W, Roelandt JR, Zietse R (1999) Cardiac evaluation in hypotension-prone and hypotension-resistant hemodialysis patients. Kidney Int 56: 1905–1911 [DOI] [PubMed] [Google Scholar]
- Ramaswamy S, Tamayo P, Rifkin R, Mukherjee S, Yeang CH, Angelo M, Ladd C, Reich M, Latulippe E, Mesirov JP, Poggio T, Gerald W, Loda M, Lander ES, Golub TR (2001) Multiclass cancer diagnosis using tumor gene expression signatures. Proc Natl Acad Sci USA 98: 15149–15154 [DOI] [PMC free article] [PubMed] [Google Scholar]
- Ridker PM, Rifai N, Rose L, Buring JE, Cook NR (2002) Comparison of C-reactive protein and low-density lipoprotein cholesterol levels in the prediction of first cardiovascular events. N Engl J Med 347: 1557–1565 [DOI] [PubMed] [Google Scholar]
- Ritz E (2004) Atherosclerosis in dialyzed patients. Blood Purif 22: 28–37 [DOI] [PubMed] [Google Scholar]
- Serradell M, Diaz-Ricart M, Cases A, Zurbano MJ, Lopez-Pedret J, Arranz O, Ordinas A, Escolar G (2002) Uremic medium causes expression, redistribution and shedding of adhesion molecules in cultured endothelial cells. Haematologica 87: 1053–1061 [PubMed] [Google Scholar]
- Teng M, Wolf M, Lowrie E, Ofsthun N, Lazarus JM, Thadhani R (2003) Survival of patients undergoing hemodialysis with paricalcitol or calcitriol therapy. N Engl J Med 349: 446–456 [DOI] [PubMed] [Google Scholar]
- Teng M, Wolf M, Ofsthun MN, Lazarus JM, Hernan MA, Camargo CA Jr, Thadhani R (2005) Activated injectable vitamin D and hemodialysis survival: a historical cohort study. J Am Soc Nephrol 16: 1115–1125 [DOI] [PubMed] [Google Scholar]
- Thadhani R, Tonelli M (2006) Cohort studies: marching forward. Clin J Am Soc Nephrol 1: 1117–1123 [DOI] [PubMed] [Google Scholar]
- Tripepi G, Mallamaci F, Zoccali C (2005) Inflammation markers, adhesion molecules, and all-cause and cardiovascular mortality in patients with ESRD: searching for the best risk marker by multivariate modeling. J Am Soc Nephrol 16 (Suppl 1): S83–S88 [DOI] [PubMed] [Google Scholar]
- U.S. Renal Data System (USRDS) (2006) Annual Data Report: Atlas of End-stage Renal Disease in the United States, National Institutes of Health, National Institute of Diabetes and Digestive and Kidney Disease, Bethesda, MD [Google Scholar]
- Wanner C, Krane V, Marz W, Olschewski M, Mann JF, Ruf G, Ritz E (2005) Atorvastatin in patients with type 2 diabetes mellitus undergoing hemodialysis. N Engl J Med 353: 238–248 [DOI] [PubMed] [Google Scholar]
- Zeltzer E, Bernheim J, Korzets Z, Rathaus M, Mekori YA, Hershkoviz R (1997) Diminished adhesion of CD4+ T cells from dialysis patients to extracellular matrix and its components fibronectin and laminin. Nephrol Dial Transplant 12: 2618–2622 [DOI] [PubMed] [Google Scholar]
- Zimmermann J, Herrlinger S, Pruy A, Metzger T, Wanner C (1999) Inflammation enhances cardiovascular risk and mortality in hemodialysis patients. Kidney Int 55: 648–658 [DOI] [PubMed] [Google Scholar]
- Zoccali C, Benedetto FA, Mallamaci F, Tripepi G, Fermo I, Foca A, Paroni R, Malatino LS (2000) Inflammation is associated with carotid atherosclerosis in dialysis patients. Creed Investigators. Cardiovascular risk extended evaluation in dialysis patients. J Hypertens 18: 1207–1213 [DOI] [PubMed] [Google Scholar]
Associated Data
This section collects any data citations, data availability statements, or supplementary materials included in this article.
Supplementary Materials
Supplementary Methods
Supplementary Table 1
Supplementary Table 2
Supplementary Figure 1
Supplementary Data