

Abstract
Objectives. We examined disparities in age-related patterns of marijuana initiation in 2 culturally distinct American Indian reservation communities (from the Northern Plains and the Southwest) compared with a national sample.
Methods. We used discrete-time survival models to estimate age-related risk for initiation with data from 2 population-based studies: the American Indian Service Utilization, Psychiatric Epidemiology, Risk and Protective Factors Project and the baseline National Comorbidity Survey.
Results. Among respondents who were born before 1960, peak risk for marijuana initiation in all samples was at age 18 years, and risk was greatest in the national sample. Among those who were born later than 1960, risk peaked at age 16 years and was highest in the American Indian samples. Males were at increased risk compared with females, especially in the older cohort and the Southwest tribal sample.
Conclusions. Findings of disproportionate risk for marijuana initiation among younger members of the tribal samples raise concerns that American Indian reservation youths may be increasingly vulnerable to drug use and its concomitants, which suggests a need for more aggressive prevention efforts in these communities.
Disproportionately high rates of alcohol use among American Indians have engendered calls for intervention efforts that target American Indian communities.1–4 At the same time, considerable gaps exist in our understanding of other substance-related disparities in these communities, especially among adults. In particular, it is unclear whether observed disparities in alcohol use reflect cultural patterns that are unique to alcohol or whether they simply represent one manifestation of a broader spectrum of heightened substance use in these communities.
Including marijuana—particularly the early use of marijuana—in the investigation of disparities is a critical next step. Marijuana is the most commonly used illegal drug among both adolescents and adults across the United States5,6 and among American Indians in particular.7–12 Findings indicate that rates of marijuana use among American Indian youths may be higher than US rates as a whole and may be higher compared with rates among most other racial/ethnic groups.7,9–12 In addition to alcohol, marijuana is an important initiating substance in reservation populations, especially on reservations where the possession and consumption of alcohol at any age is illegal.13
Early initiation of marijuana use has been associated with a variety of negative outcomes, including increased risk for misuse (Diagnostic and Statistical Manual of Mental Disorders, Fourth Edition, definition of substance abuse or dependence)14 and increased risk for use of additional substances.13,15–23 Other problem behaviors also have been associated specifically with early marijuana use, including proximal outcomes (e.g., psychopathology, antisocial behavior, and sexual risk taking) and distal outcomes (e.g., divorce and unemployment during adulthood).15,17,24–27 Identifying populations at particular risk for early marijuana use can help direct intervention efforts to communities where interventions are most needed. Identifying periods of development when youths within these high-risk populations are at greatest risk can prompt interventions that are likely to be preventive rather than corrective.
We know relatively little about age-related initiation patterns for marijuana use in American Indian communities. Some studies have found that American Indian youths have an increased risk for early marijuana use compared with other groups,9,28–30 whereas other studies have found no differences.31 Most studies of substance use among American Indians have depended on school-based samples, which often are unrepresentative because of substantial school dropout rates in these communities.32 Furthermore, such samples often preclude comparisons of initiation patterns with national samples and do not allow for direct comparison of patterns across birth cohorts.7,12,33 Studies that have reported population-based estimates using national data sources have typically included only small percentages of American Indians—percentages that are generally reflective of overall population distributions but not large enough to provide reliable estimates for American Indians.34,35 Even when sufficient numbers of American Indians have been included, multiple tribal groups have routinely been combined, and underlying differences among various cultures have been minimized or disregarded.36 Additionally, most large surveys that have included American Indians have had only small numbers of reservation-based participants; however, the unique ecologies of reservation communities are likely to shape attitudes about substance use and to contribute to disparities. For instance, many reservations are dry (possession of alcohol is illegal) or damp (possession of alcohol is not illegal, but no liquor is sold locally). Drugs, particularly marijuana, may be as readily available as alcohol in such settings. Moreover, studies that have examined substance use across American Indian groups have consistently reported tribal variation in prevalence of both use37–39 and initiation patterns,13 which makes the investigation of tribal differences imperative.
Our study adds to the base of comparative information on the initiation of marijuana use in American Indian reservation communities. We used data from 2 large-scale population-based epidemiological studies: the American Indian Service Utilization, Psychiatric Epidemiology, Risk and Protective Factors Project (AI-SUPERPFP)40 and the baseline National Comorbidity Survey (NCS).41 Discrete-time survival analysis techniques examined marijuana initiation patterns and explored differences in both level and timing of risk for initiation across the tribal and national samples. The placement of these patterns within a national context provides a fuller picture of differences in marijuana use than has heretofore been available.
One concern with estimates of marijuana use, particularly across different datasets collected at different time points, is that marijuana use rates fluctuate. Rates of use vary—sometimes dramatically across historical time periods—with older generations less likely to report lifetime marijuana use compared with younger generations.42 Thus, we considered generational patterns in reports of marijuana initiation by comparing 2 birth cohorts. Additionally, because males have an elevated risk for initiating marijuana use compared with females,15,43–47 we explored gender effects across samples and birth cohorts.
METHODS
American Indian Service Utilization, Psychiatric Epidemiology, Risk and Protective Factors Project
Participants.
The AI-SUPERPFP was a community-based epidemiological study of 2 American Indian reservation communities. The study populations comprised enrolled members of 2 closely related Northern Plains tribes and a Southwest tribe who were aged 15 to 54 years and who lived on or within 20 miles of their respective reservations at the time of sampling (1997). Criteria for tribal enrollment are set by each tribe, but they generally require that enrollees provide documentation of direct and substantial tribal lineage. Tribal enrollment is the legal definition of tribal membership, and it establishes eligibility for tribal and federal government services. To protect the confidentiality of the participating communities,48 we refer to these tribes by general descriptors rather than by specific tribal names.
We used stratified random sampling procedures; tribe, gender, and age (15–24 years, 25–34 years, 35–44 years, and ≥ 45 years) defined the strata. Tribal rolls—the official enumeration of tribal members—were used to define the target population; records were selected randomly from these rolls for inclusion in replicates (random groupings of persons defined according to the strata that comprise a sample), which were then released as needed to reach our goal of about 1500 interviews per tribe. Of those persons who were listed in the tribal rolls, 46.6% of the Southwest tribe and 39.2% of the Northern Plains tribes lived on or near the reservations; of those persons who were located and found to be eligible, 76.8% in the Northern Plains tribes (n=1638) and 73.7% in the Southwest tribe (n=1446) agreed to participate. Sample weights accounted for differential selection probabilities across strata and for differential nonresponse by strata. Details about the AI-SUPERPFP methods have been published elsewhere,37 and the study Web site provides both the interview instrument and the training manual (http://www.uchsc.edu/ai/ncaianmhr/research/superpfp.htm).
Measures.
Respondents were asked whether they had ever used marijuana and if they had, how old they were when they first did so. Because we were interested in patterns of first use, we did not differentiate between those who only experimented with marijuana use and those who became more regular users.
Design and procedure.
Written informed consent was obtained from all adult respondents, and parental or guardian consent was obtained for minors. Interviews were computer-assisted and were administered by tribal members who had received intensive training in research and interviewing methods. Extensive quality-control procedures were used to verify that location, recruitment, and interview procedures were conducted in a standardized, reliable manner.
NCS
The NCS was a stratified multistage area probability sample of 8098 US residents aged 15 to 54 years who were interviewed between 1990 and 1992. Details about sampling and methodology have been published elsewhere.38 The AI-SUPERPFP project was designed to parallel the NCS as closely as possible. Adaptations were made to the interview procedure or the wording of questions if there were cultural concerns40; questions about marijuana use and age at initiation were identical in both studies.
Combined Samples
The NCS was conducted between 1990 and 1992; the AI-SUPERPFP was conducted between 1997 and 1999. We selected only those respondents within each study who were born between 1944 and 1976 (n=9492). Respondents who were born between 1944 and 1959 were classified as the older birth cohort; those who were born between 1960 and 1976 were the younger cohort. This split was somewhat arbitrary, but it had the advantage of dividing the sample into those who grew up when marijuana use was relatively rare and those who came of age during the peak of marijuana use in the late 1970s.42
Significant demographic differences between samples included higher rates of post–high school education among US men compared with other groups; higher rates of poverty (as defined by the federal standard) in both American Indian samples, especially the Northern Plains tribes; and significantly more unemployment among American Indian men compared with US men (Table 1 ▶). Reports of lifetime substance use were, overall, fairly similar across the samples. Rates of marijuana use among men were comparable across all samples; rates among women varied, with Southwest tribal women reporting marijuana use significantly less often than did Northern Plains tribal women. Both Southwest tribal men and women reported rates of alcohol use slightly below those of the Northern Plains tribal men and women and US men and women. Tobacco use among both men and women in the Northern Plains tribes was significantly higher compared with the other samples.
TABLE 1—
Sample Characteristics of the Northern Plains and Southwest Tribes and the General American Population: American Indian Service Utilization, Psychiatric Epidemiology, Risk and Protective Factors Project, 1997–1999, and the National Comorbidity Survey (NCS), 1990–1992
| Males | Females | |||||
| Northern Plains Tribes (n = 641), % (99% CI)a | Southwest Tribe (n = 499), % (99% CI)a | NCS (n = 3379), % (99% CI)a | Northern Plains Tribes (n = 655), % (99% CI)a | Southwest Tribe (n = 678), % (99% CI)a | NCS (n = 3640), % (99% CI)a | |
| Generational cohort | ||||||
| Born 1944–1959 | 40.4 (37.3, 43.6) | 44.5 (41.3, 47.7) | 50.6 (47.5, 53.6) | 38.1 (35.3, 41.1) | 43.2 (40.2, 46.2) | 50.7 (47.8, 53.7) |
| Born 1960–1976 | 59.6 (56.4, 62.7) | 55.5 (52.3, 58.7) | 49.4 (46.4, 52.5) | 61.9 (58.9, 64.7) | 56.8 (53.8, 59.9) | 49.3 (46.3, 52.2) |
| Race/ethnicity | ||||||
| White | 0.0 | 0.0 | 76.1 (73.4, 78.6) | 0.0 | 0.0 | 72.9 (70.2, 75.4) |
| Black | 0.0 | 0.0 | 9.9 (8.3, 11.8) | 0.0 | 0.0 | 13.2 (11.4, 15.4) |
| Hispanic | 0.0 | 0.0 | 10.5 (8.7, 12.5) | 0.0 | 0.0 | 10.0 (8.3, 11.9) |
| Asian | 0.0 | 0.0 | 3.3 (2.3, 4.6) | 0.0 | 0.0 | 3.6 (2.6, 5.0) |
| American Indian | 100.0 | 100.0 | 0.3 (.09, .7) | 100.0 | 100.0 | 0.3 (.1, .7) |
| Education | ||||||
| < 12 y | 39.1 (34.0, 44.5) | 31.8 (26.5, 37.7) | 24.0 (21.3, 26.8) | 39.5 (34.3, 44.8) | 26.1 (21.9, 30.9) | 20.7 (18.4, 23.3) |
| 12 y | 37.2 (32.1, 42.6) | 41.6 (35.9, 47.5) | 35.6 (32.7, 38.7) | 25.5 (21.2, 30.4) | 36.4 (31.7, 41.4) | 37.9 (35.0, 40.8) |
| Post–high school | 23.7 (19.5, 28.6) | 26.6 (21.7, 32.2) | 40.4 (37.5, 43.4) | 35.0 (30.0, 40.4) | 37.5 (32.7, 42.6) | 41.4 (38.6, 44.3) |
| Poverty statusb | ||||||
| Poorc | 59.1 (53.5, 64.4) | 41.5 (35.6, 47.6) | 10.3 (8.6, 12.3) | 62.2 (56.7, 67.4) | 45.5 (40.3, 50.7) | 15.5 (13.5, 17.7) |
| Employment | ||||||
| Student | 3.2 (1.9, 5.6) | 3.2 (1.6, 6.2) | 15.8 (13.5, 18.3) | 8.3 (5.9, 11.6) | 5.3 (3.4, 8.0) | 12.8 (11.0, 14.7) |
| Working for pay | 67.0 (61.8, 71.9) | 69.1 (63.4, 74.3) | 77.1 (74.3, 79.7) | 56.9 (51.5, 62.1) | 64.8 (59.8, 69.4) | 64.5 (61.6, 67.2) |
| Unemployedd | 29.8 (25.1, 34.9) | 27.7 (22.7, 33.3) | 7.2 (5.8, 8.9) | 34.8 (29.9, 40.1) | 30.0 (25.6, 34.8) | 22.8 (20.4, 25.4) |
| Marital Status | ||||||
| Separated, divorced, or widowed | 15.8 (12.3, 20.1) | 11.0 (8.0, 14.9) | 6.7 (5.5, 8.1) | 20.0 (16.2, 24.5) | 12.8 (9.9, 16.3) | 11.5 (9.9, 13.4) |
| Never married | 30.0 (25.3, 35.2) | 24.2 (19.5, 29.5) | 34.6 (31.8, 37.6) | 20.8 (16.8, 25.3) | 18.8 (15.2, 23.0) | 26.7 (24.2, 29.2) |
| Married/living with significant other | 54.2 (48.7, 59.5) | 64.9 (59.1, 70.3) | 58.7 (55.6, 61.7) | 59.2 (53.9, 64.3) | 68.5 (63.6, 73.0) | 61.9 (59.0, 64.6) |
| Substance use | ||||||
| Lifetime marijuana usee | 58.3 (52.8, 63.6) | 54.4 (48.5, 60.2) | 55.2 (52.1, 58.2) | 49.2 (43.9, 54.5) | 33.3 (28.6, 38.4) | 44.7 (41.8, 47.6) |
| Lifetime alcohol usef | 76.2 (71.2, 80.7) | 70.5 (64.7, 75.7) | 80.6 (78.1, 83.0) | 70.1 (65.1, 74.8) | 39.2 (34.2, 44.4) | 62.0 (59.2, 64.8) |
| Lifetime tobacco useg | 70.2 (64.9, 75.0) | 43.3 (37.6, 49.2) | 47.0 (42.9, 51.1) | 70.2 (65.0, 74.9) | 23.9 (19.8, 28.6) | 43.0 (39.1, 46.9) |
Note. CI = confidence interval.
aPercentages and confidence intervals were weighted.
bPoverty status was assessed by comparing respondent household composition and income to federal definitions of poverty in the year of the interview.
cRespondents were classified as “poor” if their household income was below the federal poverty line.
dIncludes homemaker, looking for work, unemployed, retired, permanently disabled, and other.
eDefined as ever having tried marijuana.
fDefined as ever having had more than 12 drinks of alcohol in any 1 year.
gDefined in NCS as regular cigarette use for one month; defined in AI-SUPERPFP as at least 5 packs of cigarettes ever smoked.
Analyses
We used survey logistic regression procedures to conduct inferential analyses with SAS version 9.1 (SAS Institute Inc, Cary, NC); both sample and nonresponse weights were used. Discrete-time survival analysis techniques followed the procedures described by Singer and Willett.49 Choices among alternative models were made on the basis of deviance score comparisons (–2 × log likelihood) and Schwarz criterion values.50 Schwarz criterion (also known as Bayesian information criterion) values provide an assessment of the relative fit across different models with different numbers of parameters; lower Schwarz criterion values indicate a better and more parsimonious fit to the data.
The first step in the survival analyses was estimation of the baseline hazard and survival curves for marijuana use. As others have reported,45,51,52 initiation before age 10 years was extremely rare (Northern Plains tribes = 1.0%, Southwest tribe = .4%, and NCS sample = .3%), and the vast majority of marijuana use was initiated before age 25 years (Northern Plains tribes = 91.1%, Southwest tribe = 91.3%, and NCS = 93.7%). Thus, we included 16 age periods: 1 period for before age 10 years and 15 periods for each age between 10 and 24 years. Individuals who never reported marijuana use or who reported initial use after age 24 years were coded as not having initiated marijuana use during the age period under investigation.
Subsequent survival models included the systematic inclusion of covariates for sample (NCS as the referent group), birth cohort (the older cohort as the referent group), gender (females as the referent group), and interactions among these covariates. Estimation of discrete-time hazard models is generally done under the assumption of proportional hazards, where the relative risk between levels of the covariate remains constant across time periods, and hazard curves have identical shapes but are displaced vertically across levels of the covariate. In many cases, however, covariate effects produce nonproportional hazards—hazard curves that are fundamentally different in shape, not just in level—across time periods. Thus, we tested nonproportional hazard models; where we found significant improvements in fit over the proportional models, we retained the non-proportional models. Interactions among sample, birth cohort, and gender also were tested; when the inclusion of an interaction term resulted in improved model fit (both a significant difference in the − 2 log likelihood scores [deviance] and either a reduction in the Schwarz criterion or no meaningful change in the Schwarz criterion), the effect was retained in subsequent models.
RESULTS
Marijuana Use
As shown in Table 1 ▶, reports of lifetime marijuana use varied across samples, with similar proportions among the Northern Plains tribes and NCS samples (52.3% and 52.7%, respectively) and fewer lifetime users among the Southwest tribe (40.0%). Among lifetime users, age at first use was comparable across samples: mean age at first use was 17.7 years among the Northern Plains tribes, 18.3 among the Southwest tribe, and 17.8 in the NCS sample; median age in each sample was 17 years.
Marijuana Initiation
Overall pattern.
The baseline hazard model of marijuana initiation indicated that the highest risk for initiation was during adolescence, with an upward trend in risk that began at about age 12 years and climbed steeply through age 16 years. Risk remained high between ages 16 and 18 years, and it began to decline sharply thereafter through age 24 years.
Sample effects.
We next examined variation in marijuana initiation across samples. As Table 2 ▶ shows, including indicators of tribal membership significantly improved the overall fit and reduced the Schwarz criterion over the baseline model that included age only. Overall risk for the Northern Plains tribes was slightly higher compared with the NCS sample (odds ratio [OR] = 1.16; P < .01), and risk for the Southwest tribe was significantly lower (OR = 0.80; P < .001).
TABLE 2—
Comparison of Alternative Models for Marijuana Use: American Indian Service Utilization, Psychiatric Epidemiology, Risk and Protective Factors Project, 1997–1999, and the National Comorbidity Survey, 1990–1992
| Model Comparisonsa | ||||||
| Effect | Schwarz Criterion | –2 LogL | df | Difference in Schwarz Criterion | Difference in −2 LogL | Difference in df |
| Age period | 34 455.2 | 34 268.2 | 16 | |||
| Sample | ||||||
| Main effect | 34 442.7 | 34 232.4 | 18 | –12.5 | 35.8* | 2 |
| Main effect without proportional hazardb | 34 729.2 | 34 168.2 | 48 | 286.5 | 64.2* | 30 |
| Birth cohort | ||||||
| Main effect | 34 336.2 | 34 114.2 | 19 | –106.5 | 118.2* | 1 |
| Main effect without proportional hazard | 33 921.9 | 33 524.5 | 34 | –414.3 | 589.7* | 15 |
| Interaction with sample | 33 879.9 | 33 459.1 | 36 | –42.0 | 65.4* | 2 |
| Gender | ||||||
| Main effect | 33 748.5 | 33 316.1 | 37 | –131.4 | 143.0* | 1 |
| Main effect without proportional hazardb | 33 895.4 | 33 287.7 | 52 | 146.9 | 28.4 | 15 |
| Interaction with birth cohort | 33 730.6 | 33 286.5 | 38 | –17.9 | 29.6* | 1 |
| Interaction with sample | 33 740.4 | 33 273.0 | 40 | 9.8 | 13.6* | 2 |
Note. − 2LogL = − 2 log likelihood; df = degrees of freedom. n = 9492; number of events = 4468.
aEach model was compared with the model just above it, unless that model was rejected (as indicated by footnote b).
bAllowing nonproportional hazard for sample and gender effects either did not produce significant improvements in model fit or substantially increased the Schwarz criterion; therefore, the more parsimonious proportional hazard models of these effects were retained in subsequent models.
* P<.001
To determine whether sample effects were consistent across age, we allowed for a non-proportional hazard (Table 2 ▶). Although this model represented a statistically significant improvement in overall fit, it also resulted in a sizeable increase in the Schwarz criterion value, which indicated that despite the significant gain in fit, the size of the improvement was small relative to the additional complexity of the model. Examination of hazard curves and survival curves for the proportional and nonproportional models showed them to be quite similar, with differences indicative of minor variations rather than systematic patterns; the simpler proportional model was therefore retained for further analyses.
Birth cohort effects.
We examined birth cohort differences by including cohort as a covariate, which significantly improved overall fit and substantially reduced the Schwarz criterion (Table 2 ▶). Both the allowance for a nonproportional cohort effect (differences between cohorts free to vary across age periods) and a cohort × sample interaction further improved the fit of the model.
Gender effects.
A final set of models compared the hazard for marijuana initiation by gender, including interactions between gender and both sample and birth cohort. As Table 2 ▶ shows, this model provided a better fit (a non-proportional effect was not indicated).
Final model.
The final model included effects for sample, cohort (nonproportional hazards), gender, and 2-way interactions among these 3 factors (Table 3). Hazard curves are plotted in Figures 1 ▶ and 2 ▶. These curves represent the conditional probability of marijuana use at each age among individuals who had not used marijuana before that age—thus, they represent the probability of marijuana initiation by age. For example, the probability of boys in the younger cohort initiating marijuana use at age 16 years was .13 in the NCS, .15 among the Southwest tribe, and .16 among the Northern Plains tribes (Figure 2 ▶).
FIGURE 1—
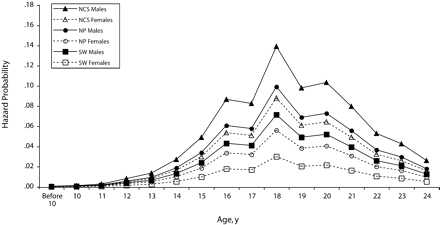
Marijuana initiation hazard curves for those born from 1944–1959 in the Northern Plains (NP) and Southwest (SW) tribes and a national sample: American Indian Service Utilization, Psychiatric Epidemiology, Risk and Protective Factors Project (AI-SUPERPFP), 1997–1999, and the National Comorbidity Survey (NCS), 1990–1992.
FIGURE 2—
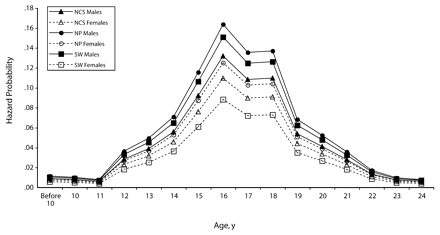
Marijuana initiation hazard curves for those born from 1960–1976 in the Northern Plains (NP) and Southwest tribes (SW) and a national sample: American Indian Service Utilization, Psychiatric Epidemiology, Risk and Protective Factors Project (AI-SUPERPFP), 1997–1999, and the National Comorbidity Survey (NCS), 1990–1992.
The curves for the younger and older cohorts differed not only in the level of risk (the vertical displacement of the curves) but also in horizontal displacement; among all 3 samples, the risk for marijuana initiation peaked earlier in the younger cohort (age 16 years) compared with the older cohort (age 18 years). The shapes of the hazard curves also varied across cohorts: both curves were characterized by 1 predominant peak, but the off-peak risk patterns were somewhat different. In the younger cohort, risk was more concentrated during mid-adolescence, with a steep rise between ages 12 and 16 years, a slight drop at ages 17 and 18 years, and a steep decrease thereafter; by age 20 years, the risk for initiating marijuana use was relatively low. By contrast, in the older cohort the curve was somewhat flatter, and moderate levels of risk were still apparent beyond adolescence.
Interactions between cohort, gender, and sample were reflected in different relative positions of the hazard curves for the Northern Plains tribes, the Southwest tribe, and the NCS sample across the older and younger cohorts and across gender. Among both males and females in the older cohort, hazard was highest for the NCS sample, it was about one third lower for the Northern Plains tribes, and it was another third lower for the Southwest tribe. In the younger cohort, the pattern was reversed among males (risk highest among the Northern Plains tribes, second highest among the Southwest tribe, and lowest in the NCS sample) and was partially reversed among females (highest among the Northern Plains tribes, second highest in the NCS sample, slightly lower among the Southwest tribe).
DISCUSSION
Common Patterns in Marijuana Initiation
Our findings highlight important similarities in marijuana initiation between these American Indian populations and other Americans. The overall hazard and survival curves were more similar than different, with peak risk occurring consistently between ages 16 and 18 years. Across all 3 samples, the highest risk for marijuana initiation occurred during adolescence; therefore, it is necessary to direct prevention resources toward early adolescence.
Birth cohort effects also transcended samples: peak risk for initiation occurred about 2 years earlier in the younger cohort (age 16 years) than it did in the older cohort (age 18 years). This finding is consistent with previous reports of marijuana initiation occurring earlier in adolescence, and it shows that these age trends cut across cultural lines. Such findings are not trivial. Early marijuana use has been associated with a host of developmental problems, including subsequent marijuana abuse or dependence, use of additional substances, and a variety of other adverse outcomes.16–27 Confirmation that marijuana use is beginning earlier in adolescence suggests a need for aggressive prevention efforts with younger youths, such as targeting children in elementary school before the risk for marijuana initiation begins to escalate. Gender effects also were largely consistent across samples. Males had an elevated risk for marijuana initiation, which confirms reports from other populations of gender differences in risk for substance use.44–47
Disparities in Marijuana Initiation
Several important differences in patterns of marijuana initiation also were evident. Most notable was that the variation across birth cohorts was more pronounced in the 2 tribal samples than in the national sample. In fact, the relative risk for initiation across the 3 samples was fundamentally different across the cohorts. The older NCS cohort had a significantly higher risk compared with either of the tribal samples (and risk was extremely low in the older Southwest tribal cohort). By contrast, among those who were born after 1959, Northern Plains tribal members had the highest risk for initiating marijuana use. Among men, the Southwest tribe had the second highest risk, and the NCS sample had the lowest; among women, the Southwest tribe had the lowest risk, with the gap between the Southwest tribal women and NCS women considerably smaller than the gap in the older cohort. Thus, although the trend toward earlier marijuana initiation crossed cultural lines, cohort differences in the degree of risk at each age were apparent only in the American Indian communities. These findings are consistent with other reports that have cited increasing problems with marijuana in American Indian communities. The tribal differences we found underscore the importance of considering the cultural diversity inherent in the American Indian population. Our research consistently found Northern Plains tribal members had a greater risk for substance use compared with Southwest tribal members.39,53 What is of most concern here, however, is the suggestion that cultural differences may be less apparent among younger tribal members and that, overall, American Indian youths had a greater risk for early marijuana use compared with either their elders or their peers across the country. These findings suggest that cultural differences seen in earlier cohorts may be attenuated in later cohorts, perhaps as a result of cultural changes that have tended to make differences in aboriginal culture less important, and that common vulnerabilities among reservation-dwelling youths may be emerging, perhaps as a result of increased access to drugs coupled with a continued lack of economic and educational opportunity.54–56
Of additional note was the differential strength of gender effects across birth cohorts and across samples. Although a gender gap in risk for marijuana initiation was apparent across samples and cohorts, the differences were most apparent among older members of the Southwest tribe, with whom risk was substantially lower among women than among men.
Limitations
Our findings contribute substantially to understanding patterns of marijuana initiation in American Indian communities; nevertheless, they must be considered in light of important limitations. First, although our analyses represent an important first step in clarifying the level and the extent of both intertribal and tribal–national disparities in marijuana initiation, they involved only 2 of the hundreds of tribes in the United States and thus offer only a glimpse into the complex array of commonalities and disparities across both tribal and national samples.
Assessments of age at marijuana initiation were made on the basis of cross-sectional samples and retrospective self-reports; thus, the assessments were susceptible to errors associated with the filters of both time and response bias.57,58 Although we attempted to minimize the biases associated with these methods by ensuring participant confidentiality and by using standardized assessment instruments, these filters may have operated somewhat differently across samples, birth cohorts, and genders.
Additionally, joint analyses that combine data from distinct epidemiological projects raise concerns about methodological inconsistencies.59 Despite the extensive similarities across these studies and the careful efforts of AI-SUPERPFP designers to ensure comparable procedures, inevitable differences exist that potentially confound interpretations of findings (e.g., differences in the historical timing of data collection). However, until American Indian populations are included in national efforts with sufficient representation for separate analyses, careful comparative studies such as ours will continue to offer the primary mechanisms for understanding disparities.
Public Health Implications
We have described cultural patterns in the initiation of marijuana use. Although subsequent analyses will allow us to examine the implications of these patterns in tribal communities, implications for public health interventions have already emerged. Specifically, these findings point to who is likely to benefit most from prevention efforts and when these efforts are likely to be most effective. Our finding that the highest risk for early initiation shifted from the national sample in the older cohort to the tribal samples in the younger cohort suggests an increasing need for prevention efforts with American Indian youths. Results also indicate that gender is sometimes but not always important in targeting interventions for drug abuse prevention. For example, although prevention efforts for the Southwest tribe could be geared primarily toward boys, prevention efforts for the Northern Plains tribes must be designed to reach both girls and boys. Our finding that risk for marijuana initiation began to accelerate around age 11 or 12 years in the younger cohort indicates that effective prevention must begin in elementary school. Further exploration of these data—i.e., examining hazard curves for early marijuana use associated with potential correlates such as childhood exposure to trauma or early use of alcohol or tobacco—will help identify specific groups of children for whom prevention efforts will be most critical.
TABLE 3—
Parameter Estimates (B) for Covariate Effects in Discrete-Time Hazard Models of Age of First Marijuana Use
| Regression Estimates | ||
| Ba (SE) | Odds Ratio | |
| Sample | ||
| NP tribes | –.26* (–.11) | .78 |
| SW tribe | –.90* (–.12) | .41 |
| Birth cohort × sample | ||
| Younger, NP tribes | .56* (–.11) | 1.75 |
| Younger, SW tribe | .74* (–.12) | 2.09 |
| Male gender | .54* (–.07) | 1.72 |
| Birth cohort × gender | ||
| Younger males | –.37* (–.08) | .69 |
| Sample × gender | ||
| Males, NP tribes | .01 (–.10) | 1.01 |
| Males, SW tribe | .39* (–.12) | 1.47 |
Note. NP = Nothern Plains; SW = Southwest. n = 9492; number of events = 4468.
aMain effects Bs are the parameter estimates for the referent group, and interaction effects represent differential effects across birth cohorts, genders, and tribes. The SE corresponding to each parameter estimate (B) is the standard error of the estimate.
* P < .001
Acknowledgments
This research was supported by the National Institute of Mental Health (grants R01 MH48174 and P01 MH42473) and the National Institute on Drug Abuse (grants R01 DA14817 and R01 DA17803).
The following are members of the AI-SUPERPFP team: Cecelia K. Big Crow, Dedra Buchwald, Buck Chambers, Michelle L. Christensen, Denise A. Dillard, Karen DuBray, Paula A. Espinoza, Candace M. Fleming, Ann Wilson Frederick, Joseph Gone, Diana Gurley, Lori L. Jervis, Shirlene M. Jim, Carol E. Kaufman, Ellen M. Keane, Suzell A. Klein, Denise Lee, Monica C. McNulty, Denise L. Middlebrook, Laurie A. Moore, Tilda D. Nez, Ilena M. Norton, Theresa O’Nell, Heather D. Orton, Carlette J. Randall, Angela Sam, James H. Shore, Sylvia G. Simpson, and Lorette Yazzie.
AI-SUPERPFP would not have been possible without the significant contributions of many people. The following interviewers, computer and data management, and administrative staff supplied energy and enthusiasm for an often difficult job: Anna E. Barón, Antonita Begay, Amelia I. Begay, Cathy A.E. Bell, Phyllis Brewer, Nelson Chee, Mary Cook, Helen J. Curley, Mary C. Davenport, Rhonda Wiegman Dick, Marvine D. Douville, Pearl Dull Knife, Geneva Emhoolah, Fay Flame, Roslyn Green, Billie K. Greene, Jack Herman, Tamara Holmes, Shelly Hubing, Cameron Joe, Louise F. Joe, Cheryl L. Martin, Jeff Miller, Robert H. Moran, Natalie K. Murphy, Melissa Nixon, Ralph L. Roanhorse, Margo Schwab, Jennifer Settlemire, Donna M. Shangreaux, Matilda J. Shorty, Selena S.S. Simmons, Wileen Smith, Tina Standing Soldier, Jennifer Truel, Lori Trullinger, Arnold Tsinajinnie, Jennifer M. Warren, Intriga Wounded Head, Theresa “Dawn” Wright, Jenny J. Yazzie, and Sheila A. Young. We also would like to acknowledge the contributions of the Methods Advisory Group: Margarita Alegria, Evelyn I. Bromet, Dedra Buchwald, Peter Guarnaccia, Steve G. Heeringa, Ron Kessler, R. Jay Turner, and William A. Vega. Finally, we thank the tribal members who so generously answered all the questions asked of them.
Human Participants Protection The protocol for this study was reviewed and approved by the Colorado Multiple Institutional Review Board. Local authorities associated with the tribal communities reviewed and approved both the study and this article. In addition to tribal approval, informed consent was obtained from all respondents; in the case of minors, consent from parents or guardians was acquired.
Peer Reviewed
Contributors S. M. Manson and J. Beals originated the AI-SUPERPFP study and supervised its implementation. N. R. White-sell conducted the data analyses and led the writing. J. Beals and C. M. Mitchell contributed significantly to data analysis. All authors interpreted findings and contributed to writing the article.
References
- 1.Beauvais F. American Indians and alcohol. Alcohol Health Res World. 1998;22:253–259. [PMC free article] [PubMed] [Google Scholar]
- 2.Moran JR. Preventing alcohol use among urban American Indian youth: the seventh generation program. J Hum Behav Soc Environ. 1999;2:51–67. [Google Scholar]
- 3.Rhoades ER, Hammond J, Welty TK, Handler AO, Amler RW. The Indian burden of illness and future health interventions. Public Health Rep. 1987;102:361–368. [PMC free article] [PubMed] [Google Scholar]
- 4.US Dept of Health and Human Services. Mental Health: Culture, Race, and Ethnicity—A Suppl to Mental Health: A Report of the Surgeon General. Rockville, Md: US Department of Health and Human Services, Substance Abuse and Mental Health Services Administration, Center for Mental Health Services; 2001.
- 5.Johnston LD, O’Malley PM, Bachman JG. Monitoring the Future National Survey Results on Drug Use, 1975–2001. Volume I: Secondary School Students. Bethesda, Md: National Institute on Drug Abuse; 2002.
- 6.Johnston LD, O’Malley PM, Bachman JG. Monitoring the Future National Survey Results on Drug Use, 1975–2000. Volume II: College Students and Adults Ages 19–40. Bethesda, Md: National Institute on Drug Abuse; 2001.
- 7.Beauvais F, Oetting ER, Wolf W, Edwards R. American Indian youth and drugs, 1976–87: a continuing problem. Am J Public Health. 1989;79:634–636. [DOI] [PMC free article] [PubMed] [Google Scholar]
- 8.Mitchell CM, Beals J, Novins DK, Spicer P, AI-SUPERPFP Team. Drug use among two American Indian populations: prevalence of lifetime use and DSM-IV substance use disorders. Drug Alcohol Dependence. 2002;69:29–41. [DOI] [PubMed] [Google Scholar]
- 9.Plunkett M, Mitchell CM. Substance use rates among American Indian adolescents: regional comparisons with Monitoring the Future high school seniors. J Drug Issues. 2000;30:593–620. [Google Scholar]
- 10.Shaughnessy L, Jones SE. Tobacco, alcohol, and other drug use among high school students in Bureau of Indian Affairs–funded schools—United States, 2001. MMWR Morb Mortal Wkly Rep. 2003;52:1070–1072. [PubMed] [Google Scholar]
- 11.Akins S, Mosher C, Rotolo T, Griffin R. Patterns and correlates of substance use among American Indians in Washington State. J Drug Issues. 2003;33:45–71. [Google Scholar]
- 12.Wallace JM Jr, Bachman JG, O’Malley PM, Johnston LD, Schulenberg JE, Cooper SM. Tobacco, alcohol, and illicit drug use: racial and ethnic differences among US high school seniors, 1976–2000. Public Health Rep. 2002;117:S67–S75. [PMC free article] [PubMed] [Google Scholar]
- 13.Novins DK, Baron A. Indian adolescent substance use: the hazards for progression for adolescents ages 14 to 20. J Am Acad Child Adolesct Psychiatry. 2004; 43:316–324. [DOI] [PubMed] [Google Scholar]
- 14.American Psychiatric Association. Diagnostic and Statistical Manual of Mental Disorders, Fourth Edition. Washington, DC: American Psychiatric Association; 1994.
- 15.Ellickson PL, Martino SC, Collins RL. Marijuana use from adolescence to young adulthood: Multiple developmental trajectories and their associated outcomes. Health Psychol. 2004;23:299–307. [DOI] [PubMed] [Google Scholar]
- 16.Ellickson PL, Hays RD, Bell RM. Stepping through the drug use sequence: longitudinal scalogram analysis of initiation and regular use. J Abnorm Psychol. 1992; 101:441–451. [DOI] [PubMed] [Google Scholar]
- 17.Robins LN, Pryzybeck PR. Age of onset of drug use as a factor of drug use and other disorders. In: Jones CL, Battjes RJ, eds. Etiology of Drug Abuse: Implications for Prevention (NIDA Resarch Monograph No. 56). Washington, DC: US Government Printing Office; 1985:178–192.
- 18.Kandel D, Yamaguchi K. From beer to crack: developmental patterns of drug involvement. Am J Public Health. 1993;83:851–855. [DOI] [PMC free article] [PubMed] [Google Scholar]
- 19.Hawkins JD, Catalano RF, Miller JY. Risk and protective factors for alcohol and other drug problems in adolescence and early adulthood: implications for substance abuse prevention. Psychol Bull. 1992;112:64–105. [DOI] [PubMed] [Google Scholar]
- 20.Yu J, Williford WR. The age of alcohol onset and alcohol, cigarette, and marijuana use patterns: an analysis of drug use progression of young adults in New York State. Int J Addict. 1992;27:1313–1323. [DOI] [PubMed] [Google Scholar]
- 21.Anthony JC, Petronis KR. Early-onset drug use and risk of later drug problems. Drug Alcohol Dependence. 1995;40:9–15. [DOI] [PubMed] [Google Scholar]
- 22.Yamaguchi K, Kandel DB. Patterns of drug use from adolescence to young adulthood: III. Predictors of progression. Am J Public Health. 1984;74:673–681. [DOI] [PMC free article] [PubMed] [Google Scholar]
- 23.Kandel DB, Yamaguchi K, Chen K. Stages of progression in drug involvement from adolescence to adulthood: further evidence for the gateway theory. J Stud Alcohol. 1992;53:447–457. [DOI] [PubMed] [Google Scholar]
- 24.Allen JP, Leadbeater BJ, Aber JL. The development of problem behavior syndromes in at-risk adolescents. Dev Psychopathol. 1994;6:323–342. [Google Scholar]
- 25.Newcomb MD, Bentler PM. Drug use, educational aspirations, and work force involvement: the transition from adolescence to young adulthood. Am J Community Psychol. 1988;14:303–321. [DOI] [PubMed] [Google Scholar]
- 26.Kandel DB, Davies M, Karus D, Yamaguchi K. The consequences in young adulthood of adolescent drug involvement. Arch Gen Psychiatry. 1986;43:746–754. [DOI] [PubMed] [Google Scholar]
- 27.Newcomb MD, Bentler PM. Consequences of Adolescent Drug Use: Impact on the Lives of Young Adults. Newbury Park, Calif: Sage Publications; 1988.
- 28.Paschane DM, Cagle HH, Fisher DG. Cocaine smokers and injection drug users in Alaska: what distinguishes Native Americans from non-Native Americans? Int J Circumpolar Health. 1998;57:474–481. [PubMed] [Google Scholar]
- 29.Federman EB, Costello EJ, Angold A, Farmer EM, Erkanli A. Development of substance use and psychiatric comorbidity in an epidemiologic study of White and American Indian young adolescents the Great Smoky Mountains Study. Drug Alcohol Dependence. 1997;44:69–78. [DOI] [PubMed] [Google Scholar]
- 30.Okwumabua JO, Duryea EJ. Age of onset, periods of risk, and patterns of progression in drug use among American Indian high school students. Int J Addict. 1987;22:1269–1276. [DOI] [PubMed] [Google Scholar]
- 31.Guo J, Hill KG, Hawkins JD, Catalano RF, Abbott RD. A developmental analysis of sociodemographic, family, and peer effects on adolescent illicit drug initiation. J Am Acad Child Adolesc Psychiatry. 2002;41:838–845. [DOI] [PubMed] [Google Scholar]
- 32.Beauvais F. Trends in drug use among American Indian students and dropouts, 1975 to 1994. Am J Public Health. 1996;86:1594–1599. [DOI] [PMC free article] [PubMed] [Google Scholar]
- 33.Beauvais F. Characteristics of Indian youth and drug use. Am Indian and Alaska Native Mental Health Res. 1992;5:50–67. [DOI] [PubMed] [Google Scholar]
- 34.Substance Abuse and Mental Health Services Administration. Results From the 2002 National Survey on Drug Use and Health: National Findings. Rockville, Md: Office of Applied Studies; 2003.
- 35.Johnston LD, Bachman JG, O’Malley PM. Monitoring the Future: Questionnaire Responses From the Nation’s High School Seniors. Ann Arbor, Mich: Institute of Social Research; 1998.
- 36.Trimble JE. Ethnic specification, validation prospects, and the future of drug use research. Int J Addict. 1990;25:149–168. [DOI] [PubMed] [Google Scholar]
- 37.Novins DK, Mitchell CM. Factors associated with marijuana use among American Indian adolescents. Addiction. 1998;93:1693–1702. [DOI] [PubMed] [Google Scholar]
- 38.Novins DK, Beals J, Mitchell CM. Sequences of substance use among American Indian adolescents. J Am Acad Child Adolesc Psychiatry. 2001;40:1168–1174. [DOI] [PubMed] [Google Scholar]
- 39.Spicer P, Novins DK, Mitchell CM, Beals J. Aboriginal social organization, contemporary experience, and American Indian adolescent alcohol use. J Stud Alcohol. 2003;64:450–457. [DOI] [PubMed] [Google Scholar]
- 40.Beals J, Manson SM, Mitchell CM, Spicer P, AI-SUPERPFP Team. Cultural specificity and comparison in psychiatric epidemiology: walking the tightrope in American Indian research. Cult Med Psychiatry. 2003; 27:259–289. [DOI] [PubMed] [Google Scholar]
- 41.Kessler RC, McGonagle KA, Zhao S, et al. Lifetime and 12-month prevalence of DSM-III-R psychiatric disorders in the United States: results from the National Co-morbidity Survey. Arch Gen Psychiatry. 1994;51:8–19. [DOI] [PubMed] [Google Scholar]
- 42.National Institute on Drug Abuse. Drug Use Among Racial/Ethnic Minorities, Revised. Rockville, Md: US Dept of Health and Human Services, National Institutes of Health, National Institute on Drug Abuse, Division of Epidemiology; 2003.
- 43.Brook JS, Kessler RC, Cohen P. The onset of marijuana use from preadolescence and early adolescence to young adulthood. Dev Psychopathol. 1999;11:901–914. [DOI] [PubMed] [Google Scholar]
- 44.De Wit DJ, Offord DR, Wong M. Patterns of onset and cessation of drug use over the early part of the life course. Health Educ Behav. 1997;24:746–758. [DOI] [PubMed] [Google Scholar]
- 45.Kandel DB, Logan JA. Patterns of drug use from adolescence to young adulthood: periods of risk for initiation, continued use, and discontinuation. Am J Public Health. 1984;74:660–666. [DOI] [PMC free article] [PubMed] [Google Scholar]
- 46.Kandel DB, Yamaguchi K. Developmental patterns of the use of legal, illegal, and medically prescribed psychotopic drugs from adolescence to young adulthood. In: Jones CL, Battjes RJ, eds. Etiology of Drug Abuse: Implications for Prevention. Vol 56. Rockville, Md: National Institute on Drug Abuse; 1985:193–235. [PubMed]
- 47.Fleming JP, Kellam SG, Brown HC. Early predictors of age of first use of alcohol, marijuana, and cigarettes. Drug Alcohol Dependence. 1982;9:285–303. [DOI] [PubMed] [Google Scholar]
- 48.Norton IM, Manson SM. Research in American Indian and Alaska Native communities: navigating the cultural universe of values and process. J Consult Clin Psychol. 1996;64:856–860. [DOI] [PubMed] [Google Scholar]
- 49.Singer JD, Willett JB. Applied Longitudinal Data Analysis: Modeling Change and Event Occurrence. New York, NY: Oxford University Press; 2003.
- 50.Kass RE, Wasserman L. A reference Bayesian test for nested hypotheses and its relationship to the Schwartz criterion. J Am Stat Assoc. 1995;90:928–934. [Google Scholar]
- 51.Kosterman R, Hawkins JD, Guo J, Catalano RF, Abbott RD. The dynamics of alcohol and marijuana initiation: patterns and predictors of first use in adolescence. Am J Public Health. 2000;90:360–366. [DOI] [PMC free article] [PubMed] [Google Scholar]
- 52.Robins LN. The natural history of drug abuse. Acta Psychiatrica Scandinavica. 1980;62:7–20. [DOI] [PubMed] [Google Scholar]
- 53.Spicer P, Beals J, Mitchell CM, et al. The prevalence of alcohol dependence in two American Indian reservation populations. Alcohol Clin Exp Res. 2003;27:1785–1797. [DOI] [PubMed] [Google Scholar]
- 54.Novins DK, Spicer P, Beals J, Manson SM. Preventing underage drinking in American Indian and Alaska Native communities: contexts, epidemiology, and culture. In: Division of Behavioral and Social Sciences and Education, ed. National Research Council and Institute of Medicine, Reducing Underage Drinking: A Collective Responsibility, Background Papers [book on CD ROM]. Washington, DC: National Academies Press; 2004:678–696.
- 55.Berman M, Hull T, May P. Alcohol control and injury death in Alaska native communities: wet, damp and dry under Alaska’s local option law. J Stud Alcohol. 2000;61:311–319. [DOI] [PubMed] [Google Scholar]
- 56.Chiu AY, Perez PE, Parker RN. Impact of banning alcohol on outpatient visits in Barrow, Alaska. JAMA. 1997;278:1775–1777. [PubMed] [Google Scholar]
- 57.Warner LA, Kessler RC, Hughes M, Anthony JC, Nelson CB. Prevalence and correlates of drug use and dependence in the United States. Results from the National Comorbidity Survey. Arch Gen Psychiatry. 1995; 52:219–229. [DOI] [PubMed] [Google Scholar]
- 58.Cummins LH, Chan KK, Burns KM, Blume AW, Larimer M, Marlatt GA. Validity of the CRAFFT in American-Indian and Alaska-Native Adolescents: screening for drug and alcohol risk. J Stud Alcohol. 2003;64:727–732. [DOI] [PubMed] [Google Scholar]
- 59.Beals J, Novins DK, Whitesell NR, et al. Prevalence of mental disorders and utilization of mental health services in two American Indian reservation populations: mental health disparities in a national context. Am J Psychiatry. 2005;162:1723–1732. [DOI] [PubMed] [Google Scholar]